HOW TO BEST POSITION FOR THE DISRUPTION?
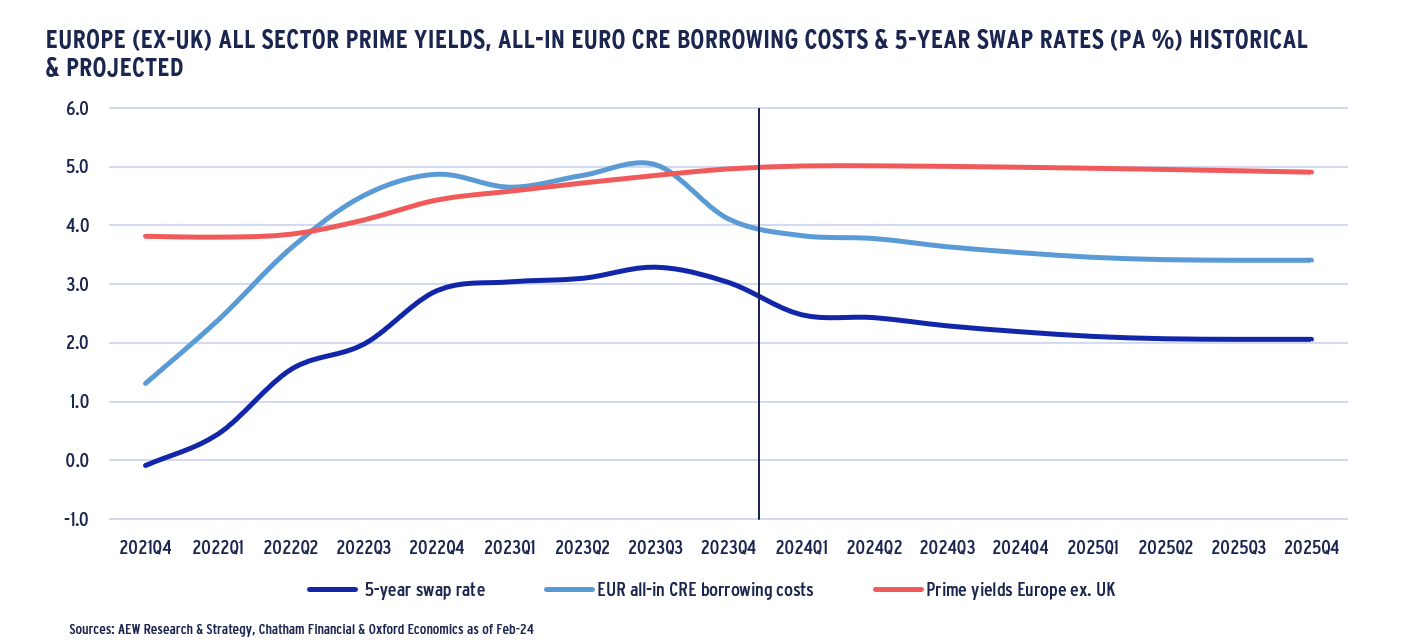
The first European cross-border war in 80 years was certainly not the post-Covid recovery policymakers had planned for. Its impact on energy and food prices combined with already challenging global supply chains have pushed inflation to new record levels. As a result, central banks have been raising policy rates and started quantitative tightening to bring inflation down. At the same time, governments are putting policies in place to protect consumers from the impact of the energy crisis. Bond and stock markets have already priced in further rate hikes, an economic slowdown as well as uncertainty around future monetary and fiscal policies. All-in borrowing for real estate have doubled over the last ten months as highlighted in the chart, reminding us that property remains a cyclical business. The key question for our 2023 European Outlook is “How can investors best position themselves for this ongoing market disruption which is finally ending the long post-GFC cycle?”
EURO & GBP ALL-IN BORROWING COSTS BASED ON MARGINS FOR COMMERCIAL REAL ESTATE MORTGAGES AND 5-YEAR SWAP RATES (PA %)
EXECUTIVE SUMMARY: POSITIONING FOR DISRUPTION
- Economic impacts of the war in Ukraine continue to play a central role in Europe. It remains unclear whether the record high inflation has now peaked as central banks are responding with rate hikes and quantitative tightening. Current wage settlements and fiscal expansionary policies might keep inflation higher for longer.
- With high levels of uncertainty, we use our scenarios to map out the possible impacts. Our new base case scenario assumes inflation returns to normal in 2023 combined with short and shallow recession. Our equally probable downside scenario assumes inflation lingers, resulting in a longer and deeper downturn.
- Our forecasts highlight residential and logistics as the most resilient in terms of rental growth. Limited supply is a key driver for this and with higher costs of debt and construction costs as well as ESG regulations supply might become even more constrained. This is expected to protect most segments against the recessionary impact on space demand. Also, the impact of WFH on office demand is less than expected.
- Investment market volumes are coming down as leveraged investors were priced out by higher costs of debt. As borrowing rates went up, yield widening started in Q2 2022 across all sectors from recent record lows. This disruption in borrowing costs is putting an end to the more than a decade long post-GFC cycle.
- Increased borrowing costs will also cause problems with the re-financing of some existing loans, which will also face the decline of collateral values and lenders’ lower refinancing LTV‘s. The resulting debt funding gap is estimated at EUR 24.2 bn and offers opportunities for new equity and new debt sources to bridge it.
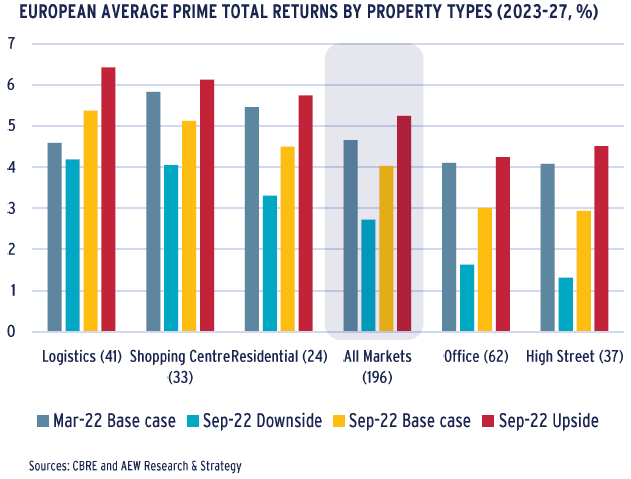
- Logistics has the highest returns of any sector at 5.4% p.a. as solid rental growth offsets yield widening. Prime shopping centers are in second place with returns of 5.1% p.a. on the back of high current yields. Yield widening has pushed 2023-27 returns across all 196 segments1 to 4.0% p.a. down from 4.7% half a year ago.
- Our relative value assessment comparing the expected (ERR) and required rates of return (RRR) confirms this reversal from last year. Across the 168 covered markets, there now is a negative excess spread of nearly 280 bps between the current ERR of 4.1% and RRR of 6.9% due to the impact of higher risk-free rates.
- This year’s result is due to the double impact from the 270 bps increase in our average government bond yield. It pushed both our RRR up and our ERR down, reversing last year’s favorable 190 bps excess spread. As yields stabilise by year-end 2024, ERR and RRR revert to a more favorable balance as per below chart.
- Despite this challenging market environment, still over 30% or 52 out of our 168 covered European markets are classified as neutral (47) or attractive (5) where investors can make their RRR . The five attractive markets are Paris light industrial, Berlin and Copenhagen logistics and Stockholm and London shopping centres.
- Geographically, the UK and Benelux rank top while CEE markets rank bottom. Logistics is our most attractive sector with nearly half (or 17 of 37) covered markets deemed attractive. Offices are most challenged with 41 of 43 office markets classified as less attractive.
REQUIRED (RRR) VS EXPECTED RATE OF RETURNS (ERR) ALL SECTORS EUROPE – 2022 vs. 2023 & 2025 BASE CASE

ECONOMIC BACKDROP – THE END OF LOWER FOR LONGER BOND YIELDS
MONETARY TIGHTENING TO BRING INFLATION DOWN
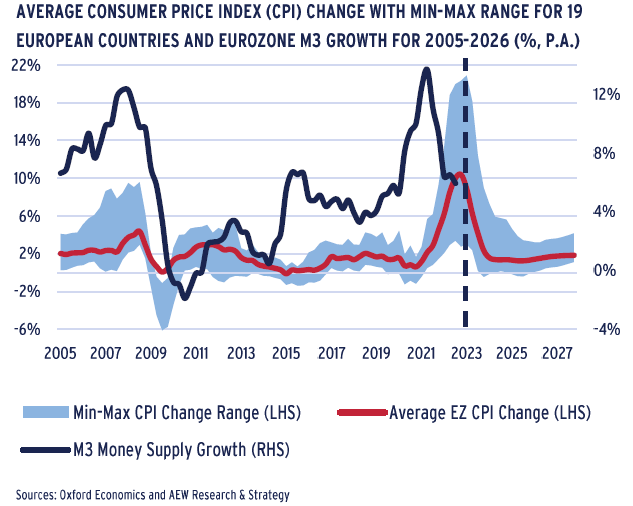
- Since the war in Ukraine started in February, the related embargos as well as shortages in energy, raw materials, and labor have pushed average Eurozone inflation to 10% p.a.
- Some CEE and Southern European countries have much higher inflation, as shown in the min-max range.
- Based on Oxford Economics, average inflation across our 19 countries has already peaked in July at 10% and is expected to come down to below the 2% target by early 2024.
- Central banks started quantitative tightening in Apr-21 with money supply (M3) coming down. If the long-term relationship between inflation and M3 now holds, inflation should be trending down.
- Since both central banks and consensus forecasts have struggled to keep up with actual inflation, it might be wise to consider an alternative higher-for-longer inflation scenario.
- Since most inflation is driven by external factors, reducing domestic demand with rate hikes might not bring it down.
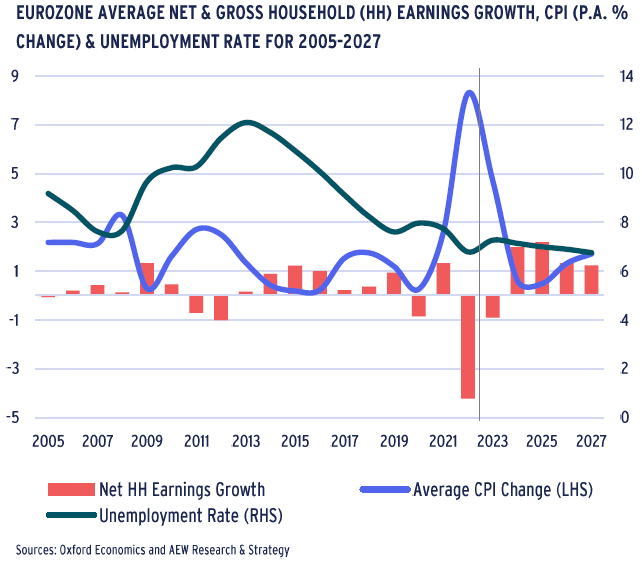
WAGE GROWTH TO KEEP INFLATION ELEVATED
- Inflation has started to impact the real economy by eroding real household earnings.
- So far, as inflation kept setting new records, most of the focus has remained on the external drivers, like energy, raw materials and food costs.
- However, some of the reasons why inflation in the medium term should come down have lost their strength as de-globalization, increasing trade tensions and de-carbonization gain traction.
- Governments want to protect their electorates from the impact of energy inflation and trade unions want to reverse the recent decline in real earnings at a time of (still) low unemployment.
- These trends might shift the inflation debate to locally negotiated wage increases. Their impact on overall CPI levels might not yet be fully reflected in the consensus forecasts.
- Despite central banks’ best efforts, a traditional wage-price spiral might not be prevented entirely. A prolonged period of elevated inflation can therefore be part of a downside scenario.
RECORD INFLATION KILLED LOWER FOR LONGER
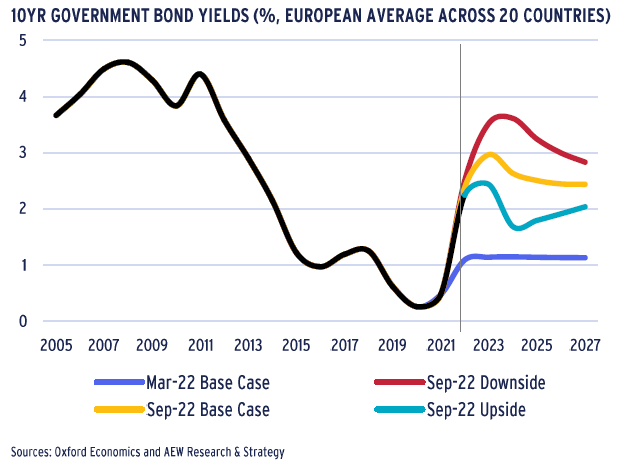
- Government bond yields have already moved up by 286 bps since the beginning of 2022 on the back of increasing inflation and the central bank rate hikes trying to fight them.
- This re-pricing means that lower for longer bond yields can not be a central theme for real estate any longer.
- During the recent period of change and volatility, we have seen forecasted bond yields being overtaken by actual pricings.
- Despite this inconvenience, we prefer to avoid similar volatility in our predictions. This means that our model assumptions consider quarter average bond yields.
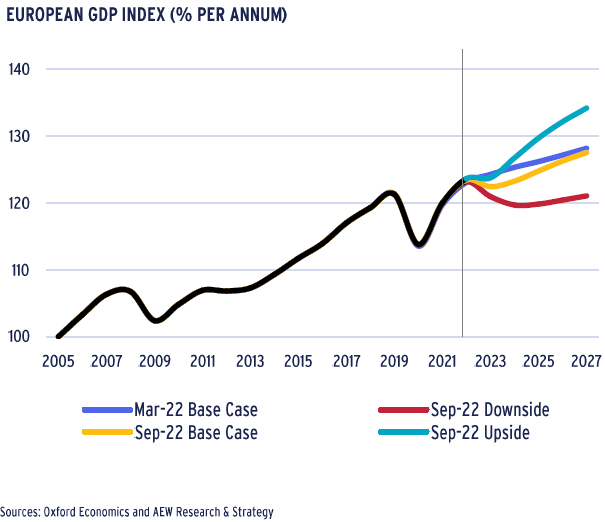
- Our base case from Oxford Economics assumes bond yields to peak in 2023 at 3% across our 20 country universe.
- The upside and downside scenarios are based on historical volatilities of historical forecasts. Annual average bond yields in these scenarios are forecasted to peak at 3.6% and 2.4% respectively.
ECONOMIC BACKDROP – HIGHER FOR LONGER INFLATION TRIGGERS RECESSION
ENERGY CRISIS POSES POLICY DILEMNAS
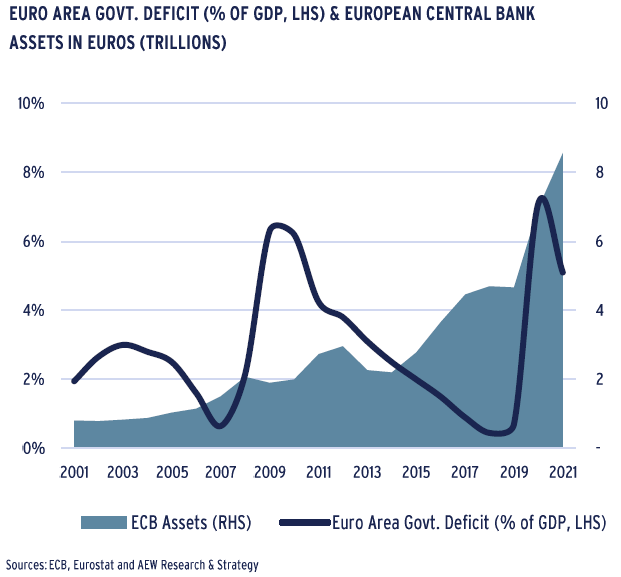
- Central banks started planning for quantitative tightening (QT) in H2 2021 in their fight against inflation. In fact, bond markets priced in the loss of their largest investor.
- However, central bank assets remain at a record level. With bond yields already moving up on the anticipation of QT, it might be hard for central banks to actually execute it without pushing yields further up.
- At the same time, governments had to step up their spending during the Covid lock-downs as reflected in their deficits.
- In the current energy crisis, most governments will again be forced to spend on gas price caps and energy cost supports.
- The aftermath of the war in Ukraine will also likely force spending on rebuilding and re-arming without any immediate productivity improvements.
- This disregards the needed spending for decarbonization.
- The central dilemma for policy makers is that fiscal expansion -- for whatever valid reasons -- renders central bank policies to fight inflation largely ineffective.
RECORD DEBT LEVELS HIGHLIGHT VULNERABILITIES
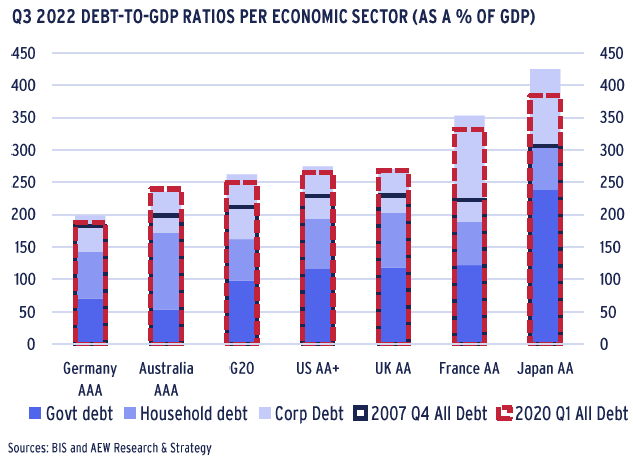
- The latest data on aggregate debt levels across government, household and corporate sectors of the economy show a number of interesting trends.
- Current versus pre-Covid (Q1 2020) levels show that especially in France (and Japan) the pandemic lifted debt as a share of GDP significantly with negative GDP growth having an impact.
- Even the German debt levels have now exceeded their pre-GFC (Q4 2007) levels and might further advance as it has announced a very large energy cost support programme.
- With interest rates very low for most of the period, G20 countries were not incentivised to reduce debt levels.
- This leaves the drivers of economic growth, such as consumer spending and corporate or government investments more vulnerable to increased costs to service the existing debts.
- Debt levels in commercial property have remained at modest levels compared to the GFC, but might still pose some issues.
BASE CASE: SHORT & SHALLOW RECESSION
- Despite low unemployment and a successfully managed rebound from the Covid lockdowns, it seems that a recession is now unavoidable for most European economies.
- Our base case from Oxford Economics assumes a short and shallow recession in Q4 2022 and most of 2023, which seems increasingly less likely given recent negative news flow.
- To reflect the risk of higher for longer inflation and government bond yields as well as the elevated sensitivity to higher rates, the downside scenario is for a deeper and longer downturn and elevated inflation until 2024.
- Our upside scenario assumes an immediate settlement of the war in Ukraine. This would allow inflation and policy rates to come back down quickly. Again, this is even more unlikely than the base case.
- The estimated probabilities across our scenarios highlight our heightened level of insecurity: a base case at 50%, downside at 45%, and upside at 5%.
MARKET OVERVIEW – LOGISTICS & OFFICES: FINDING A NEW BALANCE
LOGISTICS VACANCY TO INCREASE MODERATELY
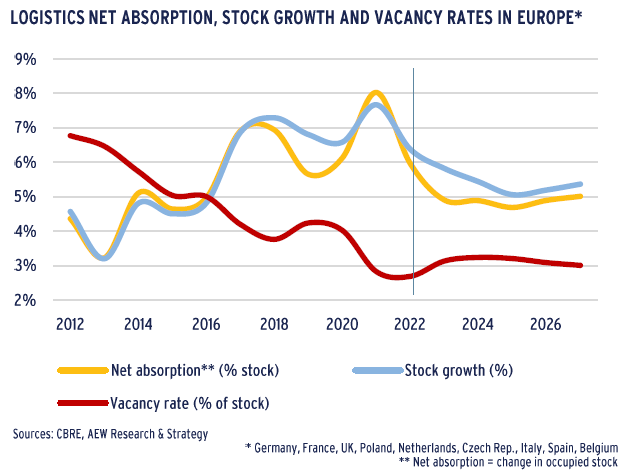
- As demand for logistics space increased, the development of new supply has accelerated over the last five years.
- Going forward, we expect a stabilization of both demand and supply at relatively balanced level.
- There might be some downside to new supply. This is because apart from increasing construction costs, the shortage of land for industrial development is likely to increase.
- EU policy objectives aim at zero net land take by 2050. With fewer greenfield sites available, existing stock eligible for conversion or brownfield sites need to be considered.
- The average logistics vacancy rate in Europe is projected to slightly increase just above 3% as net absorption is expected to balance the more limited level of future completions.
SUPPLY CHAINS STARTING TO NORMALISE
- The lifting of most Covid restrictions is reducing global supply chain pressures. The GSCPI has started to trend down but remains elevated compared to its pre-pandemic level.
- European container traffic, which had already started to slow down on the back of the US-China trade war, slumped in early 2020 due to the Covid lockdowns.
- The conflict in Ukraine seems has had so far a limited impact on container traffic in most European ports so far, with exceptions for strong Russia-linked ports, such as Rotterdam.
- As soon as the impact of the slowdown in China and upcoming recession in Europe is absorbed, we expect global trade and European shipping to support logistics space demand.
- In the meantime, the delayed supply of construction and raw materials as well as consumer goods keep inflation elevated.

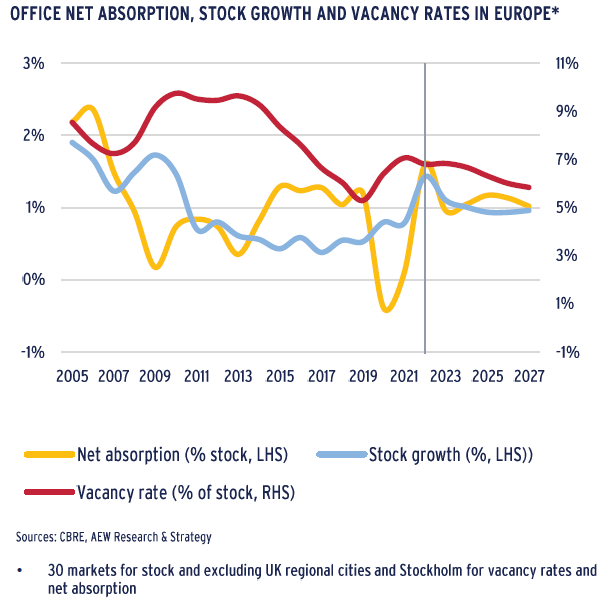
LIMITED OFFICE SUPPLY OFFSETS DEMAND DOWNSIDE
- Most concerns on offices have focused on the demand side of the market but it is important to also consider new office supply.
- Future office stock growth should be lower because:
- Higher construction costs (materials and wages) will further erode the profitability of many developers’ planned projects
- With recent rate hikes, there will be less availability of new development debt finance as well as higher interest rates
- Upcoming EPC and/or ESG regulatory requirements will force a greater focus on retrofits of existing buildings and less on creating new ones
- Based on the latest CBRE projections, net absorptions will be ahead of new additions to office stock.
- This means that the average vacancy rate across 32 office markets is expected to peak at 7.1% in 2022 and come down to below 6% by 2027.
- However, the CBRE net absorption projections might not be fully reflective of the development of hybrid working.
MARKET OVERVIEW – RETAIL: IN-STORE SALES SLOWLY STABILISING
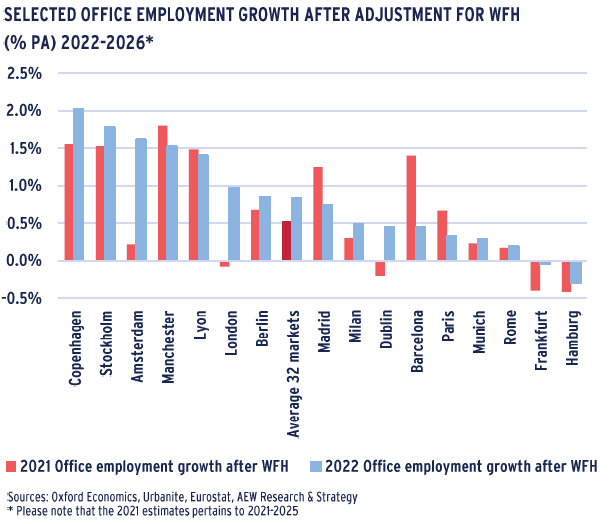
DEMAND IMPACT FROM WFH IS LESS THEN FEARED
- The impact from new hybrid working practices and increased working from home (WFH) is less then previously expected.
- It is projected that 35.5% of employees working in an office-based sector in Europe would WFH by 2026.
- This ratio compares to 27.5% pre-Covid and 66.4% of office-based employees working from home during the peak of the pandemic in July 2020.
- There has been an improvement to our estimated growth of office employment, adjusted for WFH, from 0.5% in our previous estimate to a still modest 0.8% pa across 32 markets.
- Annualized office employment growth for 2022-2026, adjusted with WFH impact, shows strongest improvements in London, Amsterdam and The Hague, compared to our last forecasts.
- Conversely, German markets score below the average and Barcelona and Paris show a deterioration of office employment growth prospects.
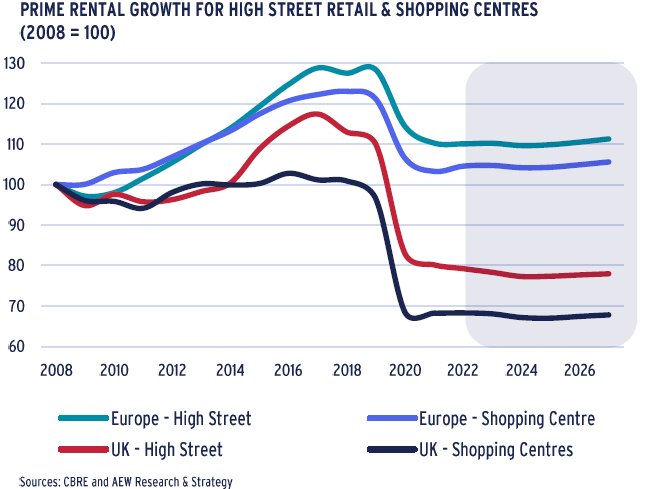
POST-COVID PRIME RETAIL RENTS STABILISED
- European high street retail posted 9% p.a. rental growth with 4% for shopping centers, in 2012-15, ahead of offices and logistics.
- After 2018, prime shopping centre rental growth turned negative as it was hit harder by the growing share of online sales, as most retailers shifted from quantity to quality of outlets.
- As a result, many retailers opened or expanded (flagship) stores in central locations, supporting prime high street rental growth.
- Covid-19 lockdowns and closings hit 2020 prime rents hard for both high street retail (-16%) and shopping centers (-20%).
- Many retailers' revenues dropped in 2020 with many forced to “rightsize” their store footprints or go out of business.
- As the lockdowns have lifted, re-openings have returned cash rent collections to normal levels and have stabilized prime rents.
- Some markets are still bound to see concessions from the reported headline rents especially as discretionary consumer spending might be impeded in the upcoming recession.
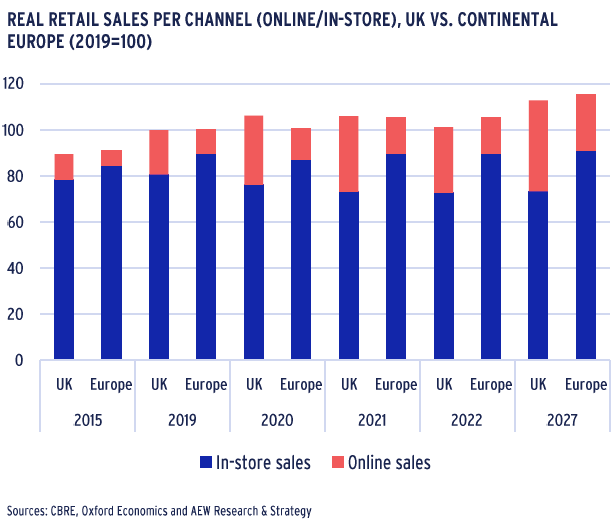
IN-STORE SALES TO STABILISE BY 2027
- Annual total real retail sales are projected to slow sharply in 2022 compared to 2021 in the UK (-4.5%) and in Continental Europe (+0.2%), as inflation is weighing on households’ purchasing power.
- Real retail sales growth is expected to remain weak in 2023 before rebounding in 2024. Overall, over the next five years, real retail sales growth is forecast to reach 2.2% p.a. in the UK and 1.8% p.a. in Continental Europe.
- This total sales growth is almost exclusively driven by the increase in online sales, expected to average 7% growth p.a. in the UK over the next five years and 9% p.a. in Continental Europe.
- In-store sales growth should remain slightly positive in both the UK (0.2% pa) and Continental Europe (0.3% pa) over the next five years.
MARKET OVERVIEW – HIGHEST RENTAL GROWTH FOR RESIDENTIAL & LOGISTICS
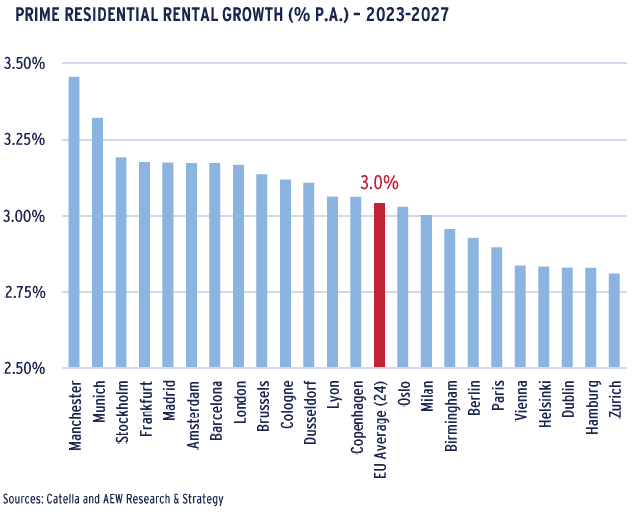
RESIDENTIAL RENTAL GROWTH EXPECTED AT 3.0%
- As before, our forecasts focus on new-built apartments which are exempt from rent control mechanisms in most markets.
- Prime residential rental growth is now expected at 3.0% p.a. for the 2023-27 period in our base case, up from 2.6% p.a. before.
- The 3.0% is well ahead of our base case inflation projected at 1.8% for the same period. However, it is a bit lower than the 3.5% p.a. on average over the past five years.
- No clear trend is detectable across these updated forecasts, as capital cities are not projected to have uniformly higher or lower growth rates than regional cities.
- Also, geographically our projections show no north-south or country differentiation making careful market and stock selection crucial.
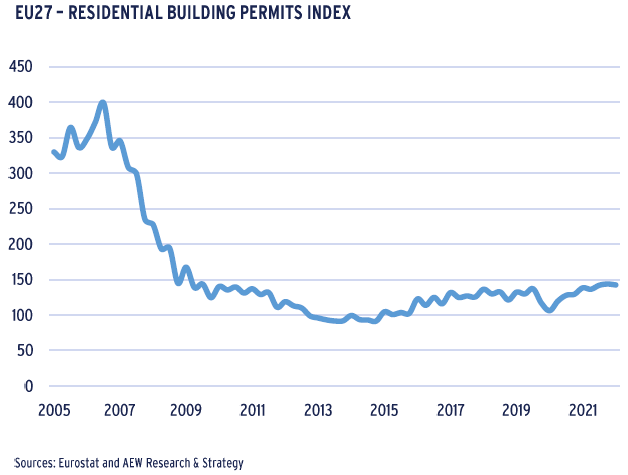
LIMITED SUPPLY AS BUILDING PERMITS LAG
- Despite a post-Covid rebound, the number of residential building permits filed in the EU27 remained low in 2022.
- With the latest increases in financing as well as construction costs, building permits might not translate into actual new residential developments going forward.
- Developers’ profitability might be impacted to such an extent, especially in markets where rent controls apply, that new developments are either postponed or canceled.
- Major differences between countries endure. Spain and Italy have experienced a rebound in permits over the past year while the reverse is true for Denmark, the Netherlands, and Sweden.
- As a consequence, the most supply-constrained cities are likely to become even tighter than before.
MODERATE RENTAL GROWTH GOING FORWARD
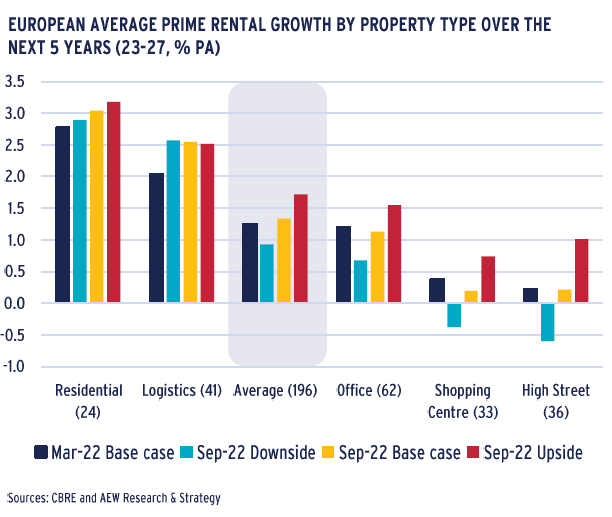
- Our average 1.3% p.a. rental growth forecasts remain mostly unchanged from March and continue to highlight residential and logistics as the most resilient sector for prime rental growth.
- Logistics rental growth shifted up to just over 2.5% p.a. But, our residential markets rents retain their top spot with a 3.0% annual increase over the next five years.
- With e-commerce penetration expected to resume, our current forecasts remain in line with our mid-year update.
- Across all sectors, rental growth is between 0.9% and 1.7% p.a. for our three current scenarios.
- Within retail, our 5-year rental forecasts still show positive growth for both high street retail and shopping centres, albeit the latter at a lower rate than expected a few months ago.
- However, widespread retail lease re-negotiations during Covid lockdowns should have led to more sustainable rent agreements and facilitated the sector’s structural adaptation.
MARKET OUTLOOK – INVESTMENT ACTIVITY SLOWING AS PROPERTY YIELDS ADJUST
ACTIVITY SLOWED AFTER STRONG H1 2022
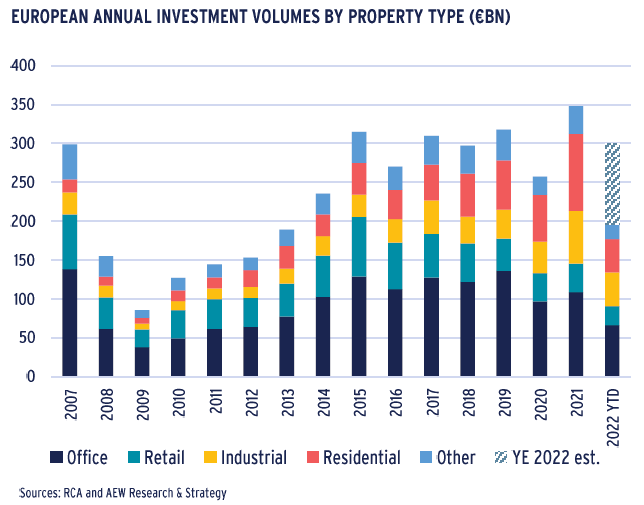
- After the 2021 record of €350bn invested in the European real estate market, AEW expects 2022 full-year volumes to land at €260bn, with €218bn invested in the first three quarters.
- With the rise in financing costs and uncertainties around the speed and extent of repricing, a large number of transactions have been withdrawn from the market.
- As the market remains in price discovery mode, many real estate investors have paused their investments. As a result, 2023 volumes are expected to be lower than in previous years.
- This is confirmed by pending deal volumes, which have been trending down since Q1 and stand at EUR 18bn at the end of September -- their lowest level for Q3 since 2013.
- Distressed sales have remained scarce but are likely to increase next year. Forced sellers might include REITs, developers, investors, and funds facing refinancing challenges.
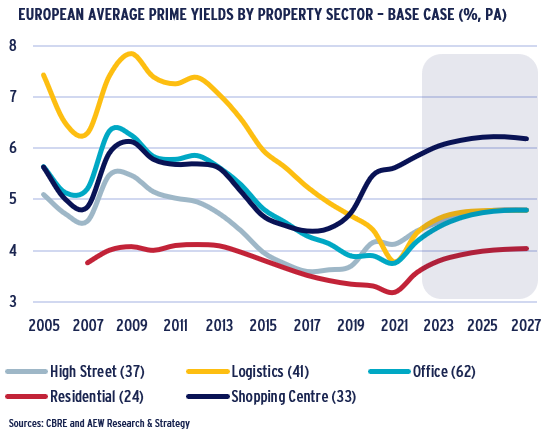
PRIME YIELDS TO WIDEN FROM HISTORIC LOWS
- Prime yields moved out for all property types in 2022 as they were all impacted by the higher swap rates and associated all-in borrowing costs.
- In reversal from recent years, logistics prime yields widened the most of any sector by 50 bps on average in 2022, while prime yields for other sectors widened by 30-40 bps on average
- Prime shopping centre yields have widened by over 150 bps since 2018 with high street retail at over 80 bps.
- This significant past re-pricing in retail recorded over the last four years means that further widening is projected to be less at 30-40 bps over the next five years.
- For non-retail sectors, we expect prime yields to move out by a further 40 to 60 bps in the next five years to reflect the impact of higher bond yields and borrowing costs.
PROPERTY RETURNS SUFFER FROM YIELD WIDENING
- Forecasted yield widening has pushed returns across all sectors down from 4.7% p.a. in our mid-year outlook to 4.0% p.a. for the same 2023-27 period.
- Logistics markets are projected to have the highest returns at 5.4% p.a. in the next five years -- due to the solid rental growth still forecasted.
- Prime shopping centers have slipped to second place with returns of 5.1% p.a. on the back of high current yields and lower rental growth projections compared to our mid-year forecasts.
- Please note that our total return calculations are based on current prime market rents and do not consider income growth from inflation-linked or below-market leases.
- Our downside scenario produces returns at below 3% p.a. on average across sectors, mostly due to stronger yield widening.
MARKET OUTLOOK – RENTAL GROWTH TO PARTIALLY OFFSET YIELD WIDENING
HARD TO FORECAST THE PRECISE CYCLE TIMING
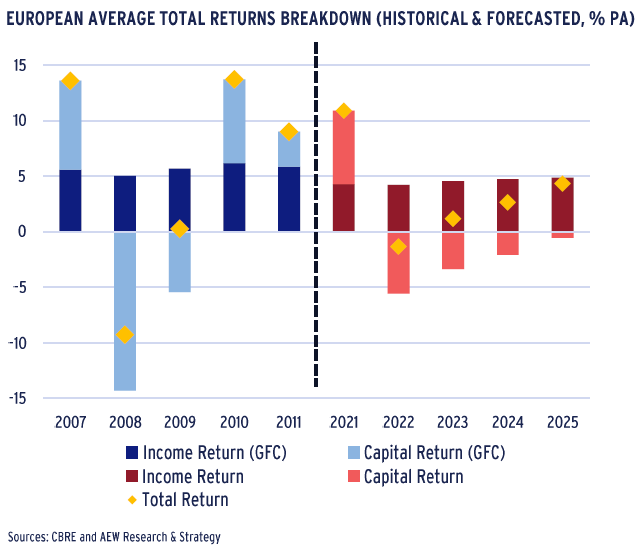
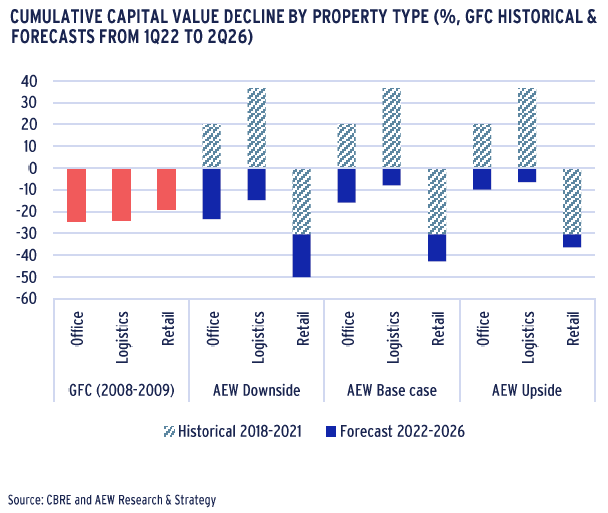
- Our cumulative capital value decline of -12% in the base case comes with negative capital returns for the next three years.
- Retrospectively, during the Global Financial Crisis (GFC) capital value declines were more dramatic when, in only two years (2008-09), there was a cumulative loss of -20%.
- However, the offsetting post-GFC rebound in capital values was very strong with +7% in 2010.
- Our quantitative forecast models do not project any significant rebounds for the 2023-25 period.
- This lack of a rebound is balanced out by our model projections showing a much slower and gradual decline in capital values than those seen in the GFC period.
- It is difficult to precisely forecast the exact timing and extent of a cyclical downturn. Despite this, we are confident that our overall projected changes are reasonable given the context.
LOGISTICS AND RESIDENTIAL VALUES RESILIENT
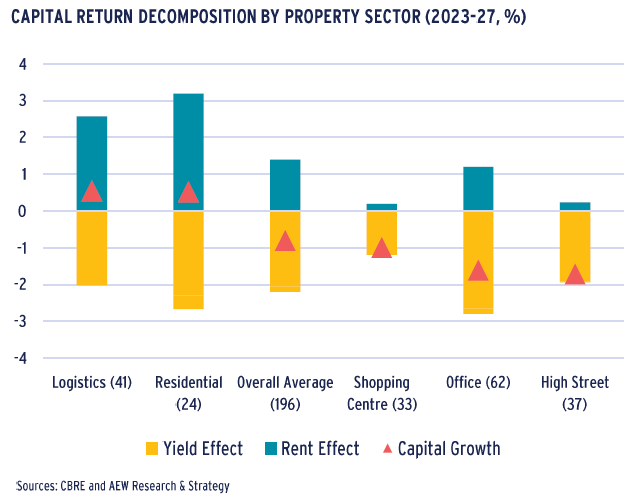
- Further analysis of our total returns forecasts shows significant differences between the components driving various sectors.
- Logistics and residential sectors stand out with their positive capital value growth in the next five years.
- However, total returns for retail and offices are negatively impacted by capital value declines, with high street retail showing the worst impact.
- These base case income return projections vary also but remain relatively stable, with shopping centres being the top income-producing sector.
- To explain what drives the capital value changes, we further decompose the capital growth into the yield and rental growth components.
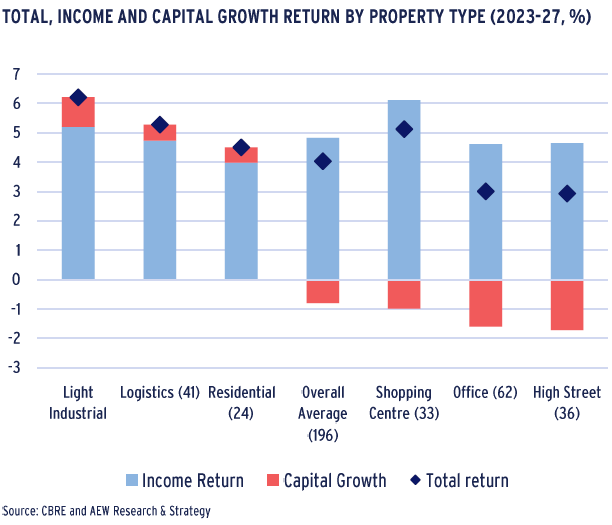
RENTAL GROWTH OFFSETS SOME YIELD WIDENING
- A breakdown of the capital return by the yield (widening) effect and rent (growth) effect allows us to identify what exactly drives the capital value changes per sector.
- As previously shown, solid rental growth in both logistics and residential offsets the yield widening to push the capital value growth into positive territory.
- By contrast, we note that offices and retail do not manage to have sufficient rental growth to offset this yield widening.
- However, here we do note the timing impact of the yield impact. As both retail sectors record less yield widening compared to offices, as they have already adjusted in the past few years.
- For offices, this means that despite having better rental growth, the lack of previous (pre-2023) yield widening means that the capital values are projected to come down more going forward.
MARKET OUTLOOK – RE-FINANCINGS TO POSE CHALLENGES
LOWER CAPITAL VALUES TRIGGER REFINANCING ISSUES
- Cumulative capital value declines can trigger problems with debt financing as loan-to-value (LTV) covenants might trigger defaults or loans might become difficult to re-finance at maturity.
- Across sectors, cumulative value declines vary per sector and across our scenarios as shown in the chart. Our downside scenario projected declines are close to those recorded post-GFC.
- Please note that for our 69 retail markets, values declined from 2018 to 2021 by -30%. Added to our base case projections there is a total cumulative –43% decline. Offices and logistics had no pre-2022 declines.
- Re-financings of loans maturing in 2023 and after will face issues from the decline in values of their underlying collateral since the loan origination.
- Capital value declines are the first factor in quantifying the refinancing problem. We look also at the vintage of the loan origination and size of annual acquisitions per sector.
- It is assumed that the average loan maturity is 5 years, loans maturing in 2023 were, therefore, originated in 2018.
LOWER RE-FINANCING LTV’S TO ADD TO PROBLEM
- Apart from a decline in collateral value, there is also the potential for lenders to not want to refinance at the original loan’s LTV level.
- In fact, the recent CREFC LTV sentiment results show that (senior) lenders can be expected to reduce their actual LTVs downwards to 45-50%. Therefore, we assume in our analysis a 50% refi LTV.
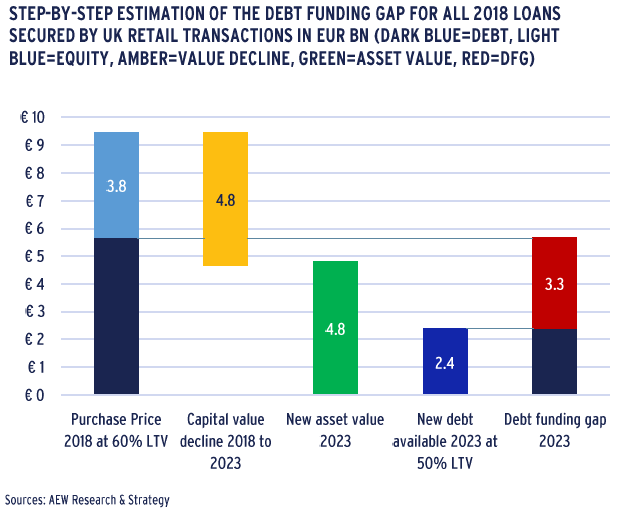
- As an example, we provide our estimate of the debt funding gap (DFG) for all 2018 originated UK loans secured by retail collateral as follows:
- Transaction volumes are adjusted for non-levered deals (17% of 2018 UK retail volume).
- Average LTV for the market in the year 2018 (60% for UK retail according to the in-house data) is assumed at purchase.
- 5 year capital value forecast for UK retail shows a -50% decline in value between 2018 and 2023.
- New debt volume is estimated at 50% LTV of new value.
- Additional equity (or junior debt) is needed to avoid loan default, we highlight this in red as the debt funding gap.
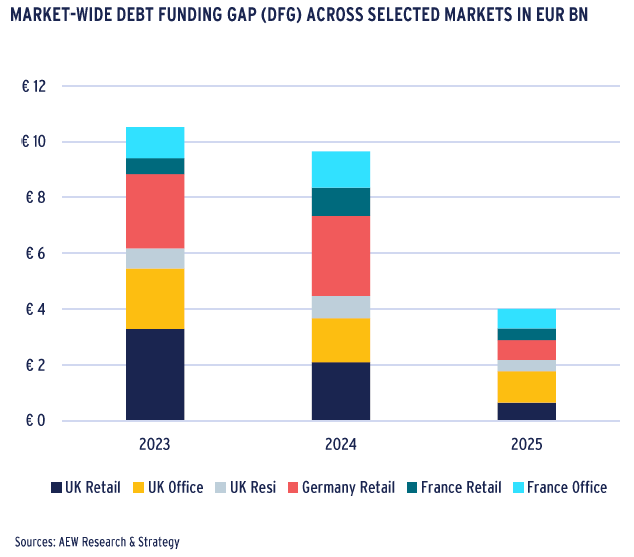
EUR 24 BN DEBT FUNDING GAP QUANTIFIED FOR 2023-25
- Based on the above five-step approach for each of the five segments impacted, we estimate a 24.2 bn EUR in DFG for the next three years.
- Over half of this funding gap is related to UK real estate debt (12.8 bn EUR), followed by Germany (6.2 bn EUR), and France (5.1 bn EUR).
- Across sectors, retail constitutes nearly 60% of the DFG (14.3 bn EUR), followed by office with 8 bn EUR, and residential with 1.9 bn EUR.
- In relative terms, the 24.2 bn EUR debt funding gap represents nearly 9% of the last three years’ historical transaction volumes in the affected market segments.
- Based on our latest estimates, the 2023-2025 UK commercial real estate DFG is around £11bn. This is significantly below our previous Sep-2020 estimate of £30bn. Again, this is much lower than the £70bn witnessed during the aftermath of the Global Financial Crisis (GFC).
- The lower DFG in 2023-2025 is mainly because of stricter post-GFC bank regulations and more conservative acquisition LTVs. In addition, projected capital value declines in our base case are below GFC levels.
- It should be noted that our market rent and yield forecasts do not explicit take these re-financing problems into account.
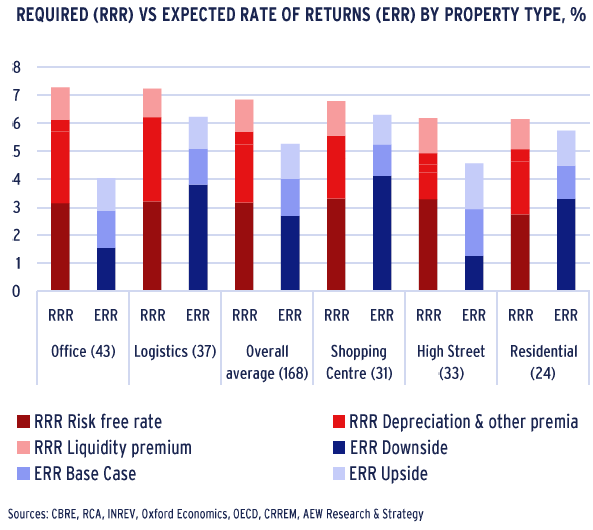
RELATIVE VALUE ANALYSIS: OVER 30% OF MARKETS STILL MEET REQUIRED RETURNS
AVERAGE EXCESS SPREAD INSUFFICIENT FOR RISKS
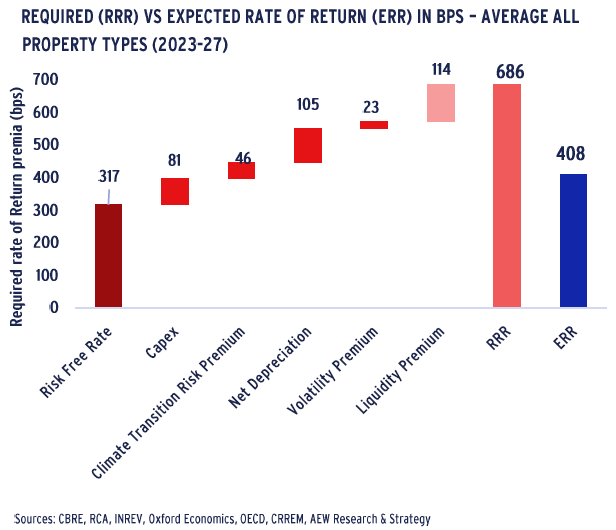
- As before, our risk-adjusted return approach is based on a comparison between the required rate of return (RRR) and the expected rate of return (ERR) over the next five years.
- Our graph shows that the RRR, based on our 168 European markets’ average stands at 686 bps (almost double last year’s level of 345 bps) while the ERR is 408 bps (down from 565 bps).
- This means that the ERR has a negative excess spread of 278 bps over the RRR. This is down from a positive excess spread of 220 bps over the RRR in our 2022 outlook.
- Due to the recent bond yield widening, the risk free rate is now the largest component of the RRR while the other risk premia remained stable.
- In short, on average investors are not getting compensated for the risks they take across European real markets.
- However, by comparing the ERR with the RRR, we can classify individual markets as attractive, neutral or less attractive.
HIGHER BOND YIELDS DRIVES DRAMATIC REVERSAL
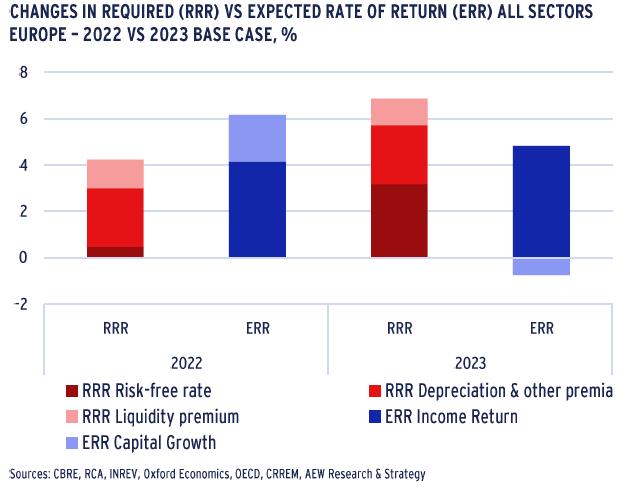
- What a difference a year makes! In our assessment of relative value for last year’s outlook, we had a favorable excess spread of over 190 bps between the ERR (6.1%) and RRR (4.2%).
- However the 270 bps increase in our 20-country average government bond yield has a double impact. It pushed our RRR up and our ERR down, through future property yield widening.
- As a result, there now is a negative excess spread of nearly 280 bps between the current ERR of 4.1% and RRR of 6.9%. This is a dramatic reversal in our assessment over the last year.
- In short, real estate investors face a more challenging market environment. This is a delayed impact from what these same investors have experienced in stock and bond markets.
- But as both government bond and property yields are projected to stabilise by year-end 2024, ERR and RRR revert to a more favorable balance from 2025 onwards.
UK IS OUR MOST ATTRACTIVE COUNTRY (AGAIN)
- Out of the 168 covered markets, 52 markets are classified as neutral (47) or attractive (5). This means investors can meet the RRR in over 30% of European markets.
- There are big differences between countries, with the UK and Benelux showing a better than average share of neutral and attractive markets. The UK was our top pick last year as well.
- This is mostly due to UK bond and property yields staying at higher levels over the last few years when compared with the Continent, due to Brexit and the BoE’s earlier rate hikes.
- CEE , France and the Nordics come out with only few neutral or attractive markets while Southern Europe and Germany are both close to the European average.
- Our scatter chart shows a more precise assessment for each city market segment, with details results available upon request.
- Despite nearly 70% of markets being classified as less attractive, it should still be possible to source and execute attractive individual deals, especially for managers with local presence.

RELATIVE VALUE ANALYSIS: LOGISTICS IS THE MOST ATTRACTIVE SECTOR
LOGISTICS BECOMES MOST ATTRACTIVE SECTOR
- Our sector-specific European base case results over time confirm the overall dramatic changes discussed above.
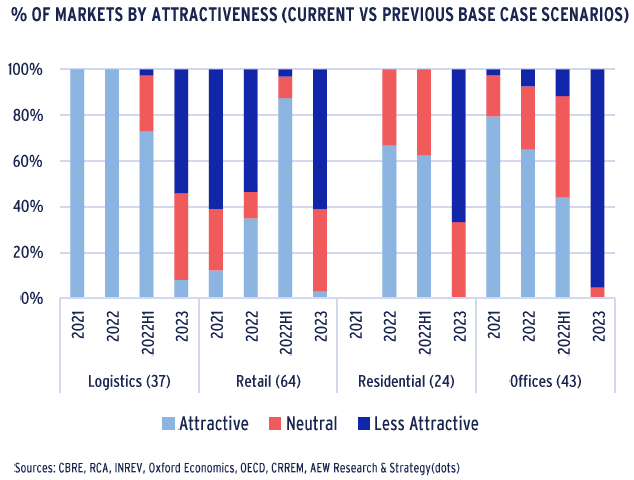
- Due to its solid projected rental growth, prime logistics is now the most attractive sector. 17 of 47 covered markets are deemed attractive or neutral based on our methodology.
- As prime retail yields already widened in the last three years, 24 of 63 retail markets covered are classified as attractive, so there is still plenty to choose from.
- Offices are impacted most of any sector as all except two of 43 covered markets are classified as less attractive. This is due to the lower rental growth projections and yield widening.
- Apart from offices, the change from last year’s residential market classification again confirms the dramatic reversal. In this case, we still have 8 neutral residential markets.
OFFICES HURT MOST IN BASE CASE SCENARIO
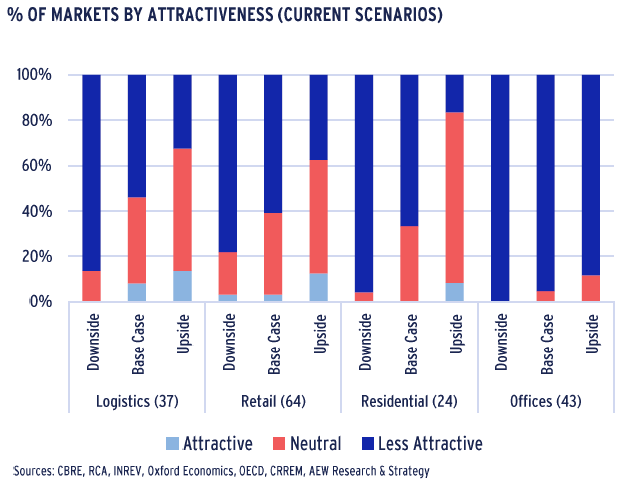
- If we then consider the differences between our base case, upside and downside scenarios, it can be confirmed that the impacts are logically distributed across the sectors.
- Overall, our downside scenario assumes higher bond and property yields which are further impacted by a longer economic recession and slower rental growth.
- The reverse is true for the upside scenario.
- Yield movements, especially in the current increasing interest rate environment, have more substantial impacts on capital values and total returns than changes in GDP and rental growth.
- With the lowest yields of any sector, to begin with, it seems unsurprising that residential is impacted most by both the upside and downside scenarios’ yield widening differentials.
- Why do offices on the other hand show the least impact of the various scenarios on their attractiveness?
OFFICES HAVE BIGGEST GAP TO BRIDGE
- The office sector is least responsive to changes in the macro economic scenarios, as the difference (or gap) between its ERR and RRR is the largest of any sector in our coverage.
- As discussed before, this is driven by a combination of modest rental growth and significant projected yield widening where other sectors have better rental growth or less yield movement.
- Separately, offices also have a higher depreciation risk premium as adjustments to meet energy efficiency and new flexible working practices requires more significant investment.
- This is particularly clear when we compare the ERR under the various scenarios with the RRR for residential and shopping centers and to a lesser extent logistics.
- Please note that our logistics coverage includes a higher number of CEE and Southern European markets, which bring the sector average ERR down and pushes the RRR up.
- It should be noted that our sector averages are not capital weighted but rather just unweighted averages.
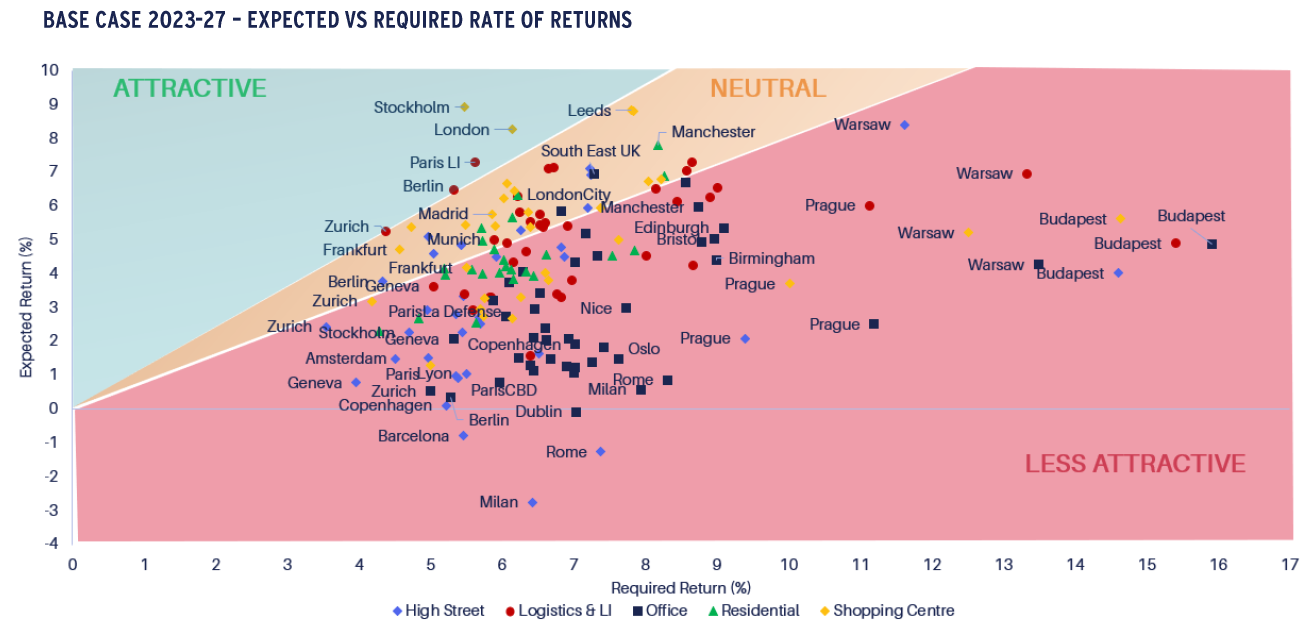
RELATIVE VALUE ANALYSIS (BASE CASE) – RESULTS FOR 168 MARKETS
- Our below scatter graph can be interpreted as follows: the required rate of return (RRR) is represented on the horizontal axis and the expected rate of return (ERR) for the next five years is represented on the vertical axis.
- Markets in the green area show ERR sufficiently in excess of the RRR as attractive. The red zone markets are classified as less attractive, given their ERR does not meet the RRR.
- The yellow background indicates a range of 20% of the difference between the two, which is deemed an appropriate range where markets are not clearly over- or underpriced. As a result, markets within this middle yellow range are labelled as neutral.
- Similar to last year our universe comprises of 168 markets across five different property sectors. As highlighted above, the scatter chart confirms the weakness across most segments with most markets in the less attractive zone.
- There are five segments remaining in the attractive category, logistics and shopping centers: Stockholm and London shopping centres. The three other attractive markets are all in the logistics and light industrial sector, namely, Paris light industrial and Berlin and Copenhagen logistics.
- Many more logistics and shopping centers markets are in the neutral zone with some residential and high street markets. In the neutral area of the chart, some segments are very close to the attractive area such as Leeds shopping centres or logistics in Brussels and Zurich.
- Only two UK office markets are in the neutral category, the South East markets and the London City market.
- Other markets from the residential and high street sector also appear in the neutral zone with predominantly segments from the UK and Germany such as Manchester residential, Munich shopping centres and Dusseldorf logistics.
- Office and high street markets are predominantly present in the less attractive zone whereas the residential and shopping centres segments are closer to the neutral area of the chart, with a large majority of markets still showing positive expected returns.
- Similar to last year’s results, we note that both CEE and Italian markets seem to be less resilient than other markets. This mostly due to the much higher government bond yields, which push up the required rate of return.
This material is intended for information purposes only and does not constitute investment advice or a recommendation. The information and opinions contained in the material have been compiled or arrived at based upon information obtained from sources believed to be reliable, but we do not guarantee its accuracy, completeness or fairness. Opinions expressed reflect prevailing market conditions and are subject to change. Neither this material, nor any of its contents, may be used for any purpose without the consent and knowledge of AEW.