HOW SHOULD CROSS-ASSET INVESTORS EVALUATE REAL ESTATE?
Most cross-asset institutional investors are organised across three main departments: fixed income (or credit), equities and alternatives. Commercial real estate is typically represented in all three departments. Despite having different terminology and perspectives, investors increasingly look across departments to benefit from each other’s views on fundamental trends in the underlying credit, equity, collateral and property markets. In this report we create an analytical framework to start such a comparison in a step-by-step approach. To do this, we introduce AEW’s peripheral property perspective. It allows us to map the full investment universe from listed corporate bonds and equities, listed real estate bonds and equities as well as to private real estate equity and private real estate debt.
AEW'S PERIPHERAL PROPERTY PERSPECTIVE
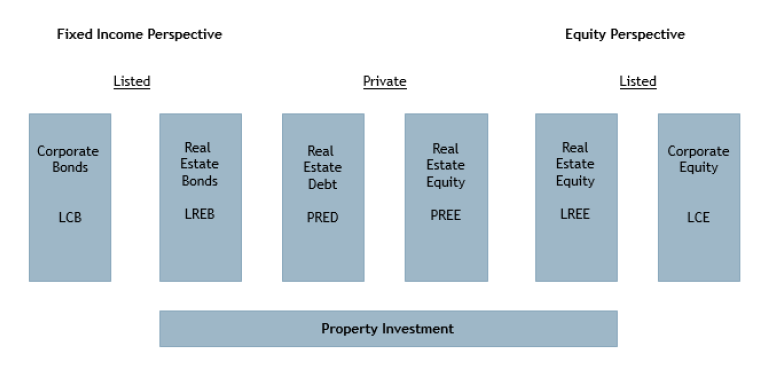
Source: AEW
EXECUTIVE SUMMARY
- Our peripheral property perspective compares returns, volatility and correlations for private real estate investments with other fixed income and equity segments in a European context, to facilitate strategic allocation decisions for cross asset investors.
- In our fixed income comparison, we introduce a new private real estate debt (PRED) index based on pricing of over 2,300 commercial real estate loans. This PRED index shows a very similar performance as the listed real estate bond (LREB) index over the last 10 years. Both outperformed listed corporate bonds (LCB). But, PRED performance stands out as significantly more volatile than LREB (and LCB) over the period. In regards to correlations, we note that LREB and LCB returns show a strong positive correlation while PRED and LREB show virtually no correlation over our 40 quarter time series.
- From the equity perspective, the listed real estate equity (LREE) index outperformed both listed corporate equity (LCE) and private real estate equity (PREE) over the last 10 years. But, the valuation-based PREE performance stands out as significantly less volatile than LREE and LCE over the period. In regards to correlations, we note that LREE and LCE returns show a positive correlation while PREE and LREE show a negative correlation over the same period.
- In short, PREE and to a lesser extent PRED offer cross-asset investors potential diversification benefits due to their negative correlations with the other asset types, as illustrated below. Despite moderate absolute returns, PREE has in fact the highest risk-adjusted return across our asset types.
READ THE FULL REPORT
The information and opinions presented in this research piece have been prepared internally and/or obtained from sources which AEW believes to be reliable; however, AEW does not guarantee the accuracy, adequacy, or completeness of such information.
