JUNE 2020
To learn more about the impact of the COVID-19 crisis on the Asia Pacific real estate property markets, and hear our insights on post-COVID developments, we invite you to read a brief update by Asia Pacific’s Director of Research, Glyn Nelson.
Pricing of office markets in Asia pacific
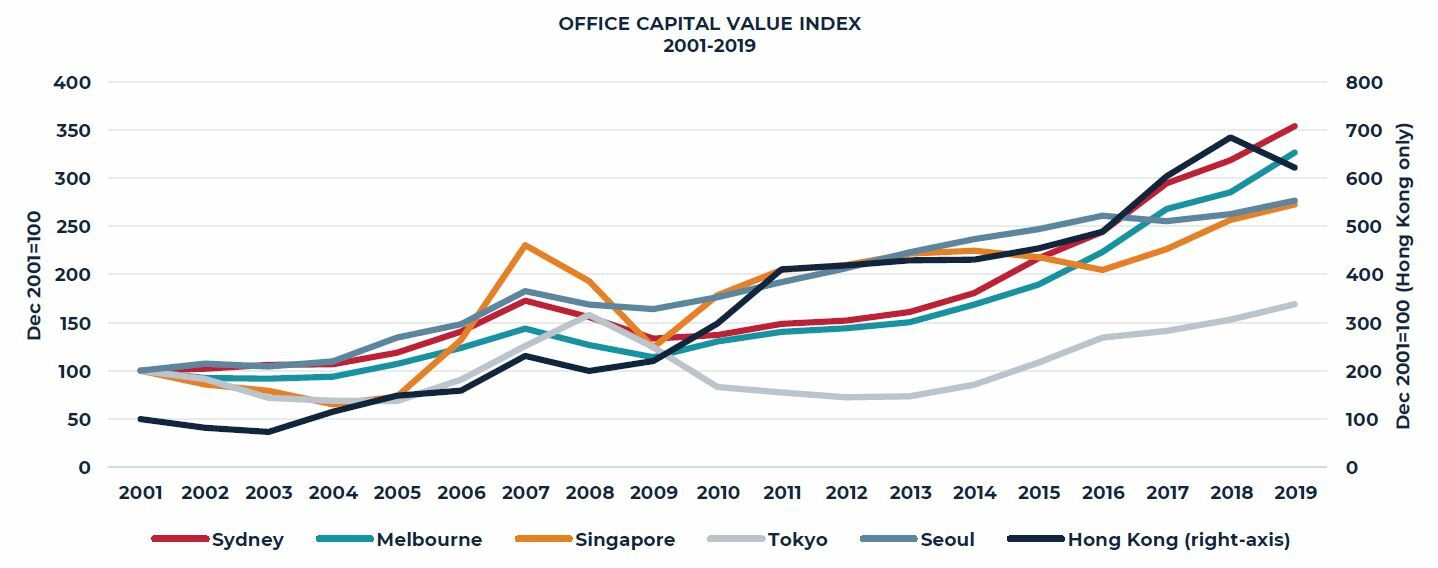
The office sector is the largest, most liquid, and most institutionally-held and traded real estate sector in the Asia Pacific region. Through cycles, and over time, the sector has generated positive returns for investors. As the recovery in the Asia Pacific region progresses, there will be an increased focus on the pricing of real estate, especially office assets.
AEW Research has been monitoring how office pricing has reacted to the unusual conditions H1 2020 presented; while it is still early, whether an asset will be repriced may end up being due to location, if it is of institutional quality and ESG/Wellness attributes. To better understand current pricing, AEW Research looked at office capital value trends using three different approaches: prior peak, economic growth and yield spread.
What the analysis tells us about pricing levels today:
- While all markets are above their previous peak, the magnitude varies widely across the markets, highlighting pricing attractiveness of some
- In some markets, it was only in recent years office pricing increased faster than local economic growth
- Some markets have a yield spread above the long-term average, making them more attractive
Source: JLL, PMA, AEW Research
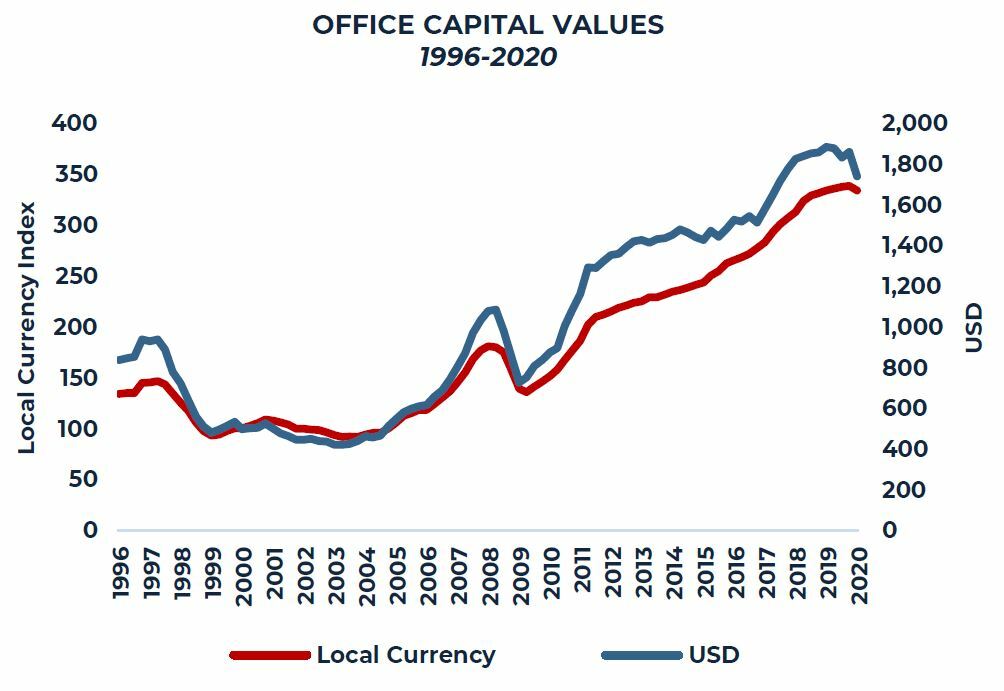
Approach 1. Pricing today versus GFC peak
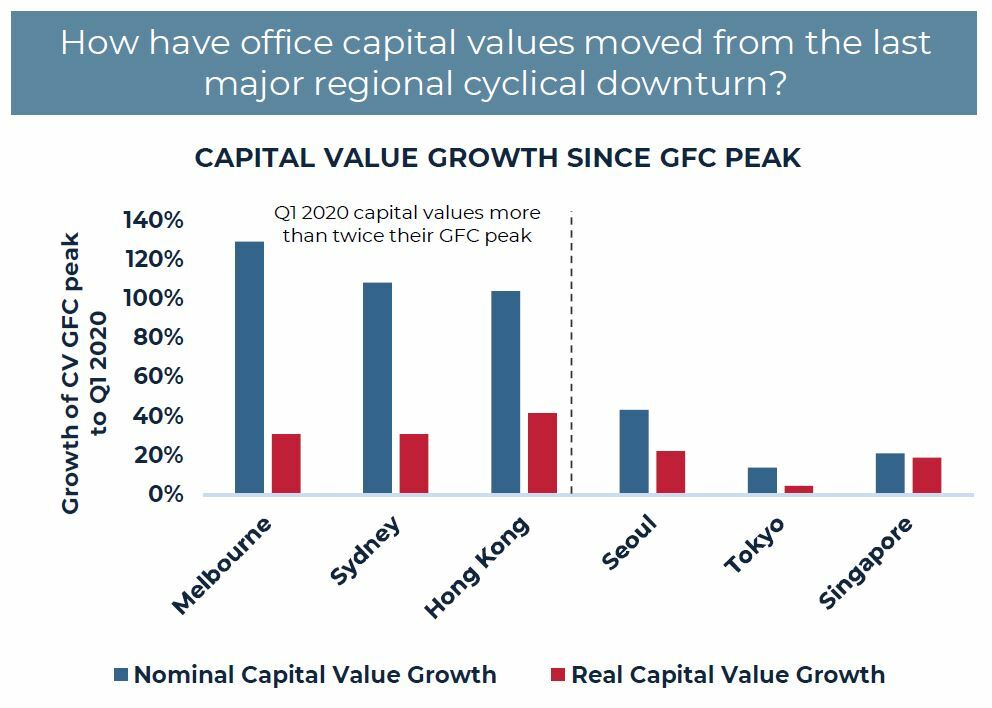
Noting that most markets are at their cyclical pricing peaks, we assessed the current capital values versus peak pricing in the Global Financial Crisis (GFC, 2008/9):
- All markets have surpassed their GFC peak; some much more than others
- Inflation helps to explain only a part of the escalation of capital values and the level of pricing today compared with a prior peak
- Tokyo, Singapore and Seoul have current capital values only slightly above previous GFC peaks – these markets look attractive relative to historical pricing
- Melbourne, Sydney and Hong Kong have current capital values at more than double GFC peak pricing – these markets can be considered less attractive relative to historic pricing and would rank lower on the attractiveness scale
Source: JLL, PMA, AEW Research
Approach 2. real estate as a factor of production in the economy
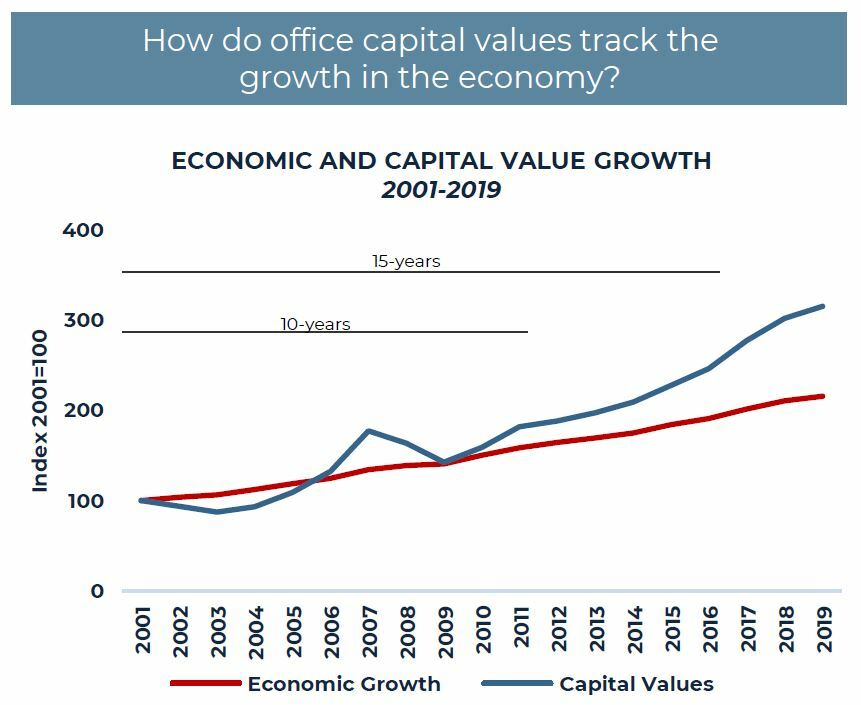
Over time, AEW believes that the value of office properties should track the growth of the underlying local economy
- In the ten-years to 2011, capital values had on average grown only 15% faster than local GDP; by 2016 this had increased to almost 30%
- By the end of 2019, office capital values in all markets had grown more strongly than their underlying economies, but there is a wide variation
- Markets like Singapore and Seoul have seen their capital value growth track more inline with local economic growth – indicating a fairly priced market
- In markets like Hong Kong and Tokyo capital values have consistently grown more strongly than their economy – reflecting their position as key financial centers and their transaction liquidity
- In the past, capital values in Sydney and Melbourne grew along with their economy, but since 2015 the pace of growth has been higher as focus on new transport infrastructure has driven investment competition
Source: JLL, PMA, AEW Research
Approach 3. Income return
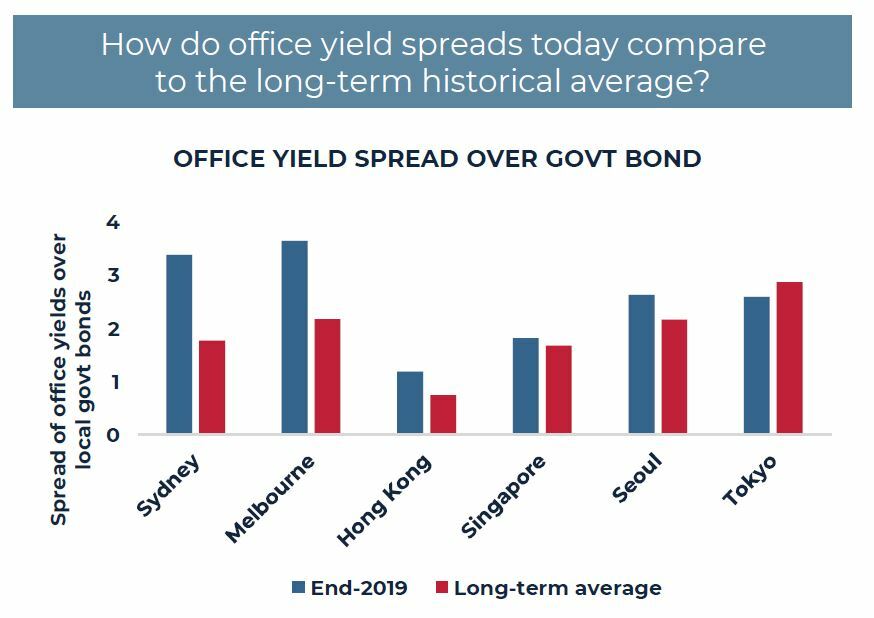
The spread between real estate yields and long-term government bonds is typically an indicator of the attractiveness of the market
- At the end of 2019, the office yield spread was widest in the Australian markets and substantially higher than the long-term historical average – for income focused investors Sydney and Melbourne are attractive and cross-border purchasing activity has been high
- In Seoul and Tokyo, yield spreads are high (260 bps), but are similar to the historical average and not as attractive
- Singapore stands out as having an end 2019 spread very similar to the long-term average
- In Hong Kong yield spreads are the lowest; and would be least attractive from an income return perspective
Source: JLL, PMA, Oxford Economics, AEW Research
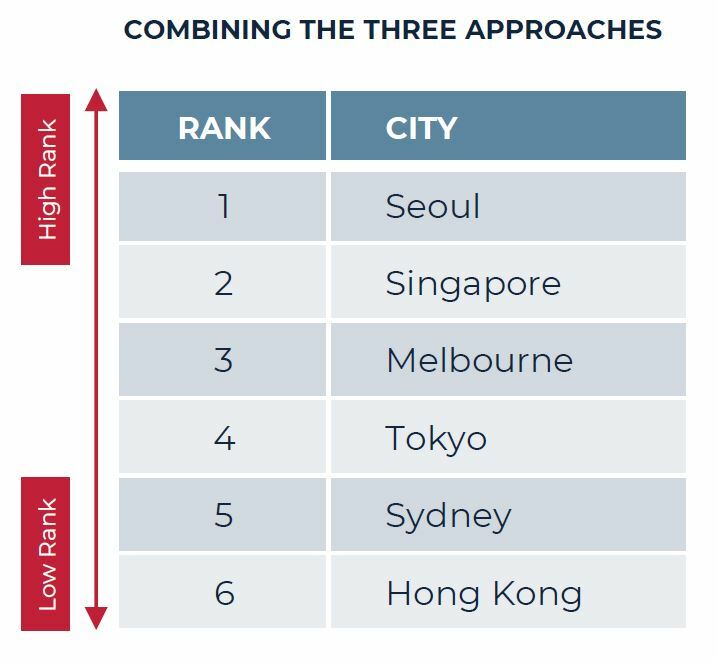
Conclusion
- To summarize we ranked each city by their attractiveness, per approach, to give a score. A low score indicates a favorable comparative position for that approach, while a high score indicates relative unattractiveness. These results are then summed to provide an overall score
- The results provide us with a relative rank of pricing attractiveness across six gateway cities in Asia Pacific today
- The results confirm the AEW Research anecdotal view of the markets. For example, Seoul and Singapore have not had the same increase in pricing that has occurred in other markets and are ranked more favorably. Hong Kong is one market where pricing has grown substantially over many years and despite recent declines, it is still double the GFC peak with a very low spread over government bonds
Implications for investment strategy
- These approaches help to give context to current pricing and assist in understanding where these markets are placed against each other
- This is useful in the current environment where uncertainty has increased and lower transaction volumes has slowed the price discovery process
- The results of these approaches are most useful for investment strategies that have a long-term horizon, but less so for those that benefit from market dislocations and timing market cycle
- Higher-ranked cities may have office prices that represent better value compared to their lower ranking counterparts
- In order to retain a defensive position in lower ranked markets it is more important to enter at a discount to market today
Notes:
AEW Research looked at transaction prices and capital values on a per unit basis and found capital values (as reported by industry leading consultants, typically valuation driven) tend to follow the trend set by the more volatile transaction prices. This gave us confidence to use capital values as a proxy for transaction pricing
Six major office markets were chosen. They represent about 70% of all office transactions in the region, more than half of the regions institutional office stock and are known to have high quality real estate data over a long time period, two qualities needed for this analysis
This material is intended for information purposes only and does not constitute investment advice or a recommendation. The information and opinions contained in the material have been compiled or arrived at based upon information obtained from sources believed to be reliable, but we do not guarantee its accuracy, completeness or fairness. Opinions expressed reflect prevailing market conditions and are subject to change. Neither this material, nor any of its contents, may be used for any purpose without the consent and knowledge of AEW.