Investment Strategy
There were several encouraging trends during the third quarter of 2020 that point towards a recovery being underway in several of Asia Pacific’s gateway economies. As of October 2020, the new COVID case load in Asia Pacific was relatively low and the swift government action to contain local flare ups has been reassuring. Through this, financial markets have held up well, with stock markets and the banking system remaining fairly stable for past months. This has created a more positive environment which had led to an increase in investor confidence in the region again.
Central banks have committed to keeping rates low for the near-term and real yields are at their lowest level in decades. This has resulted in money moving across the risk spectrum in search of higher returns. Investors remain keen to grow their property investments to compensate for the negligible fixed income returns and to benefit from the capital appreciation potential as the market recovers. In Asia Pacific, the weight of capital in the region is strong, with an estimated $84 billion in dry powder to deploy (as measured at the start of 2020). Fundraising reports have also indicated another $11.9 billion raised for private real estate strategies year-to-date.
Despite continued interest in real estate as an investment class, transaction volumes this year are muted with the majority of investors citing underwriting uncertainty as the biggest challenge. Year-to-date income-producing transaction volumes in the Asia Pacific gateway markets remain about 40% below 2019 levels. While investment activity has been impeded by the large bid-ask spreads, this gap has started to reduce in Q3. Few vendors were in a position where they needed to sell below asking price or valuation, and as a result, buyers that were looking for discounts have started to adjust their expectations. Buyers/investors remain focused on income streams can be underwritten easily and as a result, prime assets in core locations with long weighted average lease expiries (WALEs) are being rewarded with strong bidding. There have also been several corporate sales, often with a lease-back commitment.
In terms of investment themes, structural macro trends in the region such as e-commerce and digitization have been accelerated, attracting more capital to invest into logistics and alternative sectors like cold storage and data centers. Meanwhile, the defensive quality of asset classes like the multifamily sector has been highlighted, with a majority of residential J-REIT managers, for example, reporting 100% cash-collection for this period. For offices, while uncertainty still exists, a steady return to normal working continues in the region. Average physical occupancy levels stand at around 50% overall but are closer to 100% in certain markets. While there are some concerns that work from home trends could meaningfully impact the demand for office space going forward, we are unlikely to see these trends prevail in the region due to a mix of cultural factors and space constraints in urban homes.
Regarding prospective investments, for the office sector, location, building quality and underlying tenant demand will be key value drivers for buyers. Business parks that house growing industries such as technology, research & development, and media & communications are anticipated to benefit. In logistics, modern assets with the optionality to partially convert dry space to cold-storage use would translate to a strong uplift in value. Meanwhile for retail, while the outlook remains weak, there could be some repricing opportunities in coming months which could be of interest from a repositioning or conversion perspective.
Economy
The world economy is in recession, 11 years since its last contraction in 2009. Forecasts indicate that the worst is over as of H1 2020, but the unpredictability of the virus spread is clouding the recovery path. As of October, the International Monetary Fund (IMF) have issued a mild upgrade in global growth for 2020, now expected to contract by 4.4% (versus -4.9% in the June outlook), followed by a rebound of 5.2% in 2021.
In terms of management of the health crisis, Asia Pacific’s success is in contrast with the West, where in Q3 most developed Asia Pacific economies had better control of their case load and successfully stepped out of lockdown. On the other hand, in the U.S. the continued COVID-19 infection spread and the resurgence in Europe in September/October has forced some authorities to reimplement lockdowns or clamp down on social activities again. For developed markets in Asia Pacific, growth is expected to average -3.7% in 2020, followed by a recovery of 4.3% in 2021. China is leading the recovery, with expected growth of 2.3% in 2020, followed by a 7.6% rebound in 2021. Besides the virus path, risks to the current outlook include the upcoming U.S. elections and geopolitical tensions between China and various Asian and Western counterparts.
In line with the containment of the virus and a reopening of economies, Australia, China, Japan, South Korea and Singapore collectively saw a quarter-on-quarter positive growth in Q3 (Hong Kong was an exception to this). Manufacturing and export activity continued to recover slowly, and even badly affected segments of the economy such as private consumption and retail sales have shown quarter-on-quarter improvement. At the same time, employment conditions have been partially upgraded with the help of highly supportive government packages. The magnitude of the recovery to-date in some markets have been impacted by localized COVID-case flare ups, but these have been relatively well handled and are largely under control at the time of writing this report.
Because China’s economy has been open since Q2, it has benefited from supply chain disruption elsewhere. Latest data on China indicate industrial value-add and goods exports are up 5.0% and 6.0% year-on-year respectively in Q3. However, a slowdown in infrastructure investment and lingering weakness in consumption were a drag on Q3 growth figures. The Chinese government has stepped up efforts to stimulate local spending by launching a month-long consumption campaign through to October, with 100,000 companies across the 179 cities participating in the event. Similar efforts are being carried out in other Asian economies (i.e. in Singapore, SGD100 vouchers were issued to the public to support local tourism).
Since the last edition of this report, governments in the Asia Pacific region have increased their level of fiscal support while central banks have committed to keeping rates low for the next couple of years. South Korea, Singapore and Australia, for example, have rolled out additional wage and employment support measures since August while in Japan, the government has hinted at the possibility of further stimulus by year-end if risks to the labor market persists. While this will help offset some unemployment concerns, job losses, particularly in the low-end service segment, are expected to peak in Q4 or early next year as government support packages wind down.
Asia Pacific currencies continued to appreciate against the USD in Q3. The CNY(+3.9%) and AUD(+3.8%) were up the most, followed by KRW(+2.7%), JPY(+2.3%) and SGD(+2.0%).With a comparatively better recovery trajectory for the region and barring any major changes, we expect the Asia Pacific currencies to continue to appreciate relative to the USD for the remainder of the year.
MACROECONOMIC INDICATORS
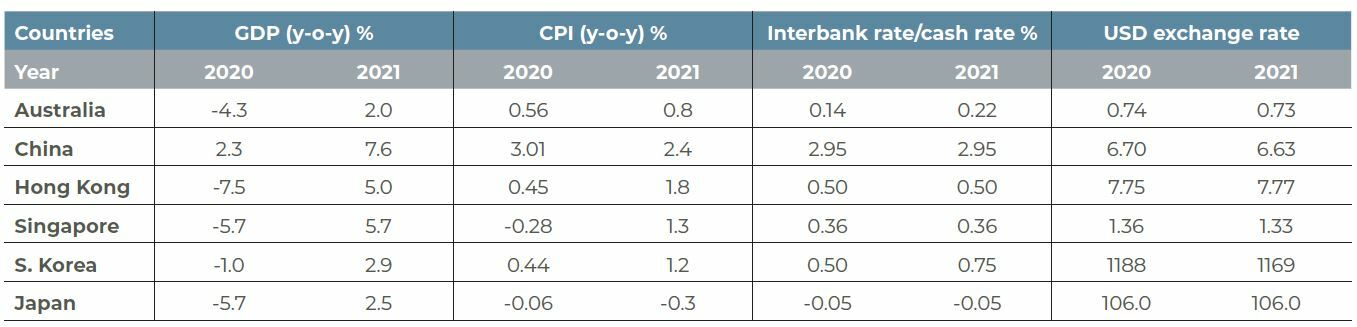
Source: Oxford Economics, 1 October 2020
Japan
Multifamily remains defensive, office fundamentals supportive for a quick stabilization
MULTIFAMILY: OCCUPANCY REMAINS HIGH, RENT GROWTH STALLS
As a necessity asset class, multifamily in Japan has been relatively stable through this period. Reports by the major J-REITs have indicated a slight decrease in occupancy in Q3 (by around 1.0 percentage-point), but rents are generally holding stable and cash collections are close to 100%.
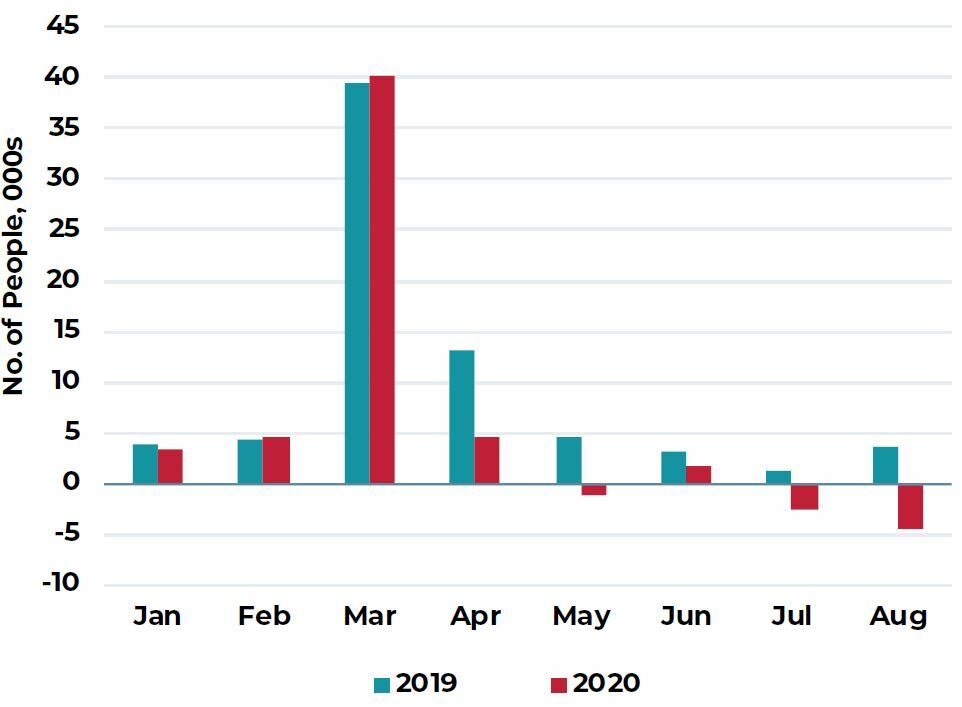
New housing demand for multifamily stems from young migrants who move to the larger cities like Tokyo and Osaka either for school or better employment opportunities. Migration patterns were affected by COVID-19 movement restrictions in 2020 (with volumes up to August about 36% lower than last years in Tokyo). However, we do expect movement to resume as restrictions are eased. Younger home seekers typically prefer smaller-sized units in the core city locations, but going forward, the adoption of working from home practices could have some impact on living space preferences, either in terms of location or apartment size.
TOKYO OFFICE: LIMITED SUPPLY IN 2021 TO PROVIDE SUPPORT
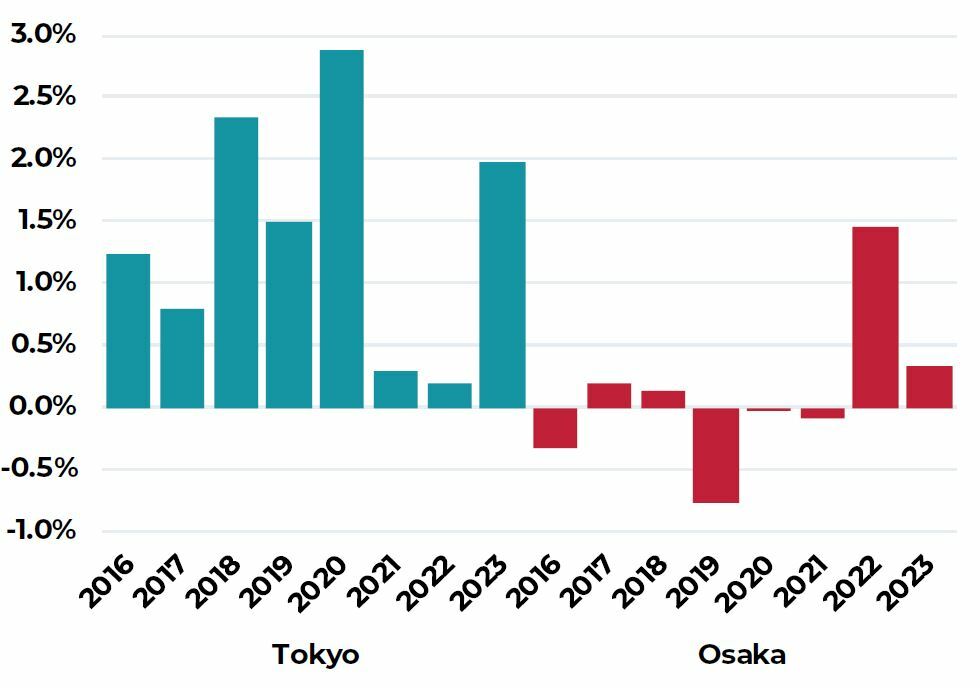
After several years of healthy rental growth, office rents in Tokyo have largely stalled. Soft leasing demand due to the impact of COVID-19 have coincided with the city’s supply peak, where 10.3 million square feet will complete this year. While new space has been well-committed prior, there have been some partial cancellations, and vacancy in the backfill space, (mostly Grade A-minus) has increased to 4.9% as of Q3 2020, a six-year high. Going forward, demand levels are expected to be reduced as some firms make adjustments to their future space requirements. A much lower supply level in 2021 to 2022 however, is expected to provide support and turn markets in favor of landlords. Current forecasts anticipate a 1% to 2% rental decline in 2020 before picking up to an average of 2.2% p.a. in 2021 and 2022.
OSAKA OFFICE: RATE OF INCREASE TO SLOW
Osaka is a largely domestic economy with the bulk of office occupier demand linked to manufacturing, wholesale retail and business services. Demand supply balance is tight, and unlike Tokyo, new supply has been extremely limited in the last five years with an estimated stock growth of only 1% between 2015 and 2019. In 2020, some weakening of tenant sentiment has resulted in a slight increase in vacancy to 3.4% and some resistance to rental increases, however we expect this to be temporary. Osaka’s office market is expected to return to growth once the economy starts to recover in 2021 due to the supply shortage in the market. Rents are expected to average 1.5 to 2.5% growth p.a. from 2021 to 2022.
TOKYO NET MIGRATION PATTERNS
JAN 2019 to AUG 2020
OFFICE STOCK GROWTH PER ANNUM
2016 TO 2023F
OFFICE RENTAL OUTLOOK
Q4 2019 = 100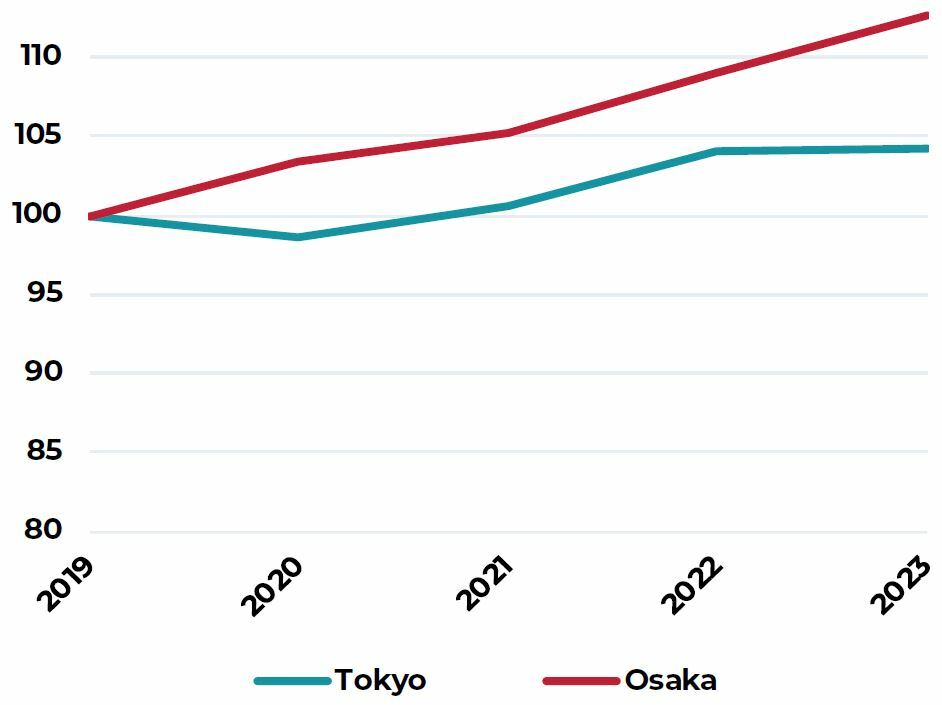
Sources: e-stat Japan, PMA, as of September 2020
Seoul
Office market sees limited impact due to COVID-19, investment volumes remain strong
LIMITED IMPACT TO-DATE FOR SEOUL OFFICE MARKETS
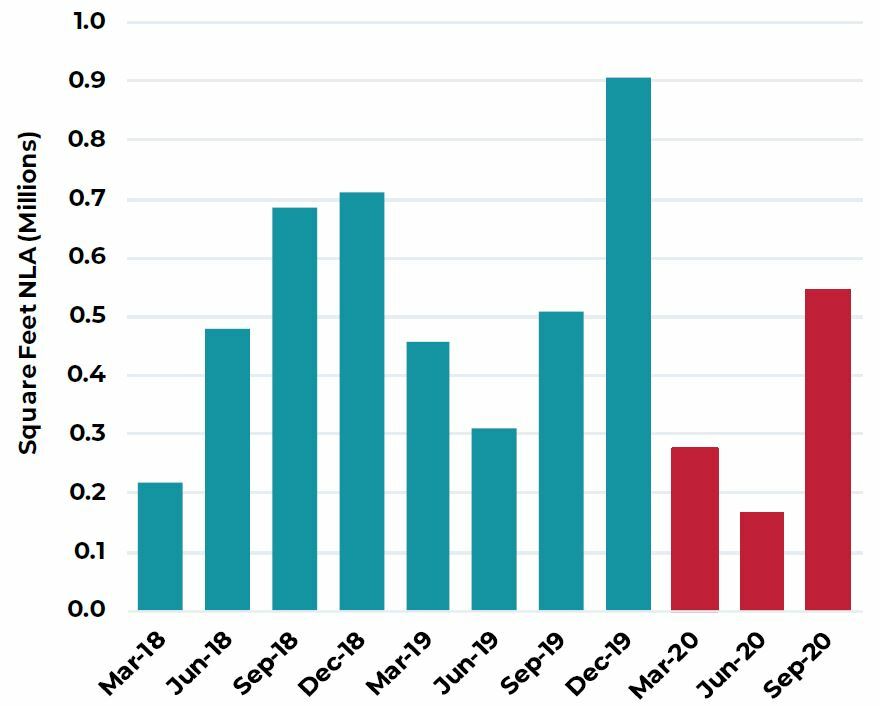
South Korea managed to contain the spread of the virus without a hard lockdown and as a result, telecommuting for businesses was not enforced at a national level. Leasing activity has continued into Q3; however, with the global economy marred in recession, cautionary sentiment remains high. Leasing volumes to-date are down 23% compared to the same period last year. To-date, while there has been no widespread offerings of rebates or increased incentives by office landlords, landlords of buildings with higher vacancies remain flexible on rents.
DEMAND HOLDS IN THREE CORE DISTRICTS
Net absorption for all three submarkets were positive in Q3, bringing take-up to 76,000 square feet in the quarter. Market sentiment generally remained upbeat and new demand included a mix of relocation and expansionary leases. There were also several cases of headquarter relocations within the three core districts.
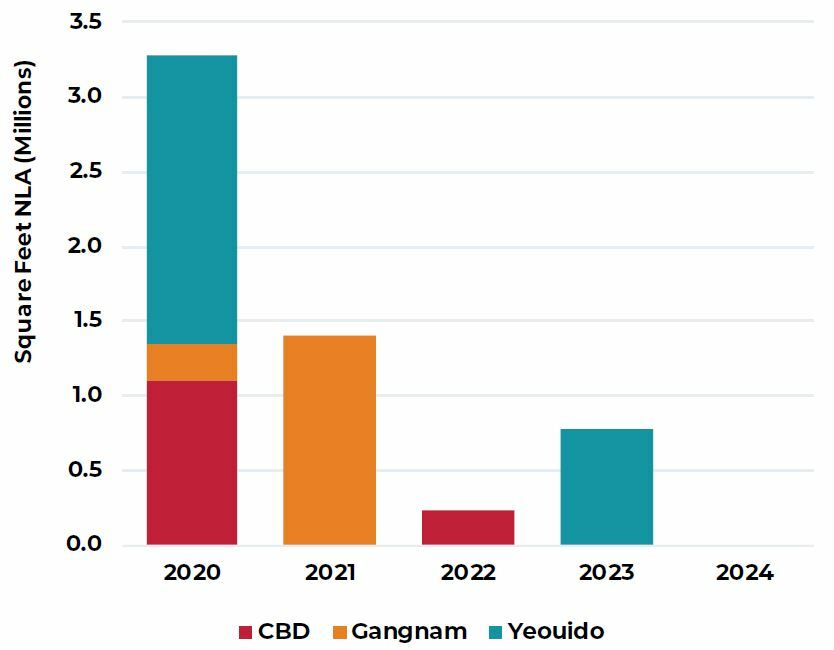
Despite the positive demand, vacancy continued to increase in Q3, with much of this linked to the new supply. In Q3, Parc One (located in Yeouido Business District) was completed, adding close to 2.0 million square feet to the market. It is currently 100% vacant, but an estimated 35% has been pre-committed by NH Securities.
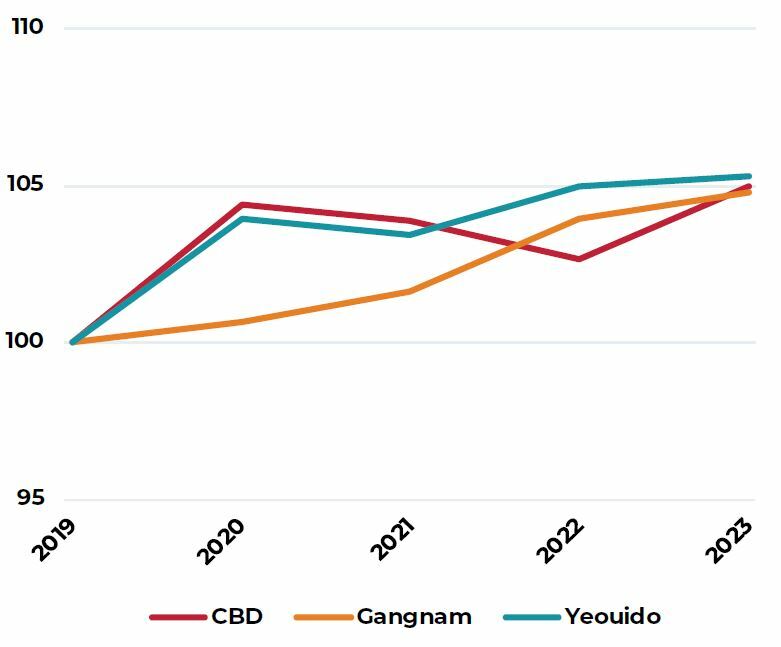
The rental outlook in Seoul is divergent by market, much dependent on the demand momentum and scale of new supply in the near-term. Currently, fundamentals are most favorable in the Gangnam Business District, where vacancy rates are low and pent-up demand exists. In the CBD, leasing competition is still high with vacancy rates elevated, but a tapering of new construction could help the market stabilize by early 2021.
STRONG INVESTMENT INTEREST CONTINUES
Seoul is the only office market within Asia Pac where investment volumes in 2020 have exceeded levels from last year. Based on deals closed and pending, investment into the Seoul office sector was up 20.5% year-to-date in September. Seoul has a strong domestic market which has been a major factor in keeping its volume up this year, especially with travel restrictions and challenges in due diligence for overseas investors without teams on the ground. Moreover, yields in the market are still attractive, which continues to draw capital. Pricing has remained competitive and cap rates have compressed by 10 to 20 bps this year.
SEOUL OFFICE GROSS LEASING VOLUME
Q1 2018 TO Q3 2020
SUPPLY OUTLOOK BY SUBMARKET
2020 TO 2024F
OFFICE RENTAL OUTLOOK
Q4 2019 = 100
Sources: JLL, as of September 2020
China
Office demand improves, but large supply is an obstacle to rental recovery
CLOSE TO NORMAL CONDITIONS, LEASING ACTIVITY IMPROVES
Leasing activity continues to recover and, in fact is almost on par with volumes recorded last year. Work-from-home trends were largely bypassed in China and as a result, occupiers continue to expand, and offices remain well-utilized. While demand levels have improved, cost remains a major factor in decision-making. In addition, large incoming supply levels, especially in decentralized locations where rents are 40% to 50% cheaper serve as obstacles to a quick recovery. While there are opportunities across select submarkets, we expect the general leasing environment to be incentive-driven for the remainder of the year, especially as new supply increases the competition between landlords.
SHANGHAI
LEASING RECOVERS, COST SAVING IS MAIN DEMAND DRIVER
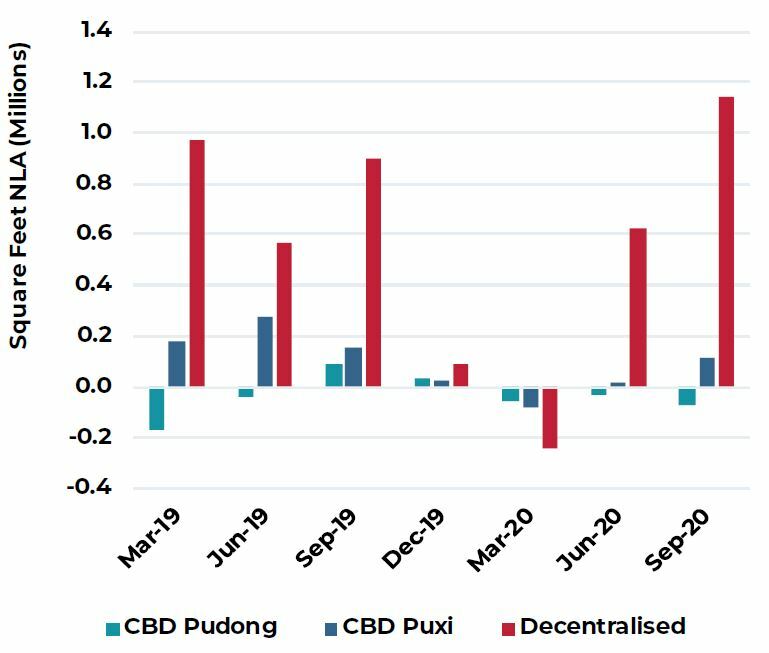
Brokers on the ground are reporting a recognizable increase in corporate confidence, with quarterly net absorption up to 1.2 million square feet. The trend of decentralization continues with several firms moving to high quality projects in markets like Qiantan and North Bund. AEW also understands that it is getting easier to move across districts, which was previously challenging due to local government tax-related policy and incentives.
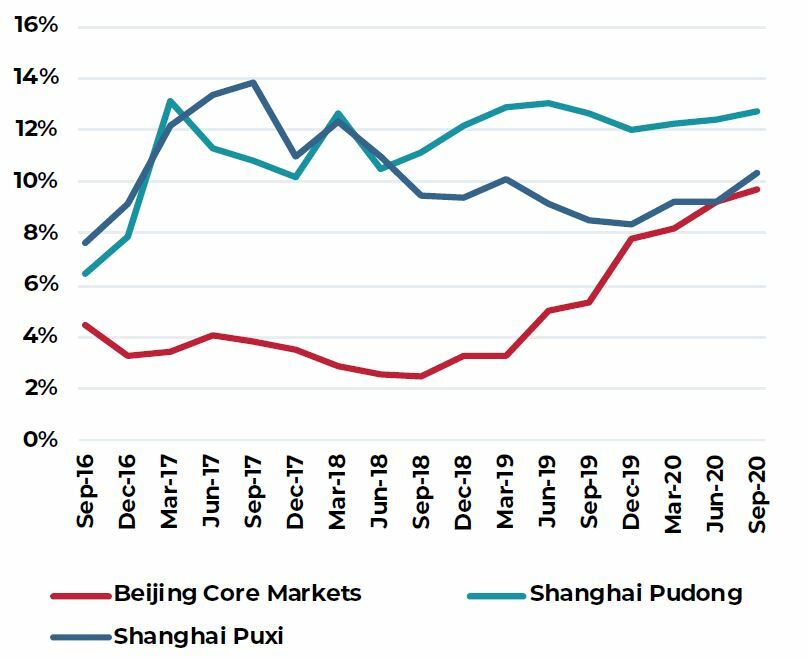
As vacancies continue to rise in the CBD, landlords are more willing to negotiate on renewals in order to retain occupancy. Rents are expected to remain weak for the year, but policy-driven initiatives such as China’s financial reform could stimulate new leasing demand by mid-2021. We expect this to be the case in Pudong CBD, where the bulk of new financial licenses to foreign firms are being granted for that district. Meanwhile in Puxi CBD, a diverse occupier base should help limit rental weakness in 2020.
BEIJING
MARKET COULD RECOVER BY EARLY 2021
In Beijing, policy-protected submarkets like Finance Street are holding strong with minimal rent correction, however rental weakness has been evident in others like Third Embassy and East Chang An. The latter markets are also more vulnerable due to the large volume of new supply completing in the neighboring new submarket called Guomao. In the short-term however, supply concerns have reduced slightly as about 30% of the projects in the pipeline will be postponed. This will result in a more even spread of supply over the next three years ending 2022. Office rents in Beijing could recover as early as H1 2021, especially in lower vacancy submarkets like Finance Street and East 2nd Ring Road.
DEMAND, SHANGHAI CBD & DECENTRALIZED
Q1 2019 TO Q3 2020
VACANCY RATES, SHANGHAI & BEIJING
Q3 2016 TO Q3 2020
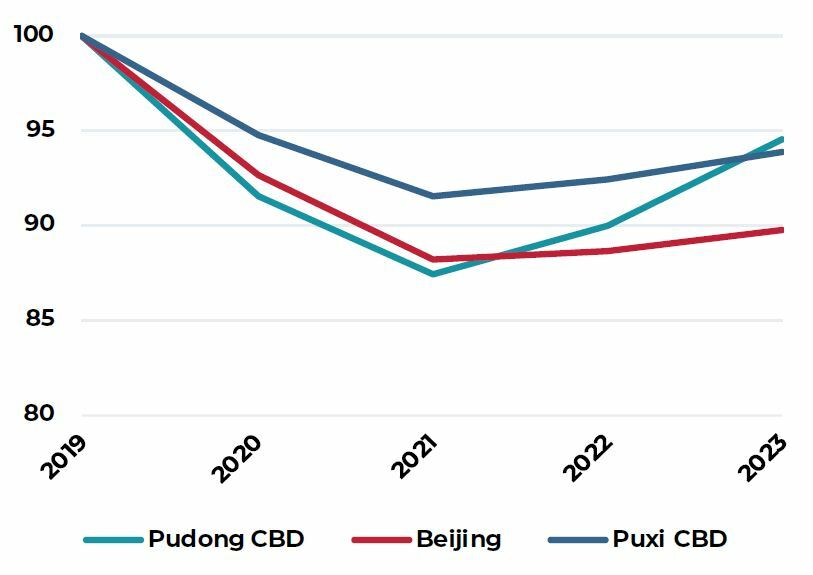
OFFICE RENTAL OUTLOOK
Q4 2019=100
Sources: JLL, as of September 2020
Hong Kong
On-going commercial market downcycle, recovery will be slow
VACANCY INCREASES, ESPECIALLY IN CORE MARKETS
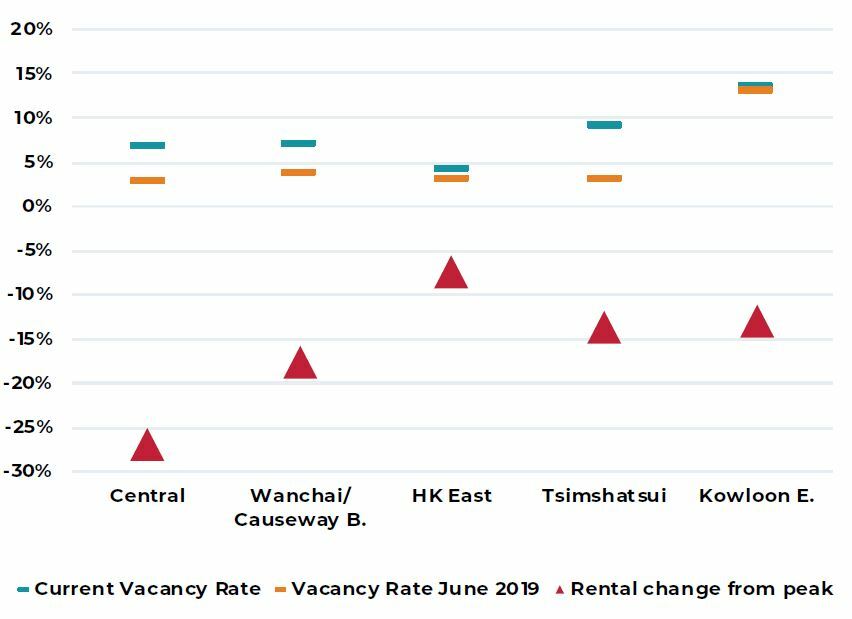
As Hong Kong experienced its third COVID-19 wave between July and August, there have been more companies downsizing or looking for cost saving options in cheaper locations. Currently, most buildings have single digit vacancies, but those with higher levels are extremely flexible on rents. To-date, the bulk of downsizing cases are in the core markets, where vacancy has increased by 4.0 to 5.0 percentage points from March 2019.
TWO-SPEED RENTAL DECLINE COULD IMPACT DECENTRALIZATION
Rents in core areas are expected to decline up to 27% in 2020, bringing the full decline from peak to 31%, while in decentralized markets, the average decline from peak should reach 15%. As the rental gap narrows, this could potentially slow down the speed of decentralization trends going forward. Considering all relocation costs, it generally takes a discount of HKD30 per square foot of monthly rental to justify a move. On average, the rental gap today between Central/Wanchai and Kowloon East stands at around 40 per square foot.
POTENTIAL DEMAND SOURCES, BUT RECOVERY WILL BE SLOW
Overall demand was negative 2.0 million square feet for the first nine months and this is expected to widen to -2.5 million square feet by year-end. This weakness is likely to remain for some time, especially without incremental demand sources from Mainland or Western firms. However, there are some potential sources of demand that could emerge in the near-term from either the strong IPO pipeline on the local stock exchange or a number of U.S. listed Chinese companies aiming for a secondary listing Hong Kong.
RETAIL AND TOURISM CONTINUE TO STRUGGLE
Retail sales in Hong Kong have fallen continuously for the past 19 months (since early 2019 when the city was hard hit by U.S. China trade tensions and local social unrest). The bulk of the decline is attributable to a sharp drop in mainland tourist arrivals which typically account for about 35% of all retail sales. In high street and prime retail, the turnover component for retail rents is mostly eroded and furthermore, as vacancies increase, the incentives and concessions offered by landlords will continue to impact cashflows. Meanwhile, neighborhood malls have performed decently as local consumption remains healthy, but prudent.
A return of mainland tourists is essential to support a recovery in high street and luxury retail, however at this point it seems doubtful. Further as the mainland government looks to stimulate domestic consumption, initiatives like the new Hainan duty-free zone are providing alternative destinations for these getaway shoppers.
OFFICE VACANCY AND RENTAL CHANGE
Q3 2020
OFFICE RENT BY SUBMARKET
2012 to 2020F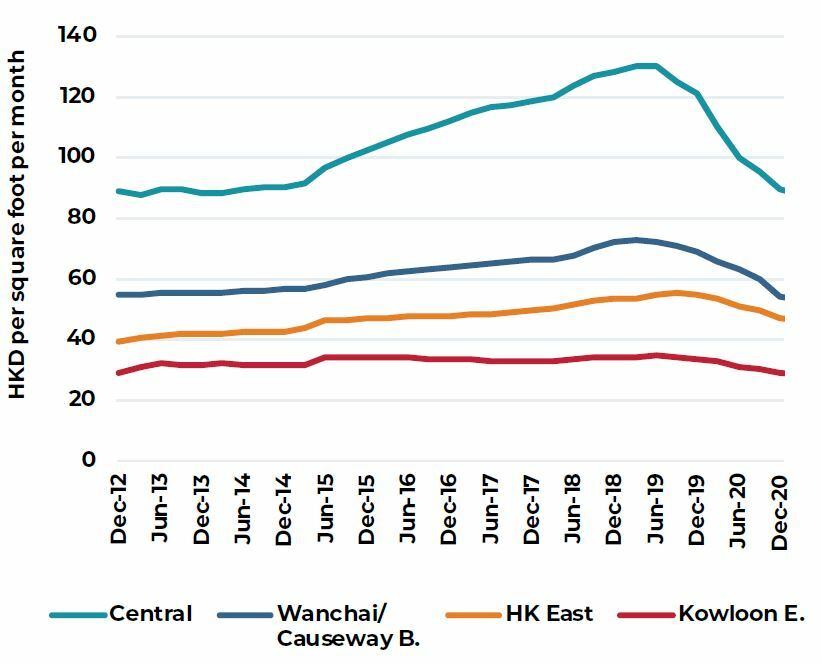
COMMERCIAL RENTAL OUTLOOK
Q4 2019= 100
Source: JLL, as of September 2020
Singapore
Office demand-supply fundamentals shift and slow retail recovery
MOST FIRMS REMAIN IN COST PRESERVATION MODE
In Q3, there were several cases of firms (finance and professional services) giving up space. Demand fell by 150,000 in the quarter which resulted in an increase in vacancy (to 7.1%) and growth in the underlying sub-lease space. Despite overall weakness, technology firms were a singular bright spot for leasing demand. Amazon proceeded with expansion plans while few Chinese technology firms like Tencent, Alibaba and Byte Dance have announced plans to make Singapore their headquarters in the region. While this segment of demand is encouraging, it is unlikely to offset the pull back by other sectors.
SUPPLY DELAYS WILL HELP IN REBALANCING THE MARKET
Due to COVID related disruptions, some new office projects have had their construction timelines delayed. The recalibrated supply schedule has pushed out completion timelines on average by five to six months. Tenants that had pre-committed to spaces in some of these new buildings are being forced to do short-term extension on leases in existing premises. This will allow time for current vacancies to stabilize. Further, based on information available today, the expectation for future office withdrawals (for redevelopment) has increased to 2.0 million square feet, lowering the future net supply to 569,000 square feet per annum over the next three years.
EXPECT A DELAYED RECOVERY
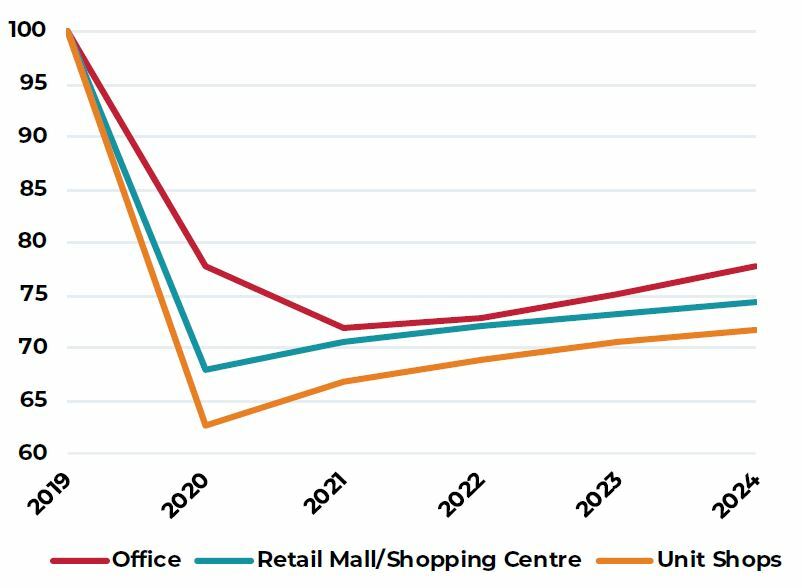
Rents in the CBD are expected to decline up to 15% in 2020 with weakness continuing into 2021. Factoring into this outlook is a slow and gradual “return-to-work guidance” by the government. A rental recovery may only manifest in late 2021, supported by staggered new supply and potential demand from tenants of to-be demolished buildings. Limited available quality product in the decentralized market will also ensure leasing demand remains centralized in the core markets.
STRUCTURAL WEAKNESS IN RETAIL TO REMAIN PAST COVID-19
The decline in retail sales have moderated since the end of June, and consumer sentiment appears to be improving cautiously. Suburban malls have seen a major increase in foot traffic (reported at 90% of pre-COVID levels), however malls in Orchard Road and in the city center that are dependent on tourism and office crowds respectively continue to lag. With leisure travel still not possible, there is a hope for more domestic spending on hotels, and further spillover to retail and F&B. We expect rental declines of up to 15% in suburban malls by 2021, while the decline in prime retail could be twice as much. Even though a recovery is imminent, it could take years before rents recover to pre-COVID levels.
CBD OFFICE DEMAND & VACANCY RATE
Q1 2017 TO Q3 2020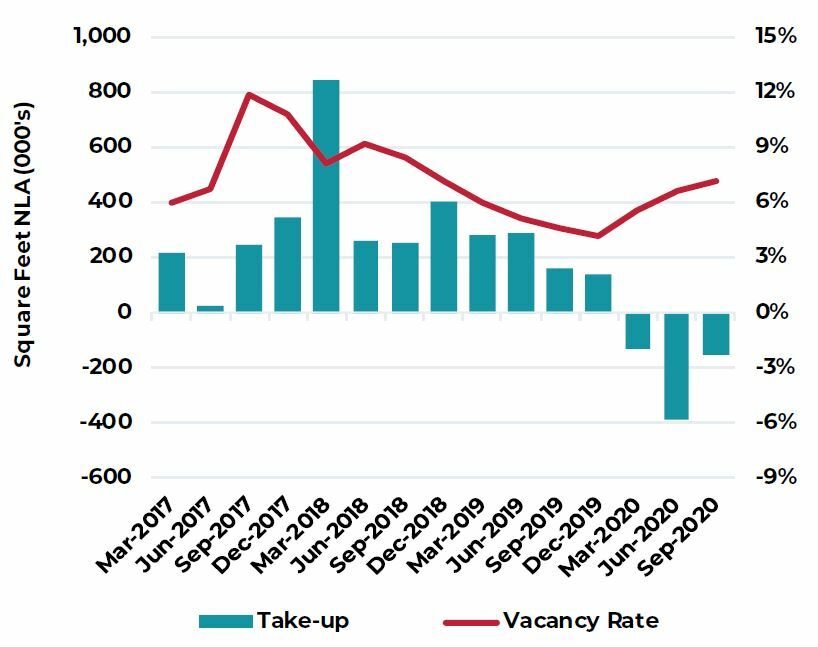
CBD OFFICE NET SUPPLY
2019 TO 2024F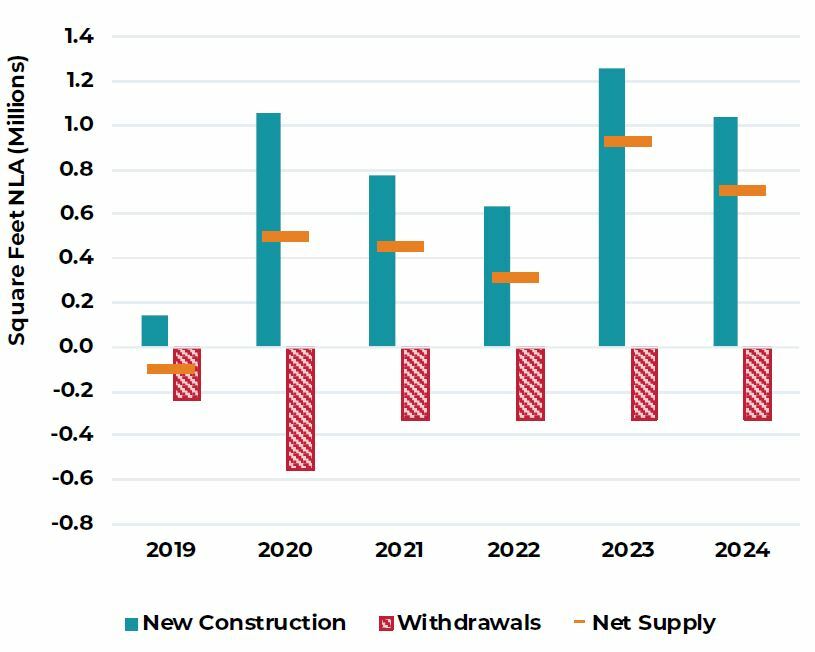
COMMERCIAL RENTAL OUTLOOK
Q4 2019= 100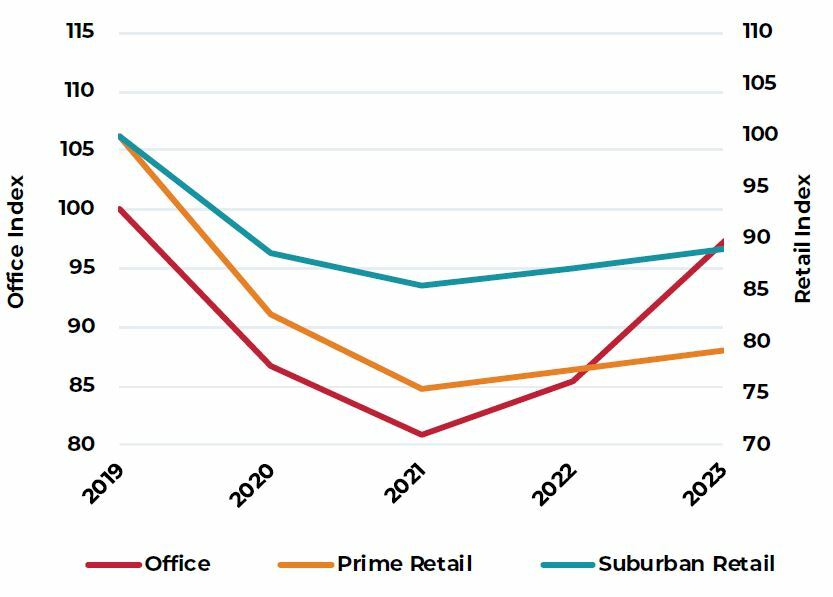
Sources: JLL, as of September 2020
Australia
Medium-term supply outlook will impact recovery profiles in Sydney and Melbourne
SLOW RETURN TO WORK
With the exception of Melbourne, most capital CBDs in Australia have seen a gradual increase in physical occupancy rates by the end of Q3 as state level governments eased restrictions and more firms encouraged a return to office. In Sydney, physical occupancy was estimated at around 30% to 35% by Q3, while in Melbourne, which has been in a stringent lockdown since June, most employees continue to work remotely.
SYDNEY: AFFORDABILITY CONCERNS, NEAR TERM SUPPLY RISK
In the CBD, landlords continued to be extremely flexible on rent structures as leasing sentiment further weakened in Q3. Adding to the lack of demand is affordability constraints in Sydney where rents have more than doubled from 2016 to 2019. AEW understands a few firms have given back space to landlords and as a result, sublease space is currently higher than where it was compared to the Global Financial Crisis. To-date, incentives in the CBD have already increased to close to 30%, resulting in a 15% decline in net effective rents since the start of the year. As the supply pipeline in Sydney looks strong (2.1% p.a. average stock increase in 2021 and 2022) rents are expected to remain weak in the near-term.
In the metro markets however, we expect the rental contraction to be shorter-lived and more moderate. Compared to the CBD, demand is expected to fare better because of rental affordability and a more resilient occupier base. In the medium-term, the metro markets also stand to benefit from a de-densification of workplace ratios and a take-up of hub and spoke model.
MELBOURNE CBD: POSITIVE OUTLOOK BEYOND 2021
Melbourne CBD entered this period with record low vacancy rates which has helped absorb some of the negative demand shocks caused by COVID-19. Further, because of strict movement restrictions after the second wave, most occupiers have held off on major decision-making, possibly understating the impact to-date on demand and rents. Q3 to-date, rents had only declined by about 6%, but data for Q4 could be more drastic.
Similar to Sydney’s CBD, Melbourne is also expected to get a supply boost in 2021 to 2022. While the bulk of this is pre-committed, vacancy is already emerging in the backfill and through subleases. Net effective rents are expected to decline by 12% to 13% up to the end of 2021. In the medium-term however, the outlook in Melbourne appears favorable - construction activity is expected to slow beyond 2021 and tight planning restrictions is helping to form a more positive outlook on rental growth.
SYDNEY CBD & METRO NET EFFECTIVE RENT
2014 TO 2023F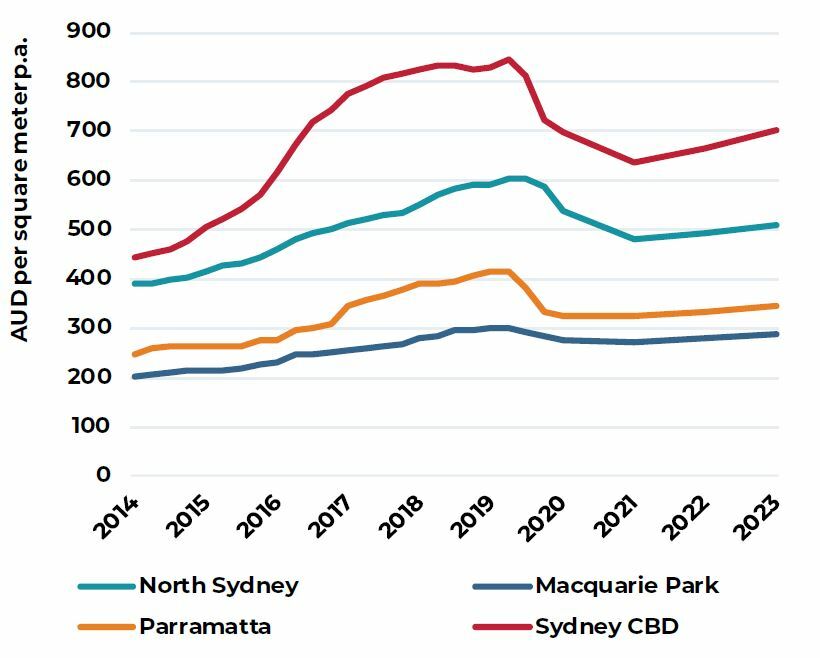
MELBOURNE DEMAND, SUPPLY & VACANCY
2014 TO 2023F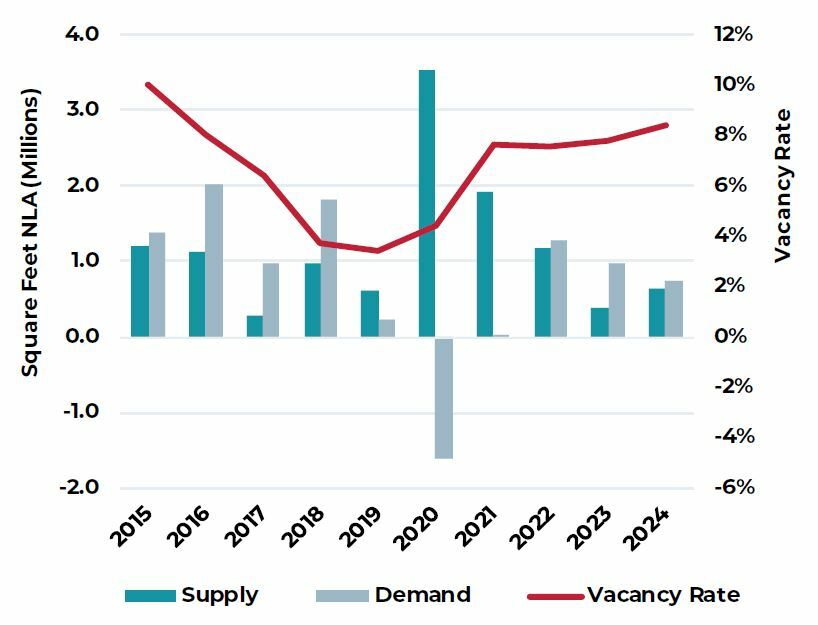
OFFICE NET EFFECTIVE RENTAL OUTLOOK
Q4 2019=100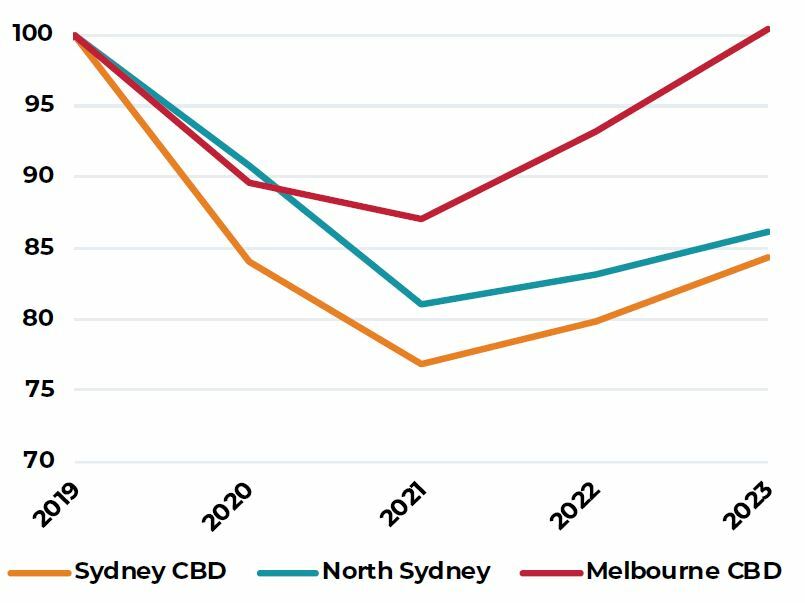
Sources: JLL, and AEW Research as of September 2020
Capital Markets
Strong interest remains despite weaker volumes
TRANSACTION VOLUMES THIS YEAR UNLIKELY TO CROSS 100BN
Across the major Asia Pacific gateway markets, income producing real estate investment volumes have reduced substantially from 2019’s record high. Activity year-to-date (excluding pending deals) is about 40% below levels reached in the same period last year and instead is tracking only slightly below 2016’s volumes. If this pace continues, total investment volumes are unlikely to cross 100 billion for the first time in seven years. To-date, only a few markets have maintained relatively high levels of liquidity. They include Seoul and Tokyo, but investment volumes are still down by 5% and 39% year-on-year respectively.
PENDING DEAL PIPELINE HIGH
As of end of September, the pending deal pipeline was around USD13 billion, considerably higher than normal levels which typically sit at around 7 to 8 billion. The reason for pending volumes being almost double this year is a result of the longer periods required for due diligence (cash flow uncertainty) as well as extended negotiation timelines due to the wide bid ask spread. The bulk of pending deals today, about 60% are offices – mostly located in Seoul. After this, there are several deals meant to take place in Hong Kong and Singapore.
TERMINATED DEALS NOT CONCERNING
A by-product of the uncertainty present in today’s market is an increase in terminated deals. Buyers today are compelled to underwrite the lower income growth, but these are not meeting the price targets of a majority of sellers. Sellers, on the other hand, are in a comfortable position, where debt levels are manageable, and banks continue to be extremely flexible on refinancing rates. Naturally, the bulk (64%) of these terminated deals are hotel and retail assets that got abandoned once COVID-19 hit and halted travel and various forms of brick and mortar consumption. The remaining 36% are office deals that remain challenging to underwrite given the income uncertainty.
LOW RATES KEEP INVESTORS IN SEARCH FOR HIGHER YIELDS
As real yields remain their lowest in a decade, and with evidence it will remain low for the near term, investors continue to search for higher returns in real estate. As a result, this environment has many more buyers than sellers with more than $80 billion in dry powder to be deployed over the next few years. This weight of capital continues to influence pricing today. Asset classes with defensive qualities such as logistics and multifamily are expected to see continued cap rate compression, while in office, cap rates could continue to compress by 2021 as the region’s recovery takes over.
CUMULATIVE TRANSACTION ACTIVITY
2016 TO Q3 2020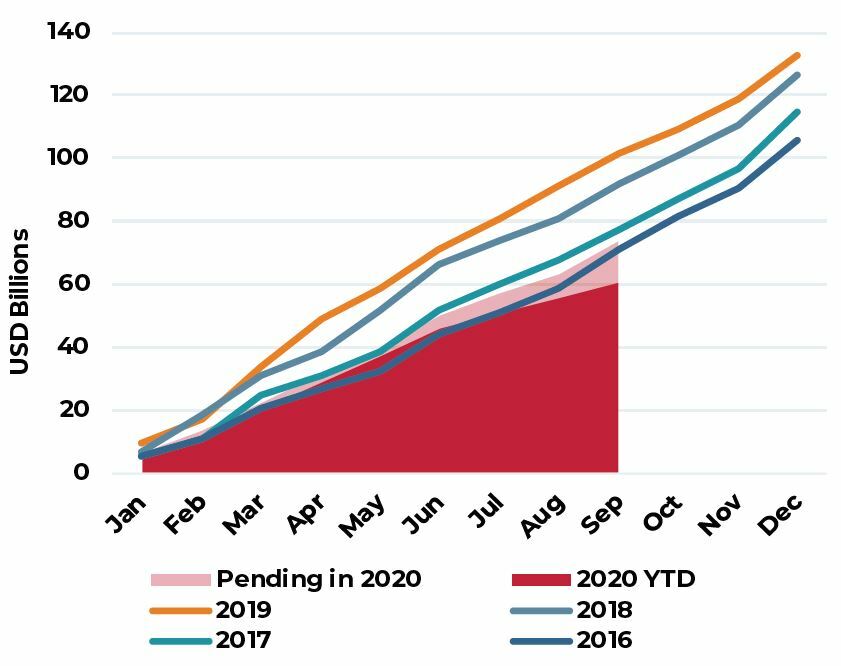
TRANSACTION VOLUME BY MARKET
Q1 to Q3 2020
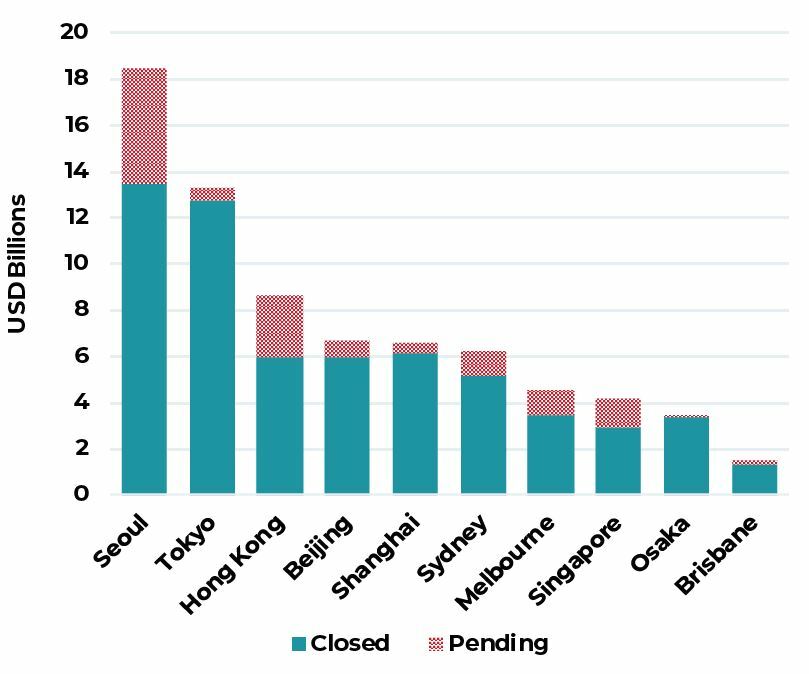
TRANSACTION VOLUME BY MARKET
Q1 to Q3 2020
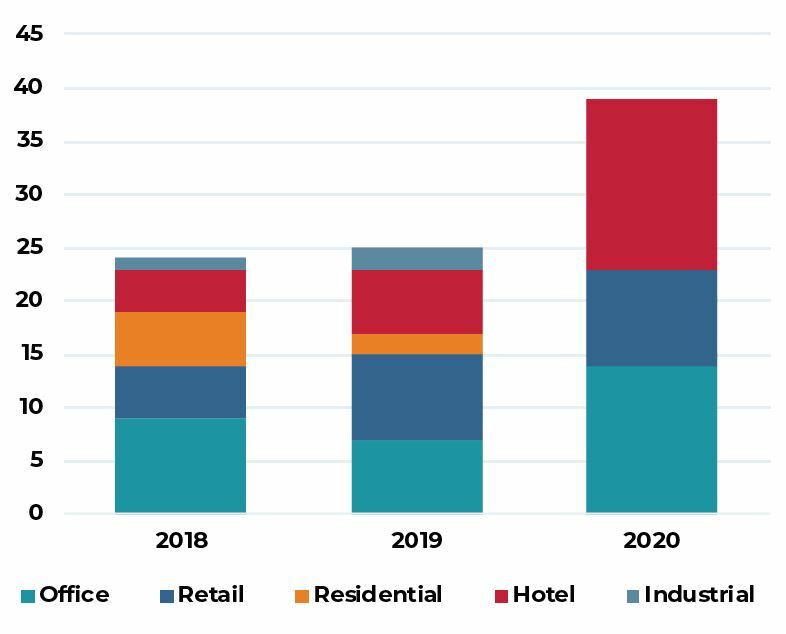
Source: RCA, as of Q3 2020
Note: Transaction volumes in charts above include only income producing assets in the following markets: Beijing, Brisbane, Hong Kong, Melbourne, Osaka, Seoul, Shanghai, Singapore, Sydney and Tokyo
For more information, please contact:
GLYN NELSON
Director of Research, Asia Pacific
glyn.nelson@aew.com
+65.6303.9016
HANNA SAFDAR
Research Associate, Asia Pacific
hanna.safdar@aew.com
+65.6303.9014
ANNA CHEW
Investor Relations, Asia Pacific
anna.chew@aew.com
+852.2107.3511
This material is intended for information purposes only and does not constitute investment advice or a recommendation. The information and opinions contained in the material have been compiled or arrived at based upon information obtained from sources believed to be reliable, but we do not guarantee its accuracy, completeness or fairness. Opinions expressed reflect prevailing market conditions and are subject to change. Neither this material, nor any of its contents, may be used for any purpose without the consent and knowledge of AEW.