Investment Strategy
The New Year has started with a mix of optimism and challenges. Positive news on the vaccine efficacy, production and distribution is being balanced against the emergence and spread of new virus strains and the resurgence of cases in some countries. Meanwhile, outside of pandemic-related developments, recent political changes in the West (the inauguration of President Joe Biden in the U.S. and a finalization of BREXIT in Europe) are expected to increase stability and certainty for markets globally. While the U.S. will continue to maintain its current foreign policy stance with regards to trade and technology with China, we believe that a Biden administration will generally be beneficial for the Asia Pacific recovery.
In Asia Pacific, real estate investment sentiment is upbeat as the region is leading the global recovery from the 2020 downturn. Further, with interest rates still at all-time lows and most central banks committed to keeping rates low for the near-term, investors are increasing their allocations to real estate as they search for higher returns. The latest investor intentions survey indicated about 41% of investors active in the Asia Pacific region intend to increase their real estate allocations over the next two years (to 2022). Current allocations within institutional portfolios are at 8%, versus the target allocation of 10%, indicating there is further room for capital to flow into real estate. For these reasons, the weight of capital in the region remains high, with an estimated $16 billion raised by private funds in the past year.
In 2020, overall income producing transaction volumes across the major gateway cities in Asia Pacific were understandably reduced, falling about 30% year-on-year to $91 billion. Despite the overall decline, there were some city-sector stand out performances, for example Seoul office and logistics as well as Tokyo residential, where occupier markets remained healthy and capital was supportive. It is also worth pointing out that while the year-on-year decline was significant, deal volume did not fall as much as recorded in the Global Financial Crisis from 2008-2010.
The use of technology, be it for virtual site visits or deal negotiations, was widely employed in 2020 to sidestep the travel restrictions, but other issues such as the large bid-ask spread, and pricing uncertainty continued to be concerns. Substantive price discounts were anticipated during the first half of the year, but it soon became clear pricing would hold firm due to vendors having manageable debt levels and the large, supportive government actions. In fact, defensive sectors such as logistics and multifamily (Japan) saw continued cap rate compression. Pricing in office was mostly stable, while some discounts were evident in hospitality and retail, based on the few transactions that were completed. As massive stimulus programs are expected to reach their tail-end in Q1 2021, it could mark a transition into a new pricing dynamic in the market. Small-to-medium enterprises (SMEs) as well as smaller retail groups are expected to be the most vulnerable.
In the office sector, location, building-quality and underlying tenant demand will be key value drivers for buyers. New office supply is expected to have features that are adaptive to a post pandemic world, incorporating hygiene measures such as enhanced air ventilation, handsfree lifts and different shared workspace configurations. In some markets, we are also seeing offices close to residential hubs gaining traction as more occupiers experiment with the core and satellite model. Meanwhile business parks that house industries such as technology, research and development, and media and communications should continue to benefit from the expanding occupier base. For logistics, COVID-19 has undoubtedly transformed the sector, and a greater reliance on ecommerce means that demand for logistics space is stronger than it has ever been. Modern assets with the optionality to partially convert dry space to cold storage should translate to a strong uplift in value, as demand for food and vaccine storage take precedence. Meanwhile for retail, while the operational outlook remains challenging, there could be some repricing opportunities in coming months, which when coupled with repositioning or conversion may meet risk-adjusted return expectations.
Economy
Asia Pacific is leading the global economic recovery out the 2020 recession and is expected to grow by 6.4% in 2021, above the 4.2% anticipated for both the U.S. and Eurozone separately. In fact, many Asia Pacific economies had already been showing significant recovery in economic momentum in the second half of 2020 as a result of more coordinated COVID-19 management. This was driven both by the strengthening global export demand as well as the return in domestic consumption spending as pandemic-related restrictions were eased. Still, the recent new wave of cases in the North Asian region could impede the return to pre-pandemic activity levels and make the recovery uneven across countries and sectors.
Today, positive news on vaccine developments have reduced downside risks to growth forecasts. The rollout of vaccines has already started across several countries and we expect populations that are inoculated earlier to benefit. The widespread assumption is that developed economies in Asia Pacific should have an edge, compared to their emerging market counterparts. Across the gateway economies in Asia Pacific (Australia, China, Hong Kong, Japan, Singapore and South Korea), growth is expected to average 4.5%.
A key factor underpinning the strong economic rebound in the region is the outlook for China, which is forecast to expand by 8.1% year-on-year in 2021. China’s consumption growth was lagging in 2020 but is expected to be much better in 2021 as the services sector recovers. At the same time, we expect corporate investment to step-up, while public sector support unwinds in 2021. As China’s recovery has reached a mature stage, the government in Q4 2020 communicated a change in the balance of priorities, with a focus going forward on sustainable growth. For 2021, we expect fiscal policy in China to turn contractionary, as the government pulls back on infrastructure and real estate spending. At the same time, with inflation set to increase and the PBOC communicating a renewed focus on containing financial risks, monetary policy is expected to be gradually tightened.
Elsewhere in Asia Pacific, policy support is expected to play an important role in growth. Governments continue to commit to loosen monetary policy, keeping interests rates low and encouraging the banking sector to continue to lend. On the fiscal front, the outlook by countries is mixed. In Australia, Hong Kong and Singapore, sequential recovery and better than expected labor market conditions are giving the government further impetus to roll back on its fiscal support. Meanwhile in North Asia, government support is expected to remain high. In South Korea, the budget deficit for 2021 is 3.6% of GDP, which only represents a modest tightening after 2020’s record stimulus. Similarly, in Japan, the government unveiled a third supplementary budget in December 2020, bringing the total budget for fiscal 2021 to JPY106 trillion, topping JPY100 trillion for the ninth consecutive year in a row.
As the region held up comparatively better in 2020, Asia Pacific currencies generally appreciated against the USD last year. The AUD made significant improvement, up 9.6%, followed by CNY(+6.3%), KRW (6.0%), JPY(+6.0%) and SGD(+1.8%).With a comparatively better recovery trajectory for the region, we expect the Asia Pacific currencies to continue to appreciate relative to the USD for 2021. In particular, North Asian currencies will continue to be supported by the favorable global electronics cycle. Meanwhile the outlook for the AUD is a bit mixed. While commodity dependent currencies like the AUD stand to benefit from a recovery in commodity export volumes and prices, the recent import bans from China as well as the RBA’s decision to extend its bond purchase program till September 2021 could offset this momentum.
MACROECONOMIC INDICATORS
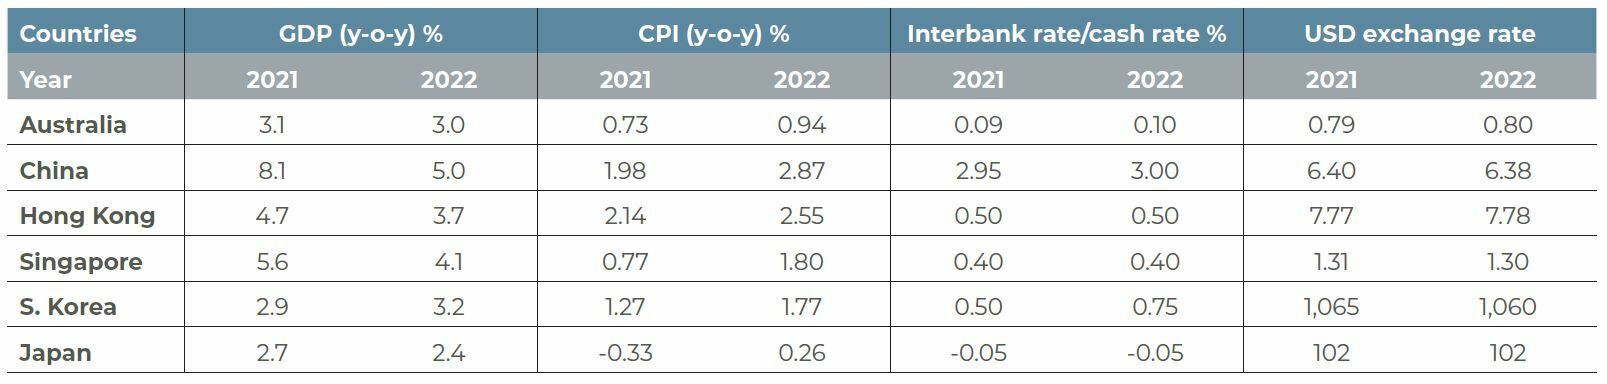
Source: Oxford Economics, 25 January 2021
Japan
Multifamily remains defensive, office fundamentals supportive for stabilization in 2021
MULTIFAMILY: VACANCIES INCREASE IN SMALLER-SIZED UNITS
While the sector was highlighted as one of the most defensive asset classes amid the 2020 downturn, vacancy increased in H2 2020 as a rise of COVID-19 cases affected migration patterns and leasing velocity. Consequently, rents have declined mildly since their peak in Q1 2020 and are down about 2.3% in the year.
Typically, the centrally located units of 15 to 30 sqm in size are most popular among younger residents, but the pause in migration patterns and the increased work-from-home practices through the year have made these units temporarily less desirable. Instead, a more stable rental profile for the larger-sized units of 30 sqm to 45 sqm was observed over the year. Going forward, as vaccines are rolled out and migration patterns resume, we expect leasing in the smaller size segment to return to normal levels. Market rents are expected to be flat in 2021 as the market re-stabilizes before returning to stable growth of 1% to 2% per annum.
TOKYO OFFICE: LIMITED NEW SUPPLY FROM 2021 TO 2022
Tokyo’s office market entered the economic downturn on sound fundamentals. Vacancy rates were at multi-year lows and rents had seen an increase of 22% for the past five years across all building grades. However, the pull-back in demand in 2020 coincided with Tokyo’s supply cycle (estimated at 10.5 million square feet). While this was largely pre-committed, through the year some cancellation of space was recorded. By the end of 2020, Grade A vacancy rates were up by 0.7 percentage-points. There was also increased vacancy pressure in the Grade A minus buildings, where several tenants have relocated to new premises.
Going forward, a much lower supply level in 2021 to 2022 could be helpful to a rental recovery, but uncertainty on demand levels going forward remain a hurdle. Current forecasts anticipate vacancy rates increasing by 1.2% in the next two years. While work-from-home practices could continue once the pandemic is under control, most Japanese companies have strong balance sheets and should continue to hold on to existing office spaces.
OSAKA OFFICE: LIMITED SUPPLY UP TO 2023 TO SUPPORT RENTS
Office landlords have benefited from tight supply in recent years, supporting healthy rental growth. In 2020, the weakening of tenant sentiment resulted in a slight increase in vacancy to 3.4% and some resistance to rental increases in H2 2020. The lack of meaningful supply for the next three years will support the resumption of the office rental cycle (up to 3% p.a. from 2021 to 2023), before supply peaks in 2024.
TOKYO NET MIGRATION
2019 vs 2020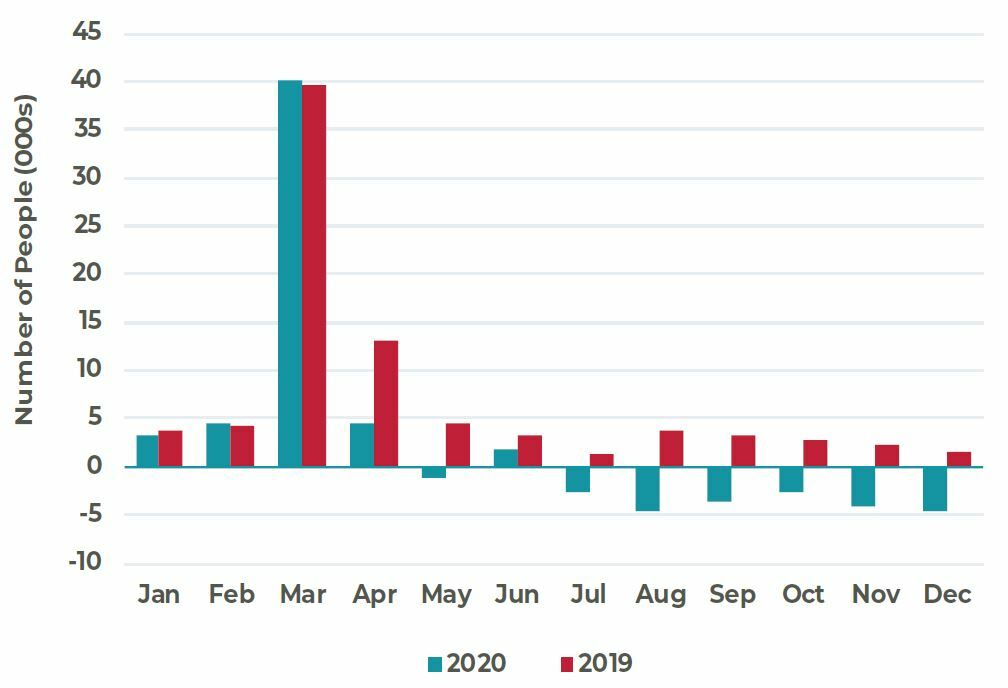
TOKYO OFFICE VACANCY RATE
2015 TO 2022F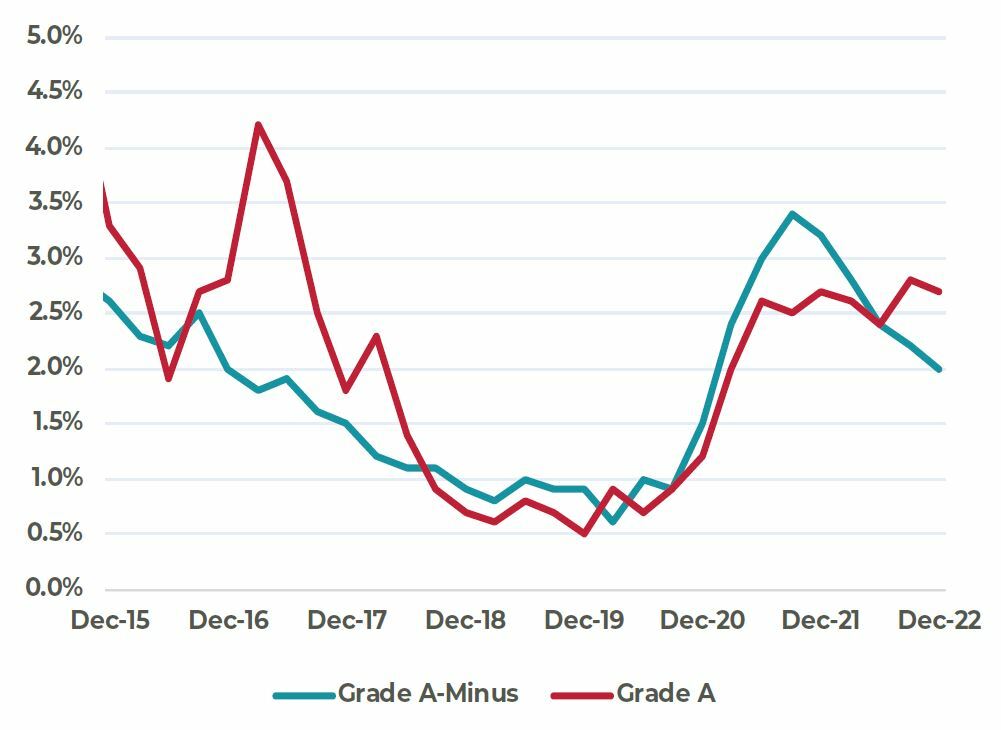
OFFICE RENTAL OUTLOOK
Q4 2020 = 100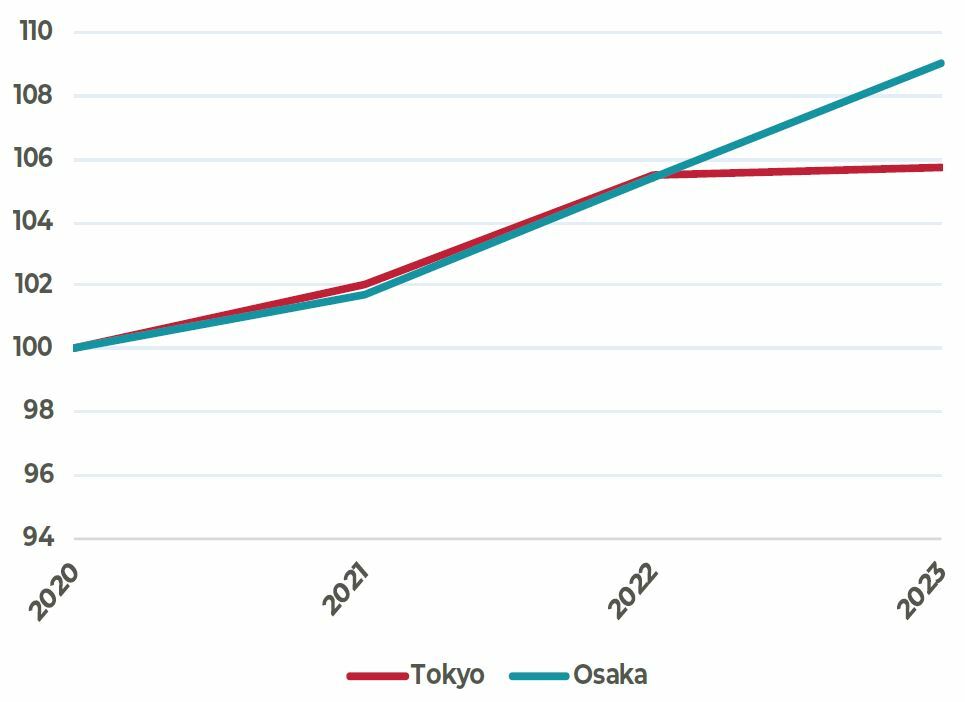
Sources: CBRE, PMA, as of December 2020
Seoul
Office holds up well in 2020 while the logistics market is extremely landlord favorable
LIMITED IMPACT TO-DATE FOR SEOUL OFFICE MARKETS
In contrast to most other major gateway cities in Asia Pacific, take-up in Seoul’s three-core submarkets remained active in 2020. Expansion from local conglomerates and finance groups offset downsizing by companies most affected by the pandemic and resulted in overall positive net absorption of 621,000 square feet for the year. Active leasing in newer, prime grade buildings indicate a “flight to quality”, a feature that persisted in 2020 despite the economic circumstances. The recent rise in daily cases have forced more companies to allow remote working, but this is expected to be just temporary. The Korean work-from-home market has not matured yet as work culture still rests heavily on on-site contact. This is therefore not expected to detract from office demand going forward.
OUTLOOK VARIED BY SUBMARKET
The rental outlook in Seoul is divergent by submarket, and is much more dependent on the demand momentum, current vacancy and scale of new supply in the near-term. Currently, fundamentals are most favorable in the GBD, where low vacancies and pent-up demand by firms in the technology sector continue to place upward pressure on rents. Meanwhile in the CBD, after a period of elevated supply from 2017 to 2020, the market is entering a supply lull from 2021 to 2024, which will help stabilize vacancy rates and provide upward pressure on rents. The outlook for the YBD is less positive, where new construction will continue to compete with older stock and keep vacancy rates high.
DEMAND FOR MODERN LOGISTICS SPACE INCREASE
The surge in the volume of e-commerce sales in 2020 had a direct impact on the demand for logistics space in Greater Seoul. Throughout the year, leasing brokers reported high expansionary and relocation demand which sometimes could not be fulfilled due to the lack of suitable space. On an overall basis, rents increased by 3% to 5%, led by the newer, centrally- located facilities.
Despite almost 13.3 million square feet of new supply in the last three years, the market is still undersupplied. There is a lack of space suited for cold storage, as this has only made up 25% of the new supply since 2015. This has resulted in an extremely landlord favorable environment, where rent for modern facilities are expected to increase by 2% to 3% p.a. in the near-term. We expect the rental outlook for cold facilities to outperform due to strong demand and limited supply.
SEOUL OFFICE NET ABSORPTION
Q1 2016 TO Q4 2020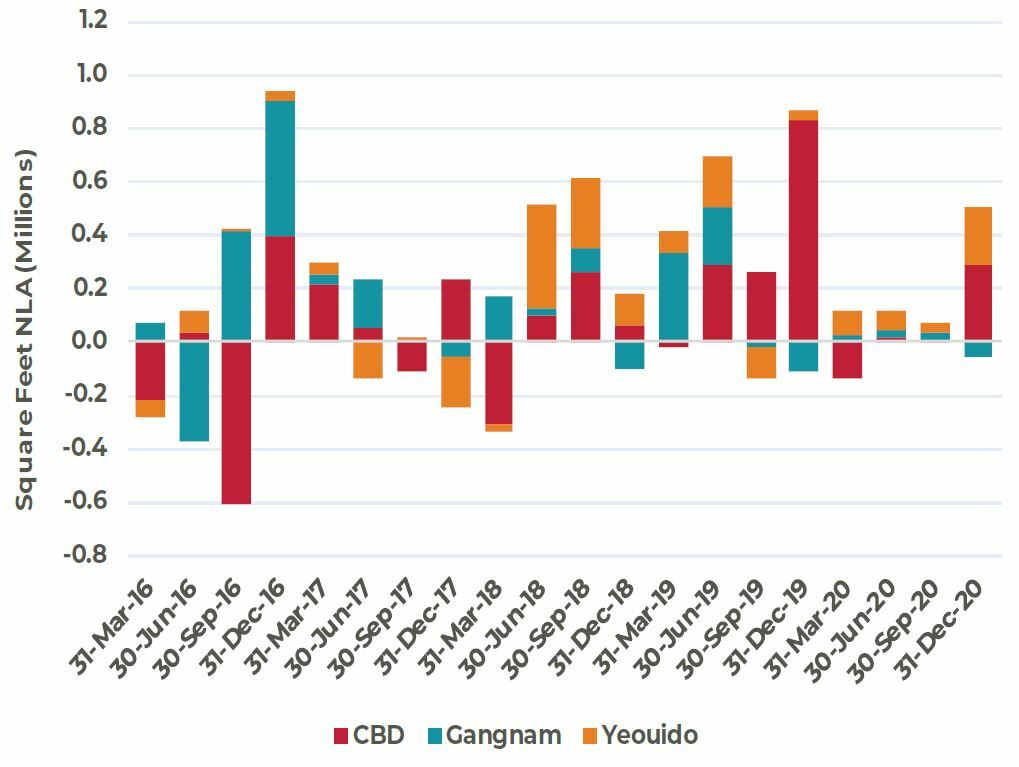
OFFICE RENTAL OUTLOOK
Q4 2020 = 100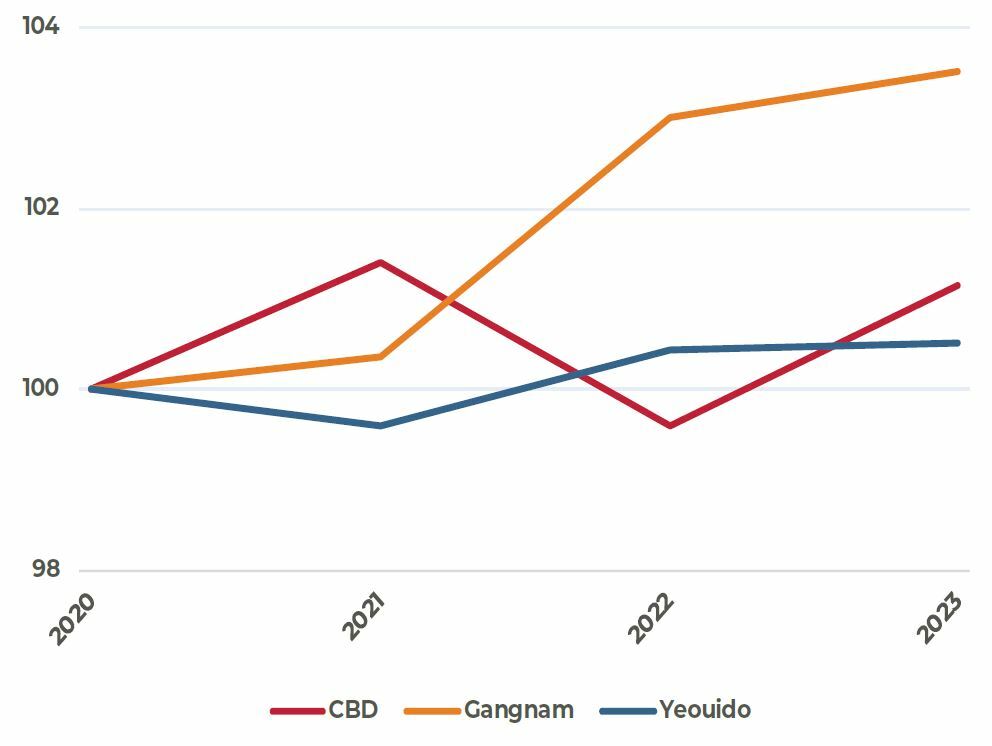
LOGISTICS RENTAL OUTLOOK
Q4 2018 = 100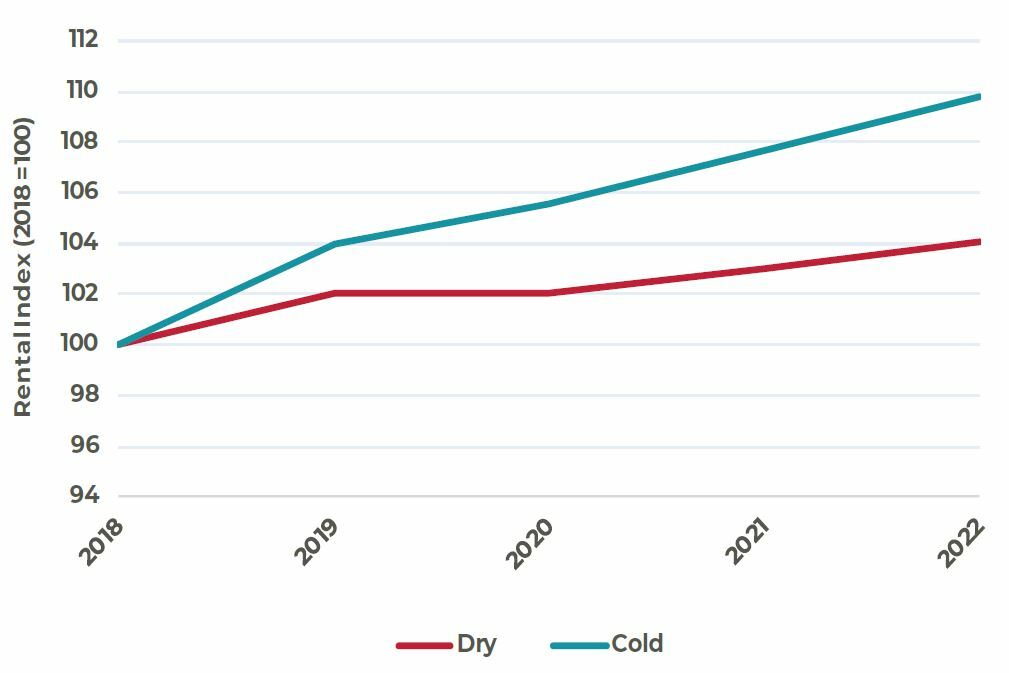
Sources: JLL and AEW Research, as of December 2020
China
Large supply in office an obstacle to quick rental recovery, business parks remain resilient
SHANGHAI
LIMITED RENTAL GROWTH DESPITE LEASING RECOVERY
Leasing volumes in 2020 remained healthy, coming in at levels similar to 2019, but during the year a stronger pivot towards decentralized markets (where rents are about 50% cheaper) were noted as cost factors became a priority for a wider pool of occupiers. About 97% of office take-up in 2020 was concentrated in the decentralized markets (vs 82% in 2019). Leasing momentum is expected to stay upbeat in 2021, but the ongoing supply cycle is keeping vacancy rates high and continues to place downward pressure on rents. Office rents in the CBD are expected to remain weak for the next two years, but there could be opportunities for outperformance in mature clusters with supportive policy like Liujiazui. Meanwhile in the decentralized market where supply levels are elevated, rental weakness will remain in the near-term.
CORE BUSINESS PARKS SEE CONTINUED RENT GROWTH
Core business park clusters that have strong industry clustering from resilient industries like software services, medical and healthcare, life sciences (e.g. Caohejing and Zhangzhiang) have maintained steady rental growth through 2020. Meanwhile, in the other submarkets such as Jingqiao and Shibei, landlords were more concerned with vacancy rates (some have been persistently high for years) and continued to give rental discounts. The supply cycle in core business parks will continue into 2022, but it continues to attract occupiers across relevant industries and rental markets remain in favor of landlords. Rental growth going forward is likely to vary, with rents in the core business parks increasing by 2% to 3% p.a. in the near-term, outperforming the emerging ones.
BEIJING
DOWNWARD RENTAL PRESSURES TO REDUCE IN 2021
After several quarters of rental decline due to supply pressures, better rental affordability has encouraged more relocation demand, making up about 60% of all leasing transactions in Q4. Supportive government policies for healthcare and technology sectors are encouraging further office expansion for some of these companies. Still, landlords in submarkets with high vacancies continue to provide discount to attract tenants.
While future supply is still heavy, AEW understands some landlords are delaying their completion dates slightly which is mitigating near-term supply concerns. Rents are expected to continue to weaken in high vacancy submarkets like Guomao and Olympic Park, while rents in others like Finance Street, East 2nd Ring Rd should remain relatively stable.
SHARE OF NEW OFFICE DEMAND BY DISTRICT
2015 TO 2020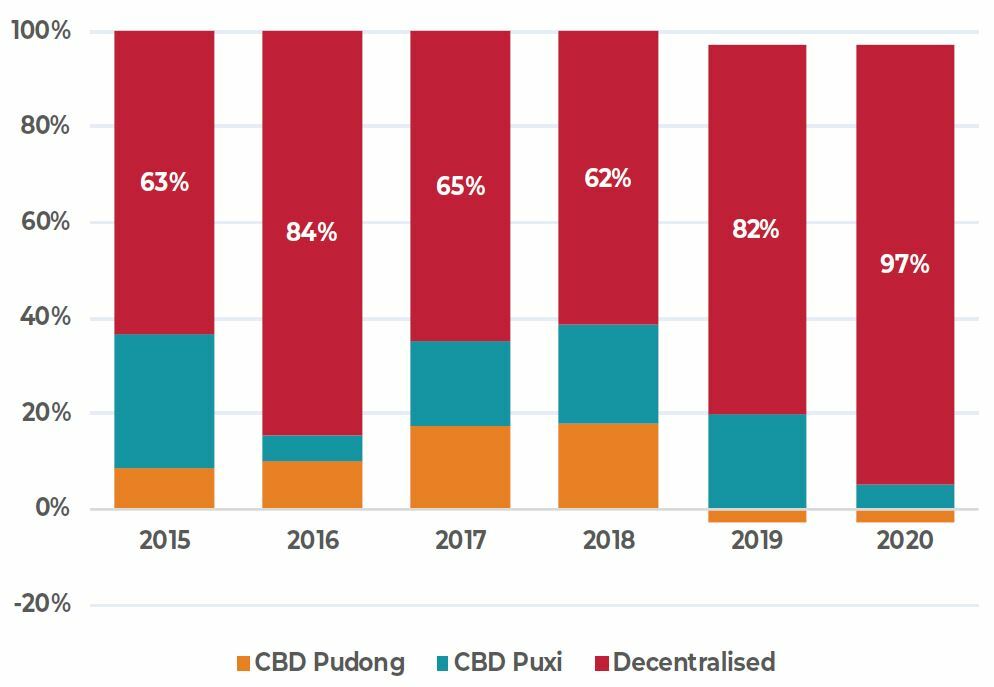
VACANCY & RENTS BY BUSINESS PARK CLUSTER
Q4 2020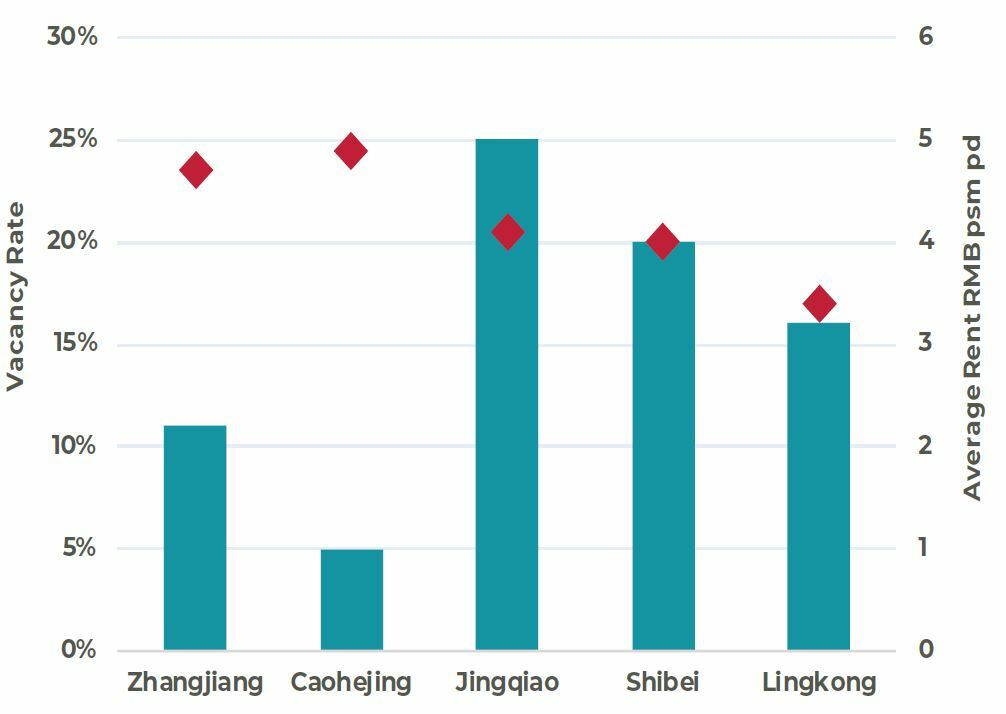
OFFICE RENTAL OUTLOOK
Q4 2020=100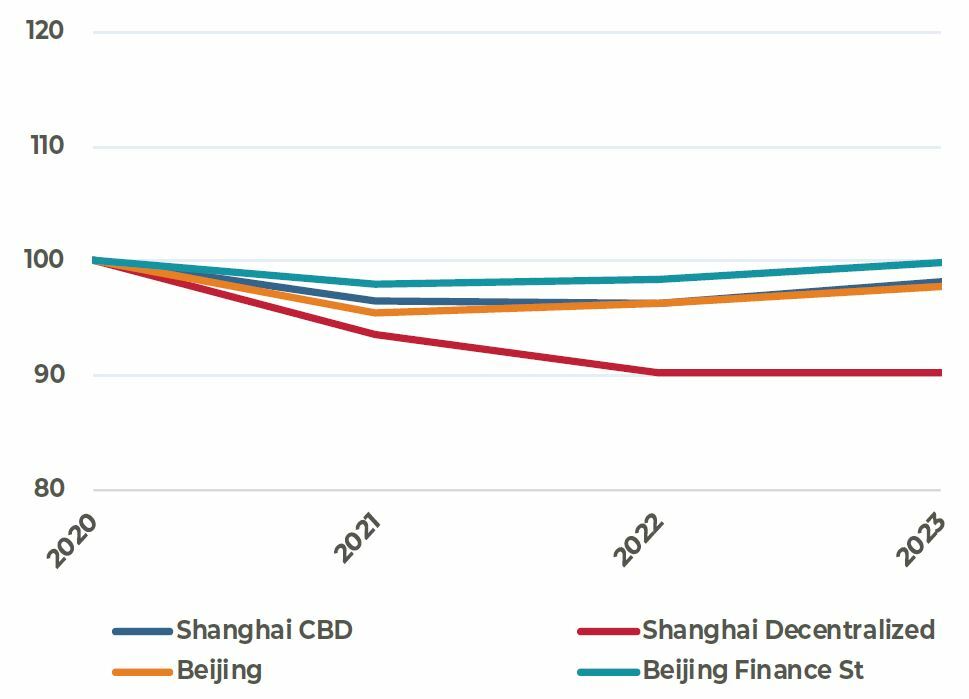
Sources: JLL, as of December 2020
Hong Kong
Office market to remain tenant favorable in 2021, outlook for retail highly uncertain
LARGEST CONTRACTION IN DEMAND ON RECORD
In Q4, occupiers continued to maintain a conservative attitude towards office space needs, with more cases of downsizing and space rationalization in Q4. Net contraction of office space for the full year was 2.2 million square feet, the highest on record. As a result, the overall vacancy rate has increased three percentage points in the year to 8.9%. Landlords, especially those on Hong Kong Island, were offering more discounts, incentives and capex allowances to compensate for limited leasing demand.
NEW SOURCES OF DEMAND COULD REINSTATE HK’S STATUS
Alongside the economic recovery anticipated for 2021, leasing demand is expected to improve. Some potential sources of new demand could emerge in 2021 either from the strong IPO pipeline on the local stock exchange or from some of the U.S.-listed Chinese companies aiming for a secondary listing in Hong Kong. If these materialize, it will re-emphasize the city as a gateway for Chinese capital to access global markets and remove doubts that have been building on its status as a financial hub in the region.
TWO SPEED RENTAL DECLINE
Vacant office space on Hong Kong remains abundant (estimated at 8 million sq. ft) and with major lease expiries coming up, there will be a vacancy overhang despite no new supply expected this year. Office market should remain in favor of tenants in 2021 with rental declines of up to 10%, led by rents in Central. Meanwhile, decentralized markets should hold up better. Compared to Kowloon East, where vacancy rate is in excess of 14%, Hong Kong East is expected to have a healthier outlook due to the smaller development pipeline and better quality of the projects delivered.
RETAIL MARKETS REMAIN FRAGILE
Retail sales volumes remain 26% below the 2017-2018 average level. Today, high street store vacancy is estimated at 14%, with a wave of store closures occurring in the past two years. Rents have fallen back to 2004 levels and represent about one-third of rent levels from the last cycle peak in 2014. By comparison, shopping centers have held up much better with full year rental decline of between 5 and 6 % in 2020. AEW understands that shopping center landlords have invested in marketing and other promotional activity/campaigns to support tenants and encourage sales. Going forward, retail markets are expected to remain challenging. More store closures are expected in the first few months of 2021. Further, the lack of clarity about the resumption of inbound tourism will ensure retailers selling discretionary items remain in wait-and-see mode, at least for the duration of H1 2021.
OFFICE DEMAND TREND
2007 TO 2020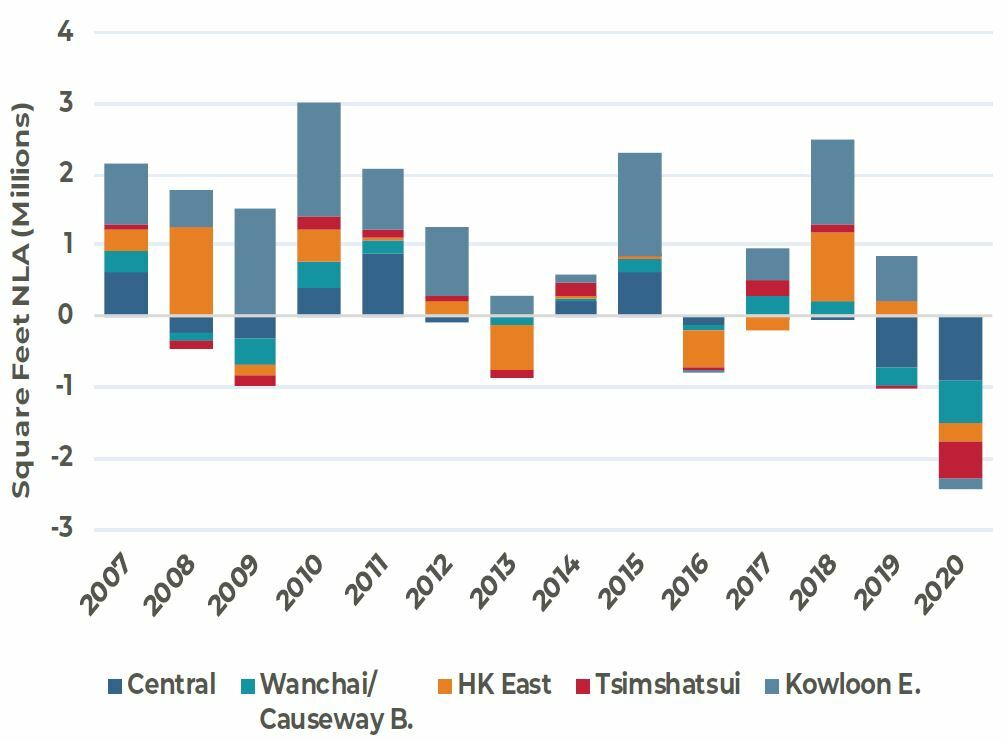
OFFICE VACANCY & RENT BY SUBMARKET
Q4 2020 vs Q4 2019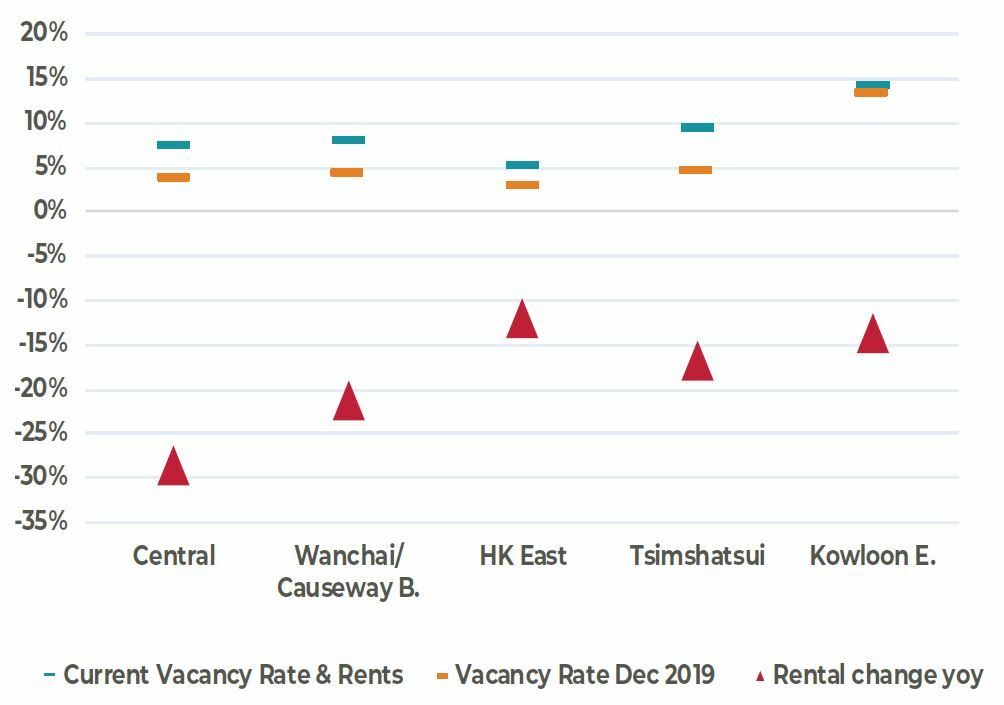
COMMERCIAL RENTAL OUTLOOK
Q4 2020= 100
Source: JLL, as of December 2020
Singapore
Office demand-supply fundamentals shift and slow retail recovery
PICK-UP IN OFFICE LEASING ACTIVITY TOWARDS END 2020
With more confidence in terms of COVID-19 management and the prospects of an economic recovery, leasing markets turned positive in Q4. Some major banks formally implemented hybrid work models to increase cost efficiency resulting in more space rationalization, but this was offset by some large leasing deals in the CBD. Vacancy reached 6.8% in Q4, still in line with the long-term historical average.
RENTAL DECLINE IN 2020 WAS LESS THAN EXPECTED
Despite 2020 being the deepest economic recession on record, CBD rents declined by only 10%, considerably less than the 25% decline in the year following the Global Financial Crisis. This was less than initially expected and indicates office rents in Singapore have moved to milder rental cycles versus historical. In Q4, landlords resisted further deep cuts for leases signed as positive news was already building for the economic recovery. While the expectation is for rental weakness to continue in 2021, optimism on the economic front could support an earlier turnaround. Further, the supply side fundamentals in Singapore are positive where net supply should result in a stock increase of just 1.6% p.a. up to 2025, much lower than the past five-year historical record.
RESILIENCE IN BUSINESS PARKS, SOLID OCCUPIER BASE
Unlike the office market, business parks, or light industrial buildings, did well. In 2020, underlying industries such as technology-related, media and life sciences benefited as a result of COVID-19. Generally, facilities in the city fringe are newer, with better retail amenity and building quality, they are generally more popular with tenants and command higher rents. In 2020, AEW understood the relocation demand to facilities in the outskirts was also active, driven by cost conscious occupiers looking for a less expensive alternative.
POSITIVITY BUILDING IN RETAIL, FUNDAMENTALS STILL WEAK
The decline in retail sales have moderated since the end of June, and consumer sentiment appears to be improving cautiously. Suburban malls have seen a major increase in foot traffic (reported at around 60% to 80% of pre-COVID levels), however malls in Orchard Road and in the city center that are dependent on tourism and office crowds, respectively continue to lag. New leasing activity was mainly in the F&B segment, meanwhile, some large department stores have closed permanently. We expect rental declines of up to 4% for suburban malls by 2021, while the decline in prime retail could be twice as much. AEW believes that it could take years before rents recover to pre-COVID levels.
CBD OFFICE DEMAND & VACANCY RATE
Q1 2017 TO Q4 2020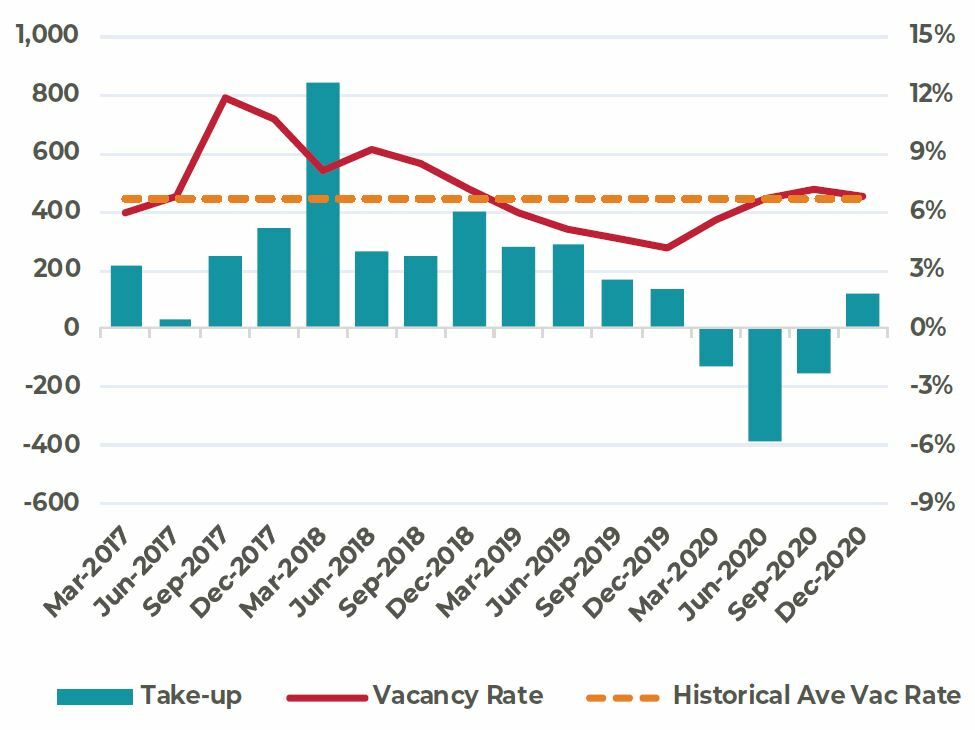
CBD OFFICE NET SUPPLY
2019 TO 2024F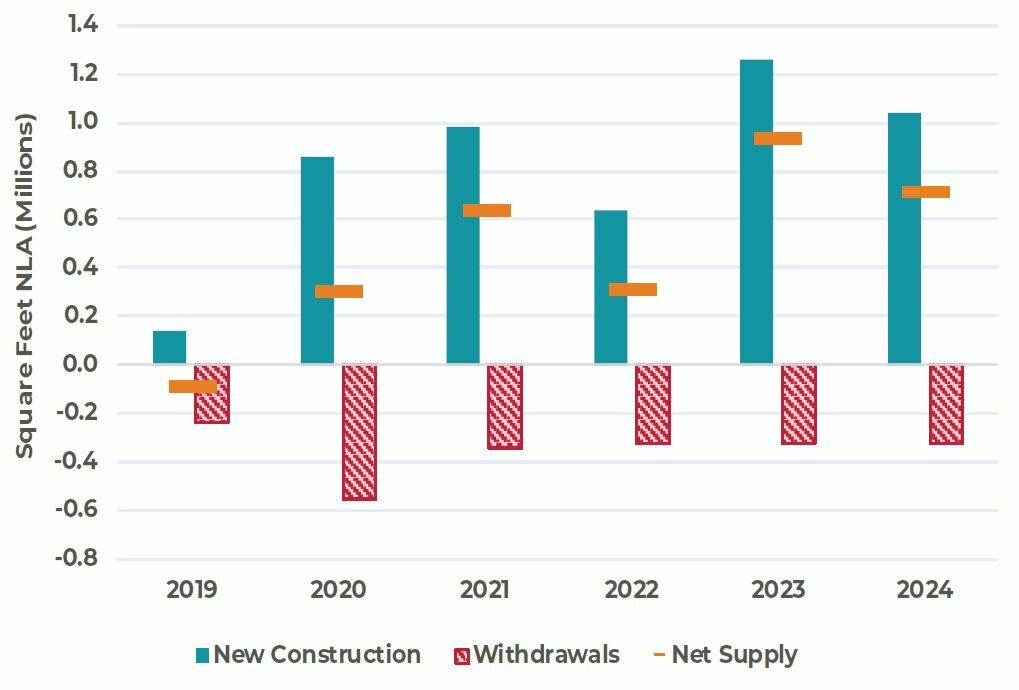
COMMERCIAL RENTAL OUTLOOK
Q4 2020= 100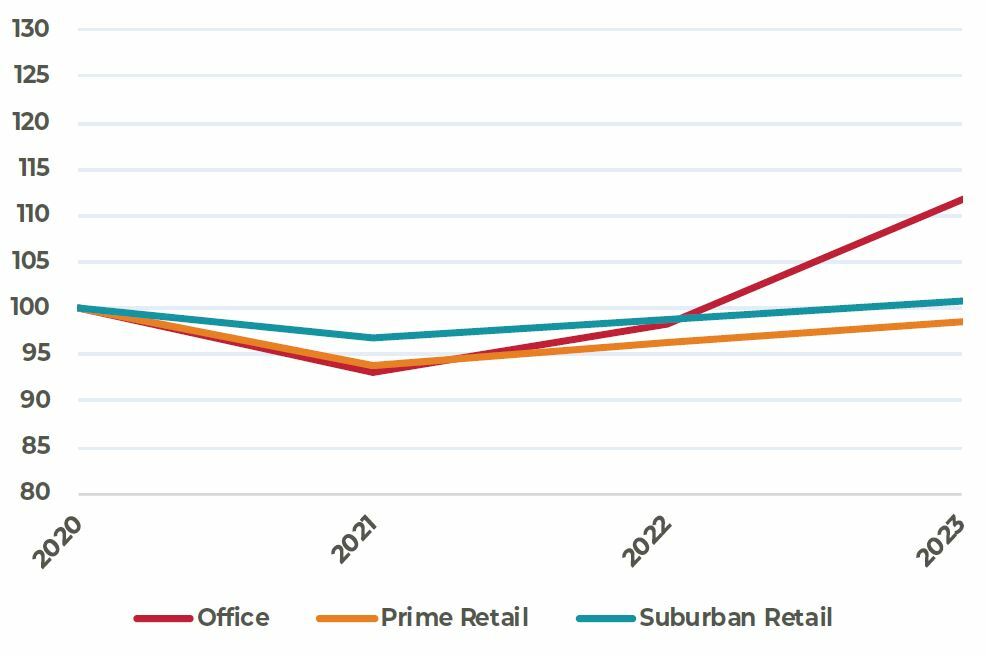
Sources: JLL, as of December 2020
Australia
Best prospects for logistics, expect recovery in Melbourne office to form before Sydney
OFFICE OUTLOOK MORE FAVORABLE IN MELBOURNE
This was the worst year of demand on record for the office sector in Melbourne and Sydney. Vacancy rates rose from cyclical lows in 2019 to 12% and 13% in the CBD, respectively. Besides weak leasing markets, new supply in both markets was also partially to blame for this increased inventory. As a result, incentive levels spiked to 30% and 33% respectively in Sydney and Melbourne.
Pitting the two cities against each other, we believe that the near- term outlook for Melbourne is more favorable, due to the slowdown in construction activity as well as supply constraints as a result of tight planning activity by the local government. Conversely, Sydney has seen a strong supply in response to the near doubling of rents in the five-year period from 2015 to 2019. This will result in vacancy in Sydney being elevated for some time, keeping leasing challenging for landlords.
REPRICING IN RETAIL BRINGS INTEREST BUT CHALLENGES REMAIN
The Australian retail opportunity is looking more interesting, with increased income certainty today versus six months ago. Repricing, especially in the smaller end of the market (smaller sub-regional malls), means these assets are now accessible at yields of around 6.5% to 7%. With cheap debt still widely available, this presents extremely favorable cash-on-cash returns.
Nevertheless, challenges remain as the operating environment remains difficult. Many retailers are sitting on holdover leases and continue to request discounts. Further, more bankruptcies and store closures are expected as government support rolls off in Q1 2021. Shopping center landlords have also been working to increase income profiles of their assets by suggesting new rent structures. Typically, listed retail landlords strike leases with fixed rents and annual increases linked to inflation. Some landlords have taken steps to try and change this to a turnover base rent that would favor landlords, but retailers remain resistant.
RENT GROWTH TO CONTINUE IN LOGISTICS
Logistics markets in Australia are well-balanced. Even though supply in recent years has ramped up significantly, demand levels have matched this well, driven by the growth of the e-commerce sector. AEW understands while a lot of the development is on a speculative basis, pre-let shares are high and confirm that occupiers prefer newer and modern facilities. Given the strong level of demand, we expect sustained rental growth in the sector in the near-term. Consumer demand for fast delivery will see centrally located sites such as South Sydney, with good transport access, be increasingly sought after and result in stronger rental growth.
OFFICE NET EFFECTIVE RENTAL FORECAST
Q4 2020 =100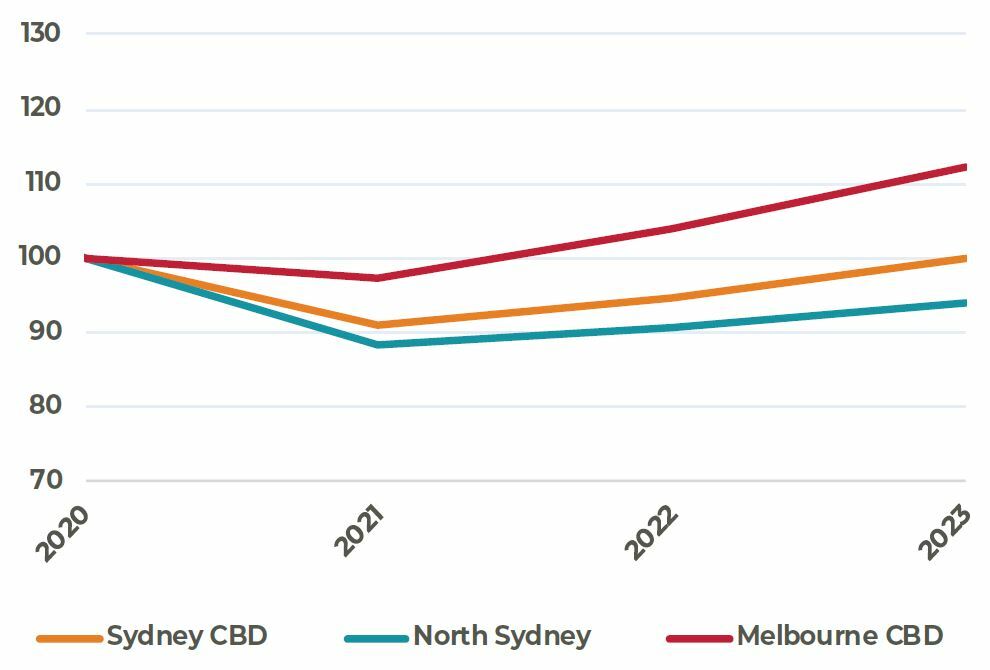
NATIONAL RETAIL YIELDS
2016 TO 2020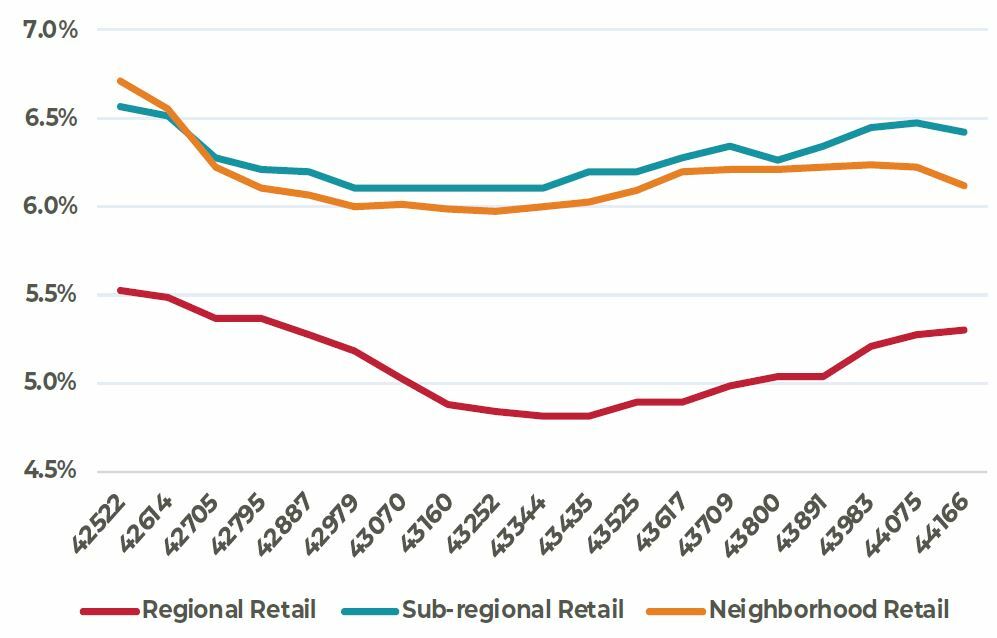
LOGISTICS RENTAL OUTLOOK
Q4 2020=100
Sources: JLL, as of December 2020
Capital Markets
Transaction activity set to increase in 2021
TRANSACTION VOLUMES FELL BELOW 100BN IN 2020
Across the major Asia Pacific gateway markets, real estate investment volumes declined from 2019’s record high. Activity for the year ended at $91 billion, about 30% below 2019 levels. It was also the first time since 2012 that volumes fell below $100 billion. Despite the overall declines, there were some stand out performers where occupier markets and capital markets remained supportive, notably Seoul office and logistics, where volumes increased by 37% and 48% year-on-year, respectively.
SHIFT IN SECTOR PREFERENCES
The pandemic accelerated demand for logistics and alternative sectors like data centers and caused significant disruption for others like hotel and retail. There was also a similar, but less pronounced disruption in office. The volume of hotel and retail sales fell the most, down 55% and 50% year-on-year respectively, while the volumes of office transactions fell by 29%. Meanwhile, the liquidity in industrial /logistics remained high, with a mild 8% decline in the year and the volumes of sales in the alternative sectors (data centers, cold storage etc.) doubled from 2019. Despite the shift in investor preferences, on an aggregate level, offices remain the most liquid asset class due to size and stock available for investment.
CROSS BORDER CAPITAL REMAINED ACTIVE IN 2020
Despite the challenges linked to travel and in-person meetings, cross-border capital remained active, making up about 28% of all transactions in 2020. This was roughly in line with the proportions recorded between 2015 and 2019. Alongside the use of technology for virtual site visits and deal negotiations, most large investors of the region have teams on the ground across the various markets and were able to continue to execute. This contrasts with the conditions from the Global Financial Crisis, where the proportion of cross border capital more than halved in the subsequent year. For 2020, about 50% of cross-border capital was from within Asia Pacific, while about 33% and 17% were by institutions with headquarters based in North America and Europe respectively.
LOW RATES KEEP INVESTORS IN SEARCH FOR HIGHER YIELDS
Given the expectation for monetary policy to remain loose in the near-term, we expect the lower for longer interest rate environment to persist. Substantial capital looking to invest in real estate and the strong fundraising environment gives hope for a rebound in transaction volumes in 2021. Expectations are for investment volumes to increase by 10% to 20% year-on-year in 2021. In this environment we expect cap rate compression to continue for key sectors like logistics, multifamily and office.
CUMULATIVE TRANSACTION ACTIVITY
2016 TO 2020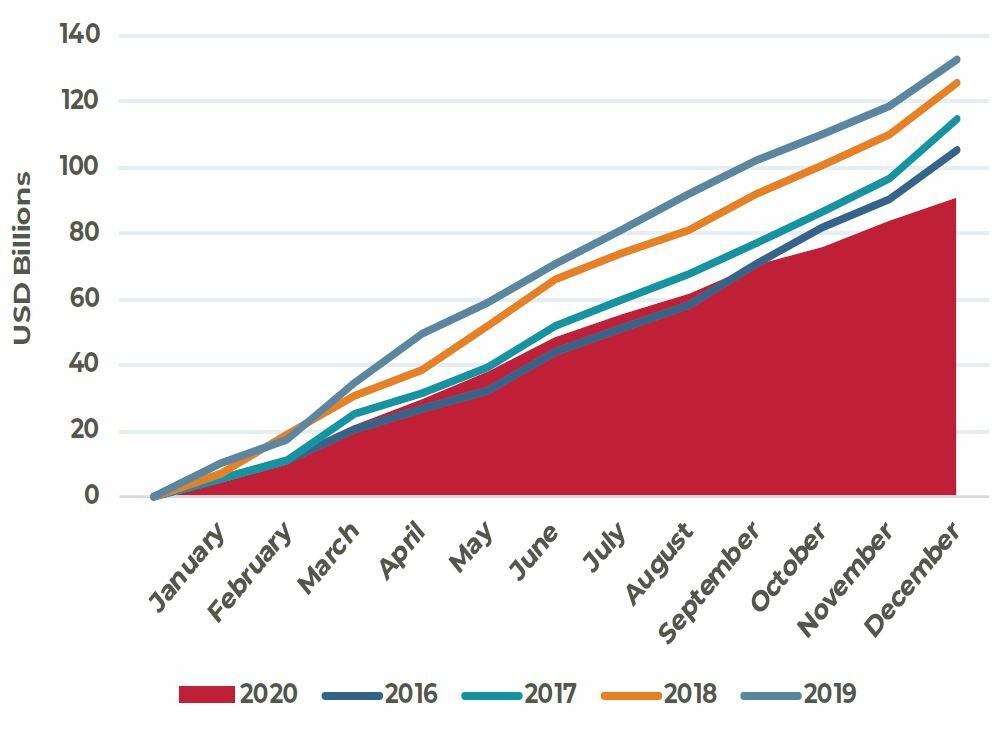
SECTOR BREAKDOWN
2015 TO 2020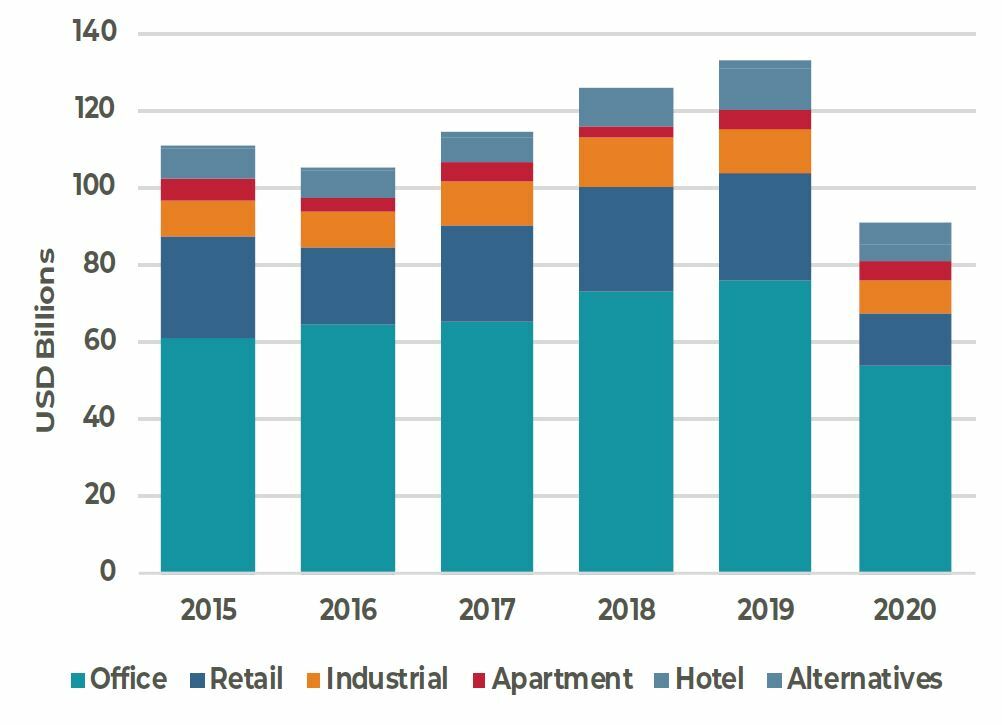
PROPORTION OF CROSS BORDER CAPITAL
2008 TO 2020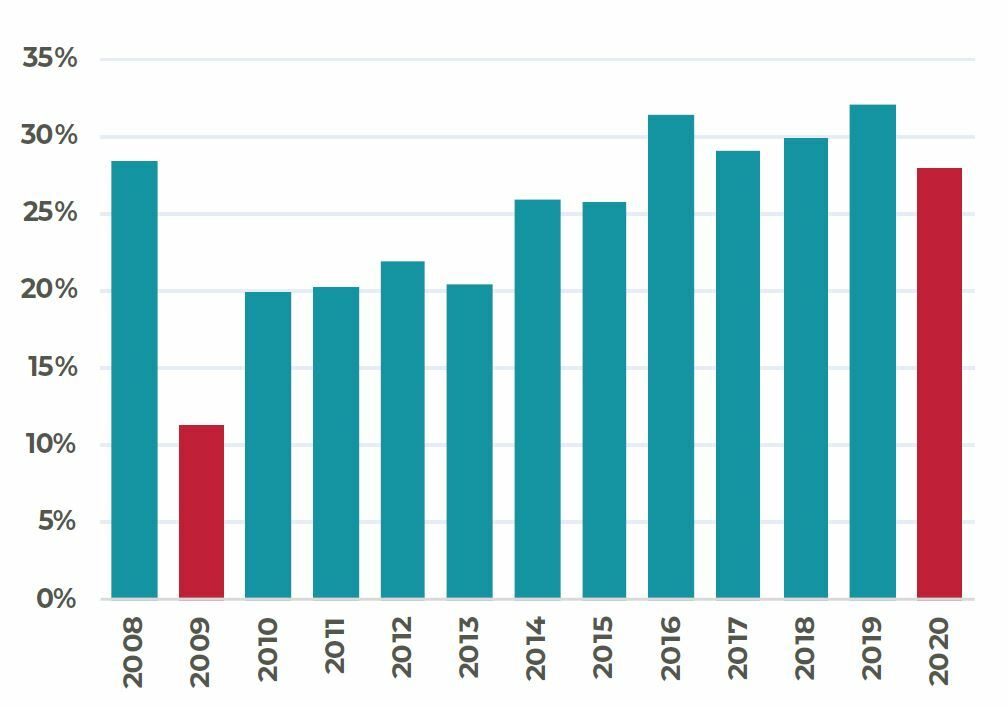
Source: RCA, as of Q4 2020
Note: Transaction volumes in charts above include only income producing assets in the following markets: Beijing, Brisbane, Hong Kong, Melbourne, Osaka, Seoul, Shanghai, Singapore, Sydney and Tokyo
For more information, please contact:
GLYN NELSON
Director of Research, Asia Pacific
glyn.nelson@aew.com
+65.6303.9016
HANNA SAFDAR
Research Associate, Asia Pacific
hanna.safdar@aew.com
+65.6303.9014
ANNA CHEW
Investor Relations, Asia Pacific
anna.chew@aew.com
+852.2107.3511
This material is intended for information purposes only and does not constitute investment advice or a recommendation. The information and opinions contained in the material have been compiled or arrived at based upon information obtained from sources believed to be reliable, but we do not guarantee its accuracy, completeness or fairness. Opinions expressed reflect prevailing market conditions and are subject to change. Neither this material, nor any of its contents, may be used for any purpose without the consent and knowledge of AEW.