COVID-19 TO RESTRICT FUTURE OFFICE SUPPLY
- As a result of the Covid-19 pandemic, occupiers are reassessing their needs for office space as working from home has been implemented. On the back of the 2020 GDP decline, we forecast prime office rents to come down by nearly 10% this year. So far, in 2020 Q2 take-up is down over 20% and vacancy has ticked up by 20 bps from a record low of 5.4% in Q1 2020.
- While others are mostly focused on the demand side impact, few are considering the supply side of the market too. In previous reports we have noted that oversupply of new space has exacerbated previous market downturns. In this latest Covid-19 update, we take a closer look at the impact of the pandemic on the latest supply pipeline data.
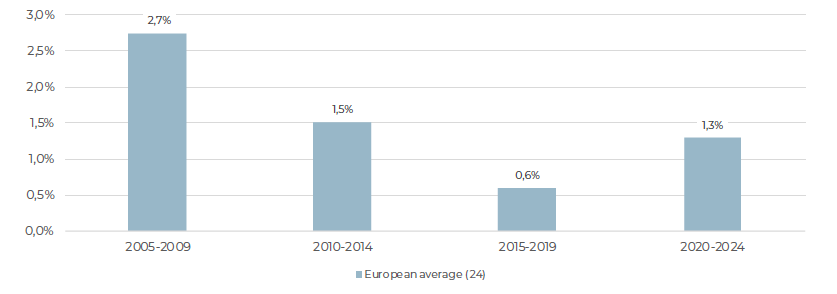
- The good news is that expected new supply remains at less than half the level seen pre-GFC. For the 2020-24 period we project the European office stock to grow by 1.3% per annum relative to the pre-GFC period at 2.7% per annum.
- In addition, JLL has estimated a decline of 9% in 2020-22 supply across 15 markets since the start of 2020, mostly as a result of Covid-related delays in construction due to the health and sanitary measures and material shortages.
- Furthermore, development focused land and redevelopment acquisitions as a share of total office acquisitions, have continued their long term downward trend.
- Post-GFC lending regulations have limited banks from committing to speculative development projects, despite a recent uptick in 2018 in Germany. Based on more recent data, we expect that post Covid-19 conditions will further tighten finance availability and terms for office development.
- As investors, developers and lenders come to grips with lower occupational demand. We also expect that many office developments will be postponed, downscaled or cancelled over time. This will further reduce the new supply across markets.
- Nevertheless, some Central and Eastern Europe (CEE) markets, Dublin and Barcelona face large supply pipelines. Construction is also picking up in Amsterdam, Lyon, Berlin and Munich, but these markets are protected by record low vacancy rates below 4%.
- In the largest European office market, Paris, we highlight that based on our in-house database, the pipeline is significantly larger than indicated by CBRE. The new office pipeline for Paris is mostly concentrated in La Défense and inner rim sub-markets.
EUROPEAN OFFICE STOCK GROWTH EXPECTED TO REMAIN MODEST IN 2020-2024 (% per annum - 24 MARKETS)
Sources: CBRE, AEW Research & Strategy
STRONG MARKET FUNDAMENTALS AT THE START OF THE COVID-19 PANDEMIC
COVID-RELATED DEMAND SHOCK HITS PRIME OFFICE RENTS BY NEARLY 10% IN 2020
- As a result of the Covid-19 pandemic, demand for office space is expected to slow down sharply in the short-term as occupiers adopt a wait-and-see approach and reassess their office space needs. Some industries which have been directly impacted – such as transport, tourism, events and retail – are also trying to cut their costs to remain profitable.
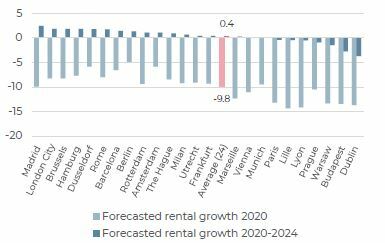
- We expect a significant decline in prime office market rents in 2020, of 9.8% on average across Europe (24 markets covered). All European markets are expected to see their prime market office rents decrease this year. Incentives are also likely to rise.
- Nevertheless, this demand shock is expected to be short-lived and prime office rents are forecast to start recovering from 2021, offsetting the 2020 decline in most markets. Prime office rental growth is expected to reach 0.4% per annum over the 2020-2024 period.
Prime office rental growth forecasts (%, per annum)
Sources: CBRE, AEW Research & Strategy
VACANCY TICKS UP FROM RECORD LOW AS COVID DRIVES TAKE-UP DOWN
- The European office market benefited from strong fundamentals at the onset of the Covid-19 pandemic with record high office take-up above 12 million sqm recorded in 2018-19 and an historically low vacancy rate of 5.4% at Q1 2020.
- The impact of the Covid-19 crisis on office demand can already be felt. European annual office take-up fell significantly to 9.5 million sqm in Q2 2020, a 21% decrease compared to last year, a similar drop as in Q1 2009 - at the beginning of the Global Financial Crisis.
- Consequently, the European vacancy rate increased by 20 bps to 5.6% during Q2 2020. Nevertheless, the level of vacancy remains significantly lower than at the beginning of the previous market downturn, when the European vacancy rate was around 200 bps higher than today.
European annual office take-up (‘000 sqm) & vacancy rate (%, right)
Sources: CBRE, AEW Research & Strategy
VACANCY VARIES, WITH GERMANY LOWEST AND SOUTHERN MARKETS HIGHEST
- The impact of the Covid-19 pandemic can be seen in a number of European office markets where net absorption decreased in Q1 and Q2. This is notably the case in the City of London where the vacancy rate increased by 270 bps from Q4 2019 to 6.6%, and also in Dublin and Budapest.
- Some European office markets have very low levels of vacancy such as the German markets of Berlin, Hamburg and Munich, as a result of planning policies putting a stronger emphasis on residential. These tight restrictions will allow German markets to better weather the Covid-related demand shock.
- In contrast, Southern European office markets such as Milan, Madrid and Rome and CEE markets of Warsaw and Budapest have the highest levels of vacancy in Europe.
- Rotterdam and The Hague’s vacancy rates had long been some of the highest in Europe, but recent conversions of obsolete office space to residential has led to a decrease in vacancy, even during Q2 2020.
Vacancy rate (%)
Sources: CBRE, AEW Research & Strategy
LIMITED OFFICE SUPPLY RISK WITH DIFFERENCES ACROSS MARKETS
2020-24 OFFICE STOCK GROWTH AT LESS THAN HALF 2005-09 LEVEL
- An analysis of the expected office stock growth in Europe (24 markets) over the next five years indicates that stock growth is relatively limited at 1.3% of existing stock per annum.
- This is in sharp contrast with the onset of the previous downturn when the office stock growth reached 2.7% per annum in 2005-2009, which exacerbated the negative impact from the Global Financial Crisis on office demand, leading to sharp market corrections in vacancy and rents.
- Nevertheless, the European office stock growth is accelerating compared to the previous five years (2015-2019), a period of limited completion which explains the strong office rental growth recorded over the past few years.
European office stock growth (% per annum - 24 markets)
Sources: CBRE, AEW Research & Strategy
CEE OFFICE PIPELINE REMAINS RELATIVELY HIGH
- The European average hides significant differences across markets, especially between the mature office markets of Western Europe and the less mature markets of CEE, where office stock growth has been much higher since 2005. The number of office markets covered is specified in brackets.
- The chart also highlights the significant construction activity in Spain and Benelux in the pre-GFC period. The perhaps surprising negative stock growth recorded in Benelux in 2015-2019 is due to the expansive conversion programme of office space to residential use in the Netherlands.
- The limited supply pipeline expected in UK and in Italy means that these markets will not face a double demand and supply shock in the coming years.
Office stock growth by country/region (%, per annum)
Sources: CBRE, AEW Research & Strategy
SUPPLY REACTION TO BE EXPECTED IN TIGHT OFFICE MARKETS
- Zooming in further to the individual market level, this chart represents the future supply pipeline as a percentage of the existing office stock, in each market. Only development or significant refurbishment schemes under construction are considered in the analysis, as some projects might be delayed or cancelled.
- On average across Europe, future supply expected in 2020-2024 represents 6% of the existing office stock. The CEE markets again stand out as the most active, followed by Dublin – a market known for its volatile supply cycles.
- The office markets of Amsterdam, Lyon, Berlin and Munich should experience significant construction activity, but this is mostly a reaction to their historically low levels of vacancy. The oversupply risk is therefore limited in these markets.
- The Dutch office markets of The Hague, Rotterdam and Utrecht should experience a decrease in their office stock as a result of further conversions to residential use.
Future supply expected in 2020-24 as % of stock & vacancy rate (%, right)
Sources: CBRE, AEW Research & Strategy
SUPPLY PIPELINE REVISED DOWNWARD AS A RESULT OF THE COVID-19 PANDEMIC
SUPPLY PIPELINE ESTIMATION IS NOT AN EXACT SCIENCE
- Comparison of the latest data on new office supply across the European markets shows inconsistency among sources, as evidenced by the comparison of the European office pipelines estimated by CBRE and JLL.
- According to JLL, future office supply in Europe represents 2.2% of the total office stock, on average per annum over the next three years – compared to CBRE’s consistently lower estimate of 1.4% per annum.
- This can be largely explained by the challenges in tracking smaller development schemes, as well as identifying projects that are under construction, ready to start (with building permits) or still waiting for approval.
- The difficulties in identifying which schemes have been postponed, downsized or cancelled altogether also explain the differences between brokers. Detailed knowledge of the developer’s financing and funding position is needed and varies by market.
Future supply as % of European office stock (% – 15 markets)
Sources: CBRE, JLL, AEW Research & Strategy
SUPPLY PIPELINES REVISED DOWN AS COVID-19 HITS CONSTRUCTION
- It is too early to measure precisely the long term impact of the Covid-19 pandemic on the office supply pipeline.
- But, a comparison of the pipeline at the end of 2019 and mid-year 2020 gives a first signal, although not all changes might be Covid-19 related.
- The direct impact from the prolonged Covid-19 lockdowns has been on construction works, which have been disrupted as sanitary measures lower labor productivity and supply chains for crucial building materials also remain disrupted.
- Overall in Europe, JLL’s supply pipeline has been revised downward by almost 9% since December 2019, with more significant declines recorded in Munich, Hamburg, Madrid, Dublin and Barcelona.
- Office supply pipelines have nevertheless increased in some markets since December, notably in Stockholm and Milan.
Change in office supply pipeline 2020-2022 between Dec 2019 & June 2020
Sources: JLL, AEW Research & Strategy
DEVELOPMENT FOCUS HAS BEEN TRENDING DOWN FOR LAST EIGHT YEARS
- If we accept the share of development related deals (like land acquisitions and re-developments) in total volumes invested in offices across Europe as an early indicator of oversupply risk, we note that it has been trending downwards since 2012, with the lowest point reached in 2018.
- The chart also highlights the drop in office investments in Q2 2020, a direct consequence of the Covid-19 pandemic despite record amounts of dry powder ready to be invested in real estate at the beginning of the year (€73 bn in Europe according to INREV).
- Anecdotal evidence also highlights weaker investor’ appetite for office development or investments requiring immediate capex, due to fears of construction works being delayed as a direct consequence of the sanitary measures.
- This adds to the general risk-off attitude of many institutional investors, who are moving down the risk curve as they come to grips with the impact of Covid-19 on their holdings.
Development deals as % (right) of total European office investment volumes (€ bn, left)
Sources: RCA, AEW Research & Strategy
POST-GFC REGULATIONS & COVID-19 TO FURTHER LIMIT DEVELOPMENT LENDING
DEVELOPMENT FINANCING CONDITIONS LIKELY TO TIGHTEN
- Office development activity is closely linked to the ability of investors and developers to access development finance. The banking regulations introduced after the GFC have led to tighter financing conditions, especially for speculative development.
- The Cass and IREBS surveys on the UK and German real estate debt markets have been tracking the share of developments as a % of total loan books. In the UK, developments represented 12% of total loan books in 2019, in line with the historic average. This is however, higher than the 9% figure recorded in 2014.
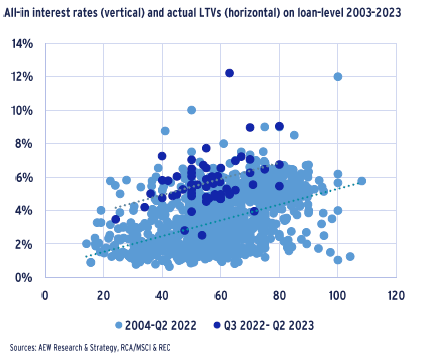
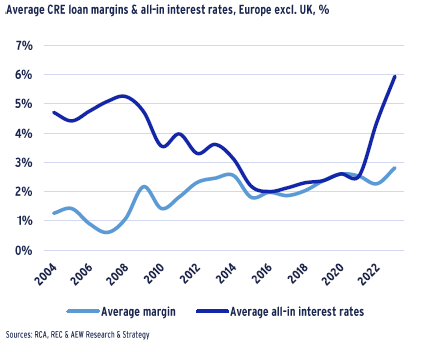
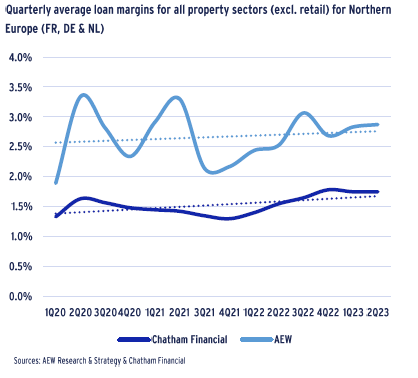
- In Germany, the share of developments has been increasing to reach 16% in 2018 (last data point available). However, the latest JLL/ZEW DIFI survey indicates that average LTV to finance German value-add offices has dropped from 66% in 2019 to 63% in 2020 as a result of the Covid-19 crisis, while the average margin has increased by 36 bps in 2020.
- Post Covid-19, financing conditions for development projects will likely tighten further as a consequence of the risk-off approach of lenders.
Share of developments as % of total annual loan originations
Sources: Cass, IREBS, JLL/ZEW DIFI, AEW Research & Strategy
SPECULATIVE SUPPLY IN PARIS AT NEAR DOUBLE EUROPEAN AVERAGE
- Looking more precisely at the future supply pipeline, we calculated the share of speculative office schemes as opposed to projects that are owner-occupied or already pre-let.
- It is important to note that pre-let schemes also increase overall vacancy as the tenant has very likely moved from an existing building which is then released onto the market.
- Nevertheless, the supply overhang of new space has more significant impact on prime market rents than second-hand space.
- On average in Europe, speculative schemes represent 31% of the total future office supply. The share is the highest in Paris which can be explained by the ability of large French developers to self-finance and the tax-efficient forward funding mechanism. It is also high in the volatile markets of Warsaw and Dublin.
- Smaller, regional office markets tend to have a lower share of speculative developments as their occupier base is not as large as gateway markets.
Share of speculative office supply (% of future supply)
Sources: CBRE, AEW Research & Strategy
STRONG PIPELINES IN LA DÉFENSE & INNER RIM SUBMARKETS
- Looking more precisely at Paris, we have analysed the future supply risk in different office submarkets by using our granular bottom-up data, including smaller schemes. §In the Paris region overall, we expect future supply to be closer to 9% of the existing stock, rather than 5% as estimated for 2020-24 by CBRE and 8% by JLL (in 2020-2023).
- Office submarkets located in central Paris benefit from a very limited supply pipeline due to planning regulation limiting building height and lack of available land (except in Paris 12/13).
- The Paris supply pipeline is concentrated in a limited number of submarkets where regeneration projects and new transport infrastructure such as the Greater Paris project, have encouraged office developments. This explains the significant pipeline in the Northern inner rim market which will benefit from the northern extension of line 14 as well as the 2024 Olympics. La Défense also stands out as a market where large office towers can be built.
Future supply as % of total stock in Paris office submarkets
Sources: CBRE, MBE Conseil, Deloitte, AEW Research & Strategy
OFFICE SUPPLY PIPELINE IN THE GREATER PARIS MARKET
Office supply pipeline in the Greater Paris market, by expected delivery year
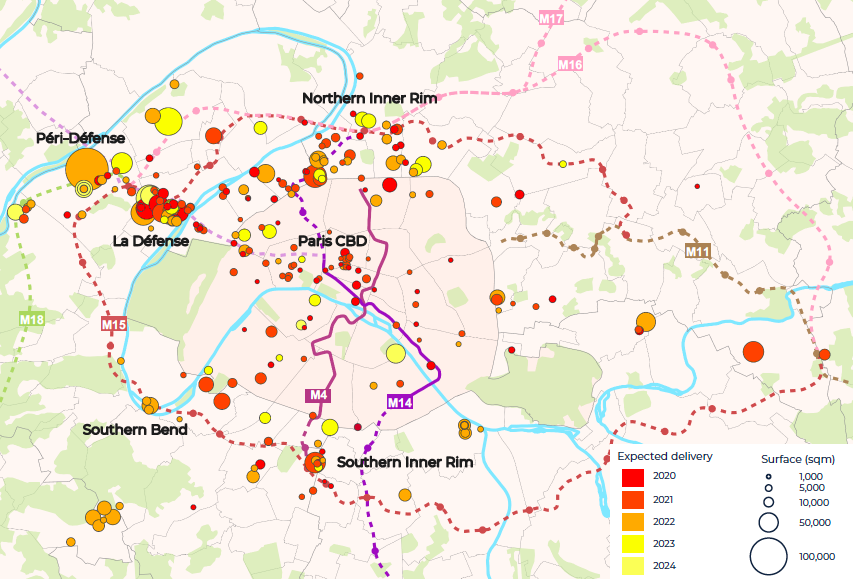
Sources: CBRE, MBE Conseil, Deloitte, AEW Research & Strategy
The Paris office supply pipeline is heavily concentrated in a small number of office submarkets:
- Northern Inner Rim is the most dynamic market in terms of construction activity as large brownfield sites continue to be regenerated to welcome the Olympic Village and other venues for the 2024 Summer Olympics. While the regeneration area of Clichy-Batignolles located at the edge of Paris 17 is reaching the last phase of its development, the markets of Clichy, Saint-Ouen and Saint-Denis are now benefiting from the game-changing northern line extension of driverless metro line 14 with the first stations due to open in December 2020. By 2024, Saint-Denis Pleyel will be one of the major transport hubs of the Greater Paris infrastructure project. However, the concentration of new developments and refurbishment of existing office buildings, in a short period of time, has been difficult to absorb for this market where the vacancy rate was already high. Prime office rental levels are nevertheless attractive at €330/sqm/pa in Saint-Denis and €390/sqm/pa in Saint-Ouen.
- A number of new office towers are expected to be delivered in La Défense over the next five years (“Trinity” – 49,000 sqm in 2020, “Alto” – 51,000 sqm in 2020, “Hekla” – 68,000 sqm 2022) in addition to a number of refurbishments of existing towers such as Landscape – 57,000 sqm. The sanitary measures currently required might complicate the leasing of these new towers in the short-term.
- Péri-Défense has historically been one of the most oversupplied Paris submarkets. This is where the largest office development is expected to be delivered in the Paris region, “Arboretum” (Woodeum / BNP Paribas Real Estate), with 126,000 sqm, due to be completed in December 2022 in Nanterre. This large office campus will be made of solid wood, which explains the short construction period.
- Development activity in the office submarket of Southern Inner Rim is also driven by the improvement to the public transport accessibility with the southern extension of metro line 4.
- Construction activity is also high in the more established Southern Bend submarket – mostly consisting of Boulogne-Billancourt and Issy-les-Moulineaux – but the majority of schemes under development have been pre-let to large office occupiers. This is the case of “Pont d’Issy” let to Orange (54,800 sqm), “Shift” let to Nestlé (45,000 sqm) and “Metal 57” let to BNP Paribas Real Estate (30,670 sqm).
READ THE FULL REPORT
The information and opinions presented in this research piece have been prepared internally and/or obtained from sources which AEW believes to be reliable; however, AEW does not guarantee the accuracy, adequacy, or completeness of such information.
