REIT Performance Across Economic Cycles
By now investors are aware that rising interest rates do not necessarily create adverse conditions for REIT performance. Periods of rising interest rates often coincide, or are caused by, expectations of stronger economic growth, which create positive return dynamic for the sector. We have previously published research on this topic (see our April 2019 article “Rising Interest Rates and REITs”) that looks at REIT performance during the one-year period following interest rates increases by at least 100bps. In this piece, we take a more continuous approach to evaluate the performance of the sector under fluctuating interest rate conditions, both long and short, inflation conditions, and credit profile of the general corporate sector. The long and short interest rates are the US 10yr Treasury Yield and Fed Funds Policy Rate respectively, inflation is CPI growth, corporate sector credit profile is the Moody’s Baa Corporate Bond Spread and MSCI US REIT Index for the sector.
The continuous evaluation applied here is based on daily market movements and ‘neutral expectations’ in that at each point in time future fluctuations in economic conditions are not known; e.g. following a sharp rise (or fall) in interest rates, market participants do not know if rates will continue to rise (or fall), stay broadly flat, or reverse course. All of these scenarios potentially have a different impact on sector performance. Therefore, here we define two-state regimes for the four economic conditions evaluated, either falling or rising. These simple regimes capture all periods of falling and rising e.g. interest rates daily including the magnitude and duration of those fluctuations.
We define the continuous periods as a 90-day moving average for each metric to avoid daily noise. For each rising and falling period respectively we calculate the absolute total return for REITs as well as the relative total return compared to general equities (SP500). In a final step, we eliminate all negligible ‘near zero’ fluctuations keeping only periods for which the move has been larger than +/- 10bps and evaluate correlations of REIT returns to changes in the respective metric. This implicitly captures the ‘duration’ aspect as bigger moves typically happen over longer time periods. We use daily data covering the period from 31 December 1994 to 28 May 2021.
Economic Regimes
Generally, central banks control short-term rates directly which in turn influence long-term rates without direct control. However, in the post-GFC period central banks have also used various asset purchase programs to enhance monetary policy tools with the aim to influence a decline in longer-term interest rates.
Fig1 illustrates the 10yr Treasury Yield along with the continuous 90-day moving average and identified rising and falling interest rate periods. Fig2 shows the periods and total returns when those changes have been more than +/-10bps and Fig3 evaluates correlations of returns.
FIGURE 1: 10-YEAR TREASURY YIELD
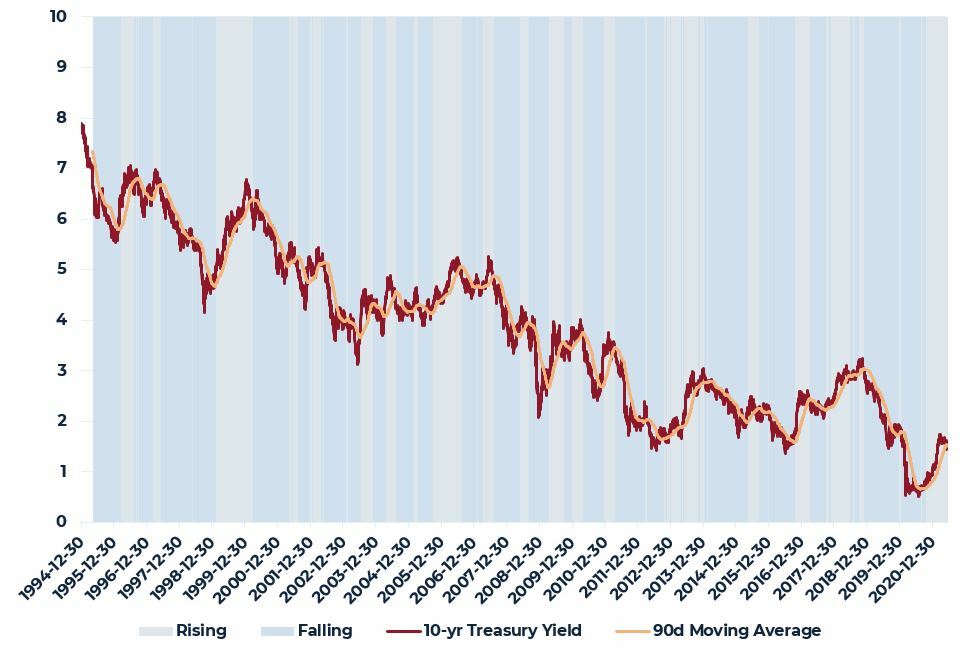
Sources: FRED, Federal Reserve Bank of St. Louis
FIGURE 2: 10-YEAR TREASURY YIELD FLUCTUATIONS AND REIT RETURNS
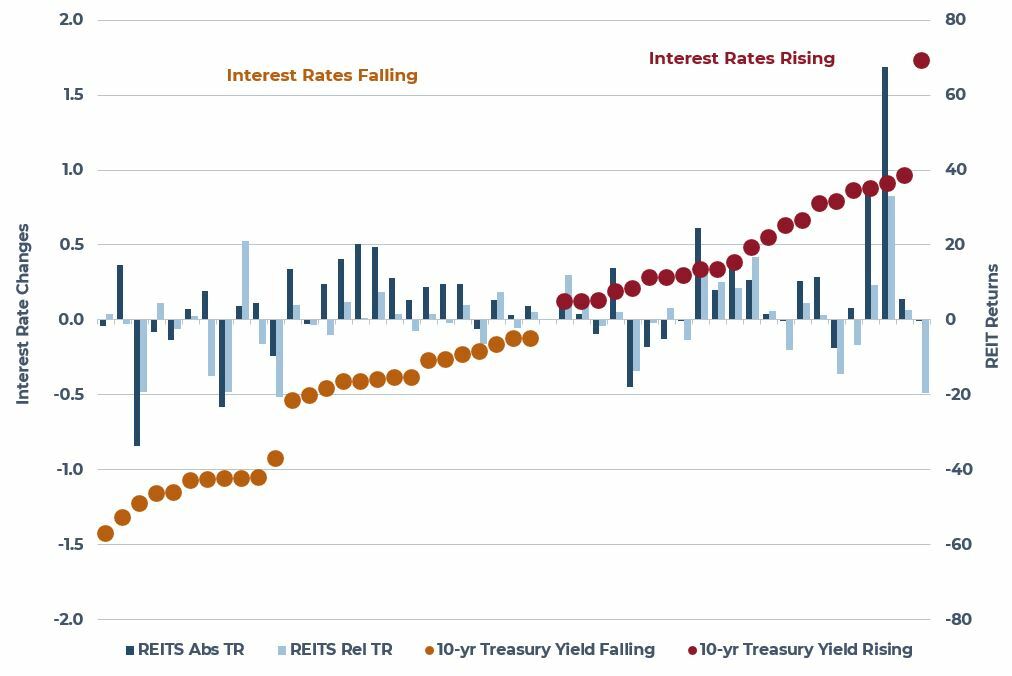
Sources: FRED, Federal Reserve Bank of St. Louis, FactSet
FIGURE 3: CORRELATION TO CHANGES IN 10-YEAR TREASURY YIELD
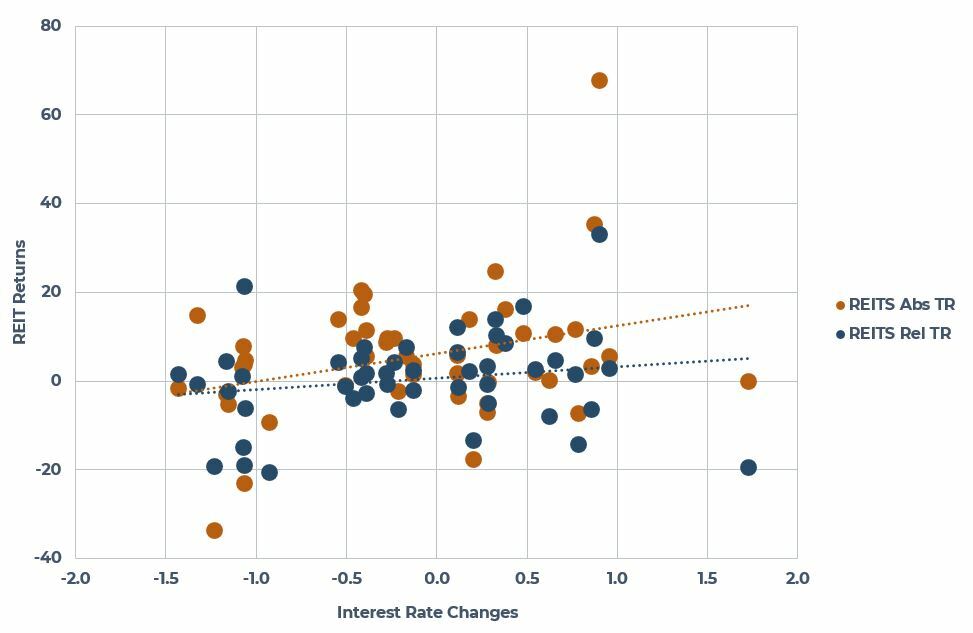
Sources: AEW, FRED, Federal Reserve Bank of St. Louis, FactSet
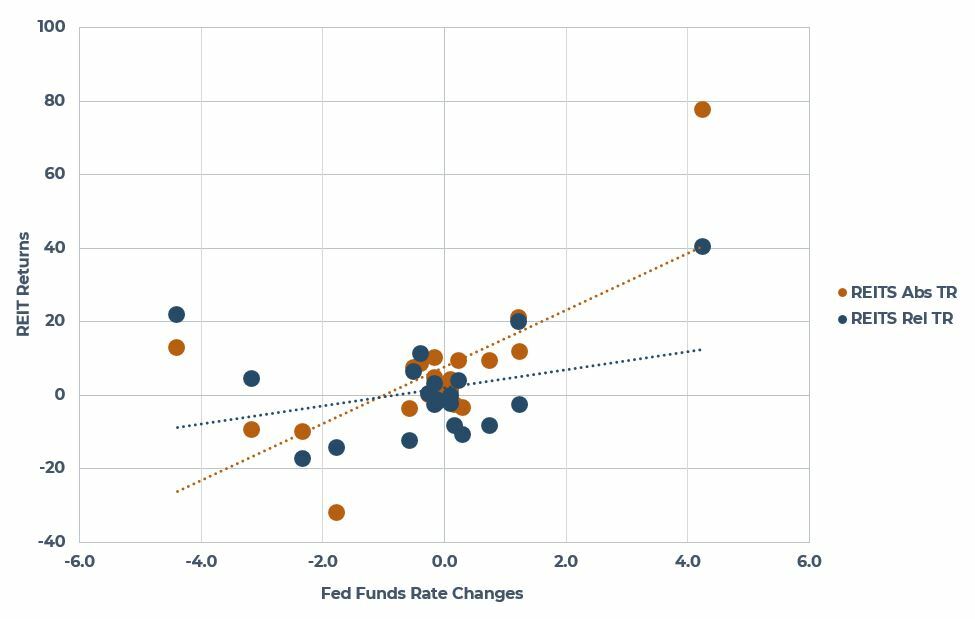
As shown, REIT total returns have been slightly positively correlated to changes in 10yr Treasury Yields both in absolute and relative terms, 0.31 and 0.18 respectively. Looking at changes in Fed Funds Rate in a similar way, correlation becomes significantly stronger and positive as monetary policy typically reflects economic growth and inflation expectations in both directions. Stronger economic growth is of course an important indicator and factor for REIT performance. In Fig4 and Fig5 we can see that REITs have performed well both in absolute terms and relative to general equities in periods of rising policy rates. Correlation to changes in Fed Funds Rate has been 0.67 for absolute returns and 0.32 for relative returns, and higher still in the post-GFC period, at 0.83 and 0.78 respectively.
FIGURE 4: FED FUNDS RATE FLUCTUATIONS AND REIT RETURNS
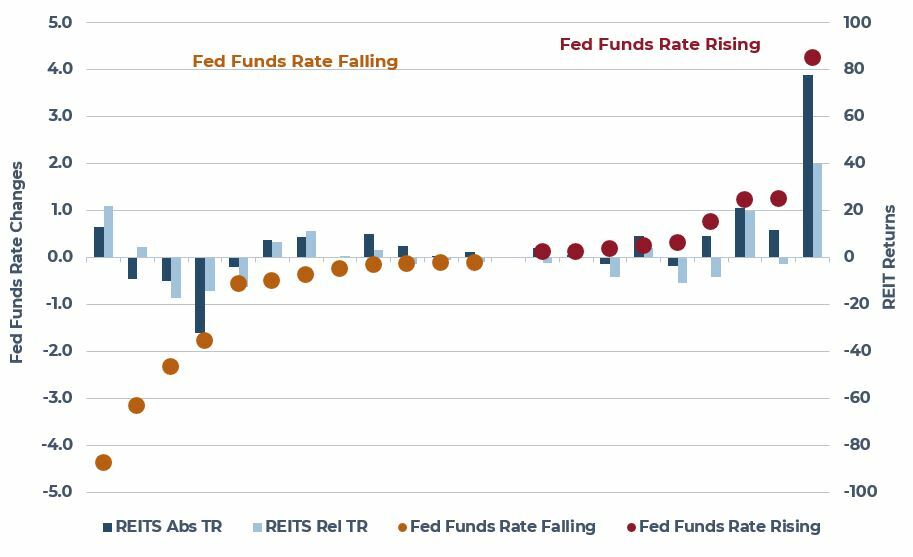
Sources: AEW, FRED, Federal Reserve Bank of St. Louis, FactSet
FIGURE 5: CORRELATION TO CHANGES IN FED FUNDS RATE
Sources: AEW, FRED, Federal Reserve Bank of St. Louis, FactSet
The third metric we evaluate, or economic regime, is Corporate Bond Spreads as those are an implied but direct reflection of tenant default risk through the health of the corporate sector. Corporate bonds spreads incorporate several important aspects such as credit risk, leverage, financing conditions and ultimately default risk. Fig6 illustrates the risk profile of the corporate sector which has been roughly equally distributed with rising credit spread during approximately half (48%) of the time during our evaluation period.
FIGURE 6: CORPORATE CREDIT SPREADS
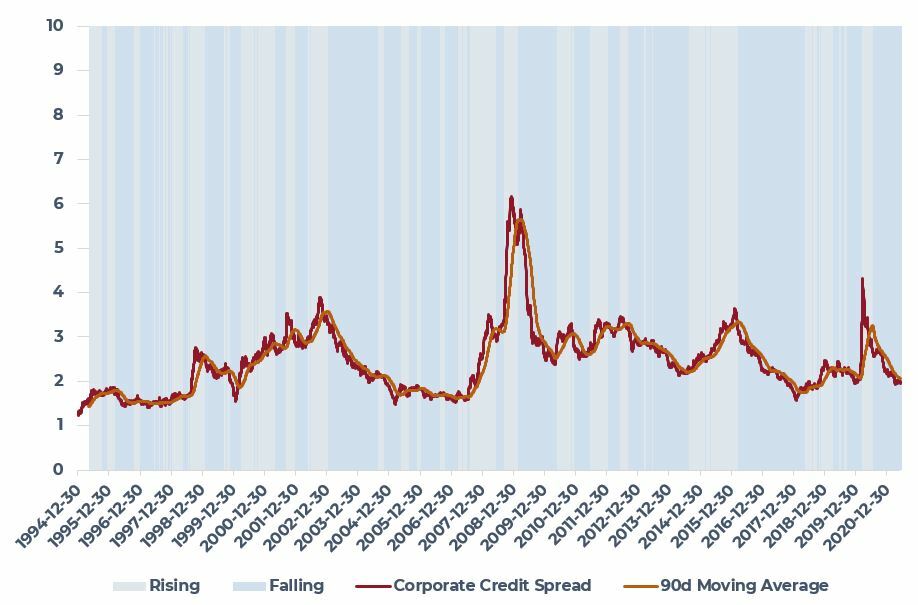
Sources: FRED, Federal Reserve Bank of St. Louis
As shown in Fig7 and Fig8. rising general corporate credit risk is the primary economic regime that creates adverse conditions for REITs both in absolute and relative terms with significant negative correlation of sector performance of -0.83 and -0.53 respectively.
FIGURE 7: CREDIT SPREADS FLUCTUATIONS AND REIT RETURNS
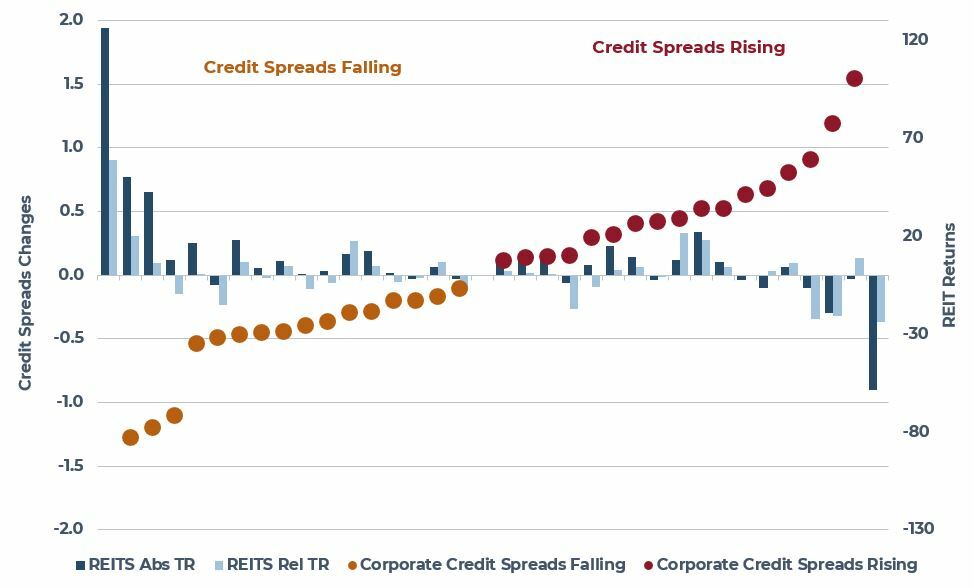
Sources: AEW, FRED, Federal Reserve Bank of St. Louis, FactSet
FIGURE 8: CORRELATION TO CHANGES IN CREDIT SPREADS
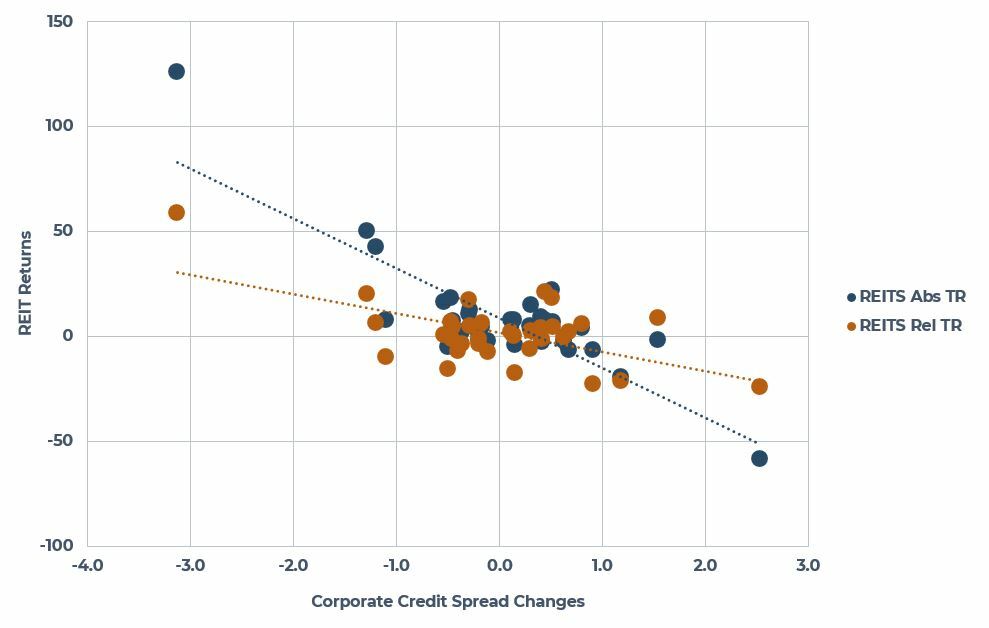
Sources: AEW, FRED, Federal Reserve Bank of St. Louis, FactSet
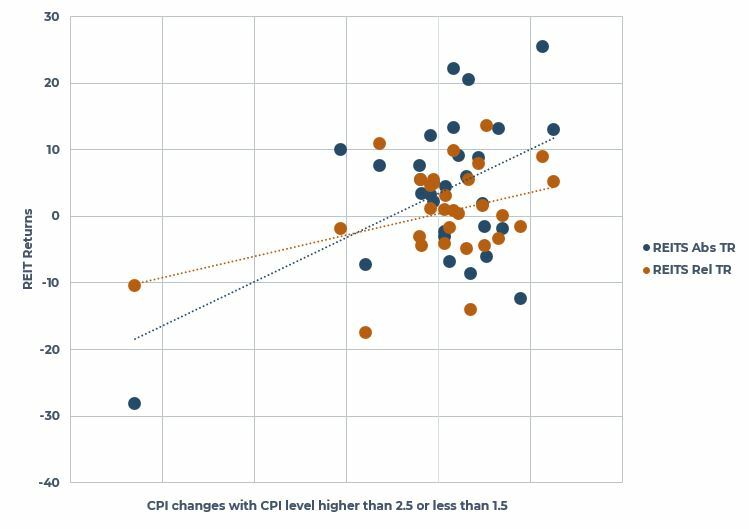
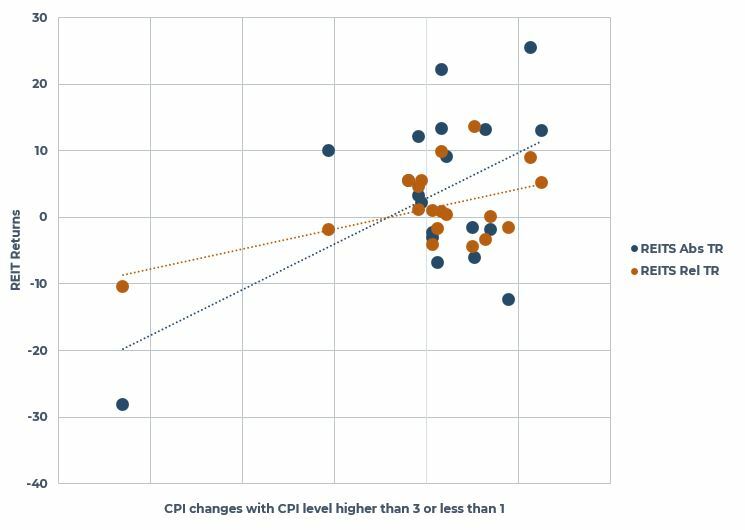
When it comes to inflation, it is likely the impact of changes is not equally distributed and only becomes relevant from a policy perspective with impact on asset pricing once inflation exceeds or falls short of a normal range around target level, i.e. only once inflation starts moving into the ‘tails’. Therefore, we repeat the analysis in a similar way, but exclude normal ranges of inflation in wider steps; first range, Fig9, by eliminating periods when inflation was +/-50bps away from 2%, i.e. looking only at periods when inflation exceeded 2.5% or fell below 1.5%, and second range, Fig10, by eliminating periods when inflation was +/-100bps away from 2%, i.e. looking only at periods when inflation exceeded 3% fell below 1%.
FIGURE 9: CORRELATION TO CHANGES IN INFLATION, NARROW RANGE
Sources: AEW, FRED, Federal Reserve Bank of St. Louis, FactSet
FIGURE 10: CORRELATION TO CHANGES IN INFLATION, WIDE RANGE
Sources: AEW, FRED, Federal Reserve Bank of St. Louis, FactSet
As illustrated, the impact on REIT returns from changes in inflation gets stronger as inflation moves away from typical ranges and more into the tails. For the first range, +/-50bps eliminated, correlation is 0.49 and 0.37 for absolute and relative sector returns respectively and increases for the second wider range, +/-100bps eliminated, to 0.53 and 0.51 respectively.
In summary, in line with our previous research, the results indicate that, in fact, rising interest rates per se, both short and long, do not create adverse conditions for REIT performance. As central banks cannot directly regulate long interest rates and rising short policy rates typically reflect stronger inflation expectations through expectations of stronger economic growth, REITs tend to perform well during environments of rising interest rates. This is also the case with fluctuations in inflation that also reflects economic growth conditions. This holds as long as rising interest rates do not create broad adverse credit conditions in the corporate sector with negative impact on the actual or perceived health of corporate tenants and the overall default cycle.
This material is intended for information purposes only and does not constitute investment advice or a recommendation. The information and opinions contained in the material have been compiled or arrived at based upon information obtained from sources believed to be reliable, but we do not guarantee its accuracy, completeness or fairness. Opinions expressed reflect prevailing market conditions and are subject to change. Neither this material, nor any of its contents, may be used for any purpose without the consent and knowledge of AEW.