The Fed Moves the Goal Posts
In a speech at the Jackson Hole summit on August 27th, Federal Reserve Chairman Powell announced new and significant changes to U.S. monetary policy, specifically with respect to the Fed’s dual mandates of full employment and price stability. With respect to employment, Powell disclosed that “our policy decision will be informed by our ‘assessments of the shortfalls of employment from its maximum level’ rather than by ‘deviations from its maximum level’” and that this “reflects our view that a robust job market can be sustained without causing an outbreak of inflation”.1 Previously, Fed policy was driven by a much stricter adherence to the Phillips Curve theory that tight labor markets lead directly to higher inflation.
On inflation itself, Powell said that the Fed’s policies will “seek to achieve inflation that averages two percent over time. Therefore, following periods when inflation has been running below two percent, appropriate monetary policy will likely aim to achieve inflation moderately above two percent for some time”. Previously, the Fed was expected to act quickly when inflation rose above this level. Strict adherence to a two percent inflation threshold has, however, resulted in inflation expectations falling steadily below this level. Afterall, if inflation is never allowed above two percent, the average inflation rate, over time, will be below two percent, as has been the case since the last recession ended in the middle of 2009.
1 August 27, 2020. “New Economic Challenges and the Fed's Monetary Policy Review”. Chair Jerome H. Powell. At "Navigating the Decade Ahead: Implications for Monetary Policy," an economic policy symposium sponsored by the Federal Reserve Bank of Kansas City, Jackson Hole, Wyoming
ACTUAL INFLATION VS. TWO PERCENT TARGET
CONSUMER EXPENDITURE PRICE DEFLATOR
2009 Q2 = 100
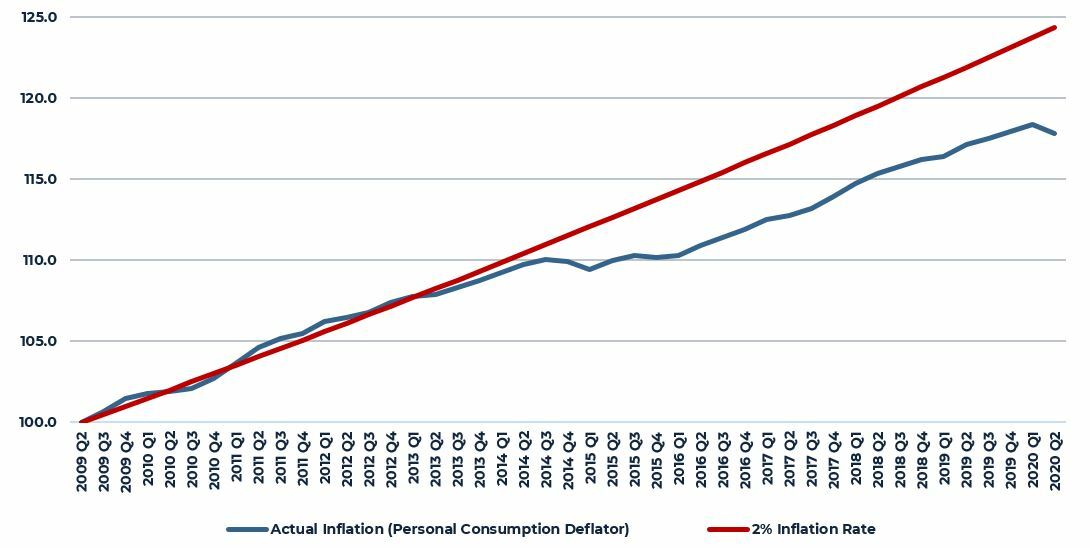
Source: Federal Reserve Bank of St. Louis
Can We Have Higher Inflation with Money Velocity Collapsing?
- Money velocity is simply the number of times that the same unit of currency (i.e. a dollar) is used to purchase goods or services in a given time period.
- Holding everything else constant, higher money velocity is associated with higher growth and higher inflation and lower velocity is associated with lower growth and lower inflation.
- Money velocity in the U.S. was relatively stable in the post-war period until the 1990s where it increased to record levels corresponding with a prolonged period of above trend growth.
- Since the end of the 1990s, money velocity has been generally declining with specific sharp downturns during the financial crisis and now during the pandemic induced economic collapse.
- Sustained higher inflation is unlikely in this environment. Rather, the risk of additional dis-inflation or even outright deflation remains more likely even with the current extraordinary growth in the money supply.
MONEY VELOCITY ($ output per unit of currency)
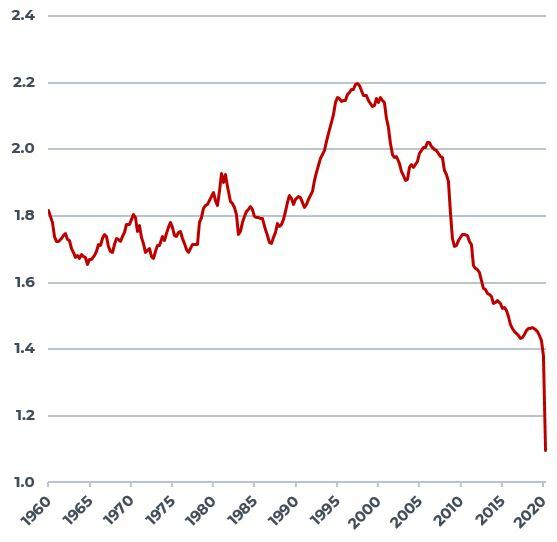
Source: Federal Reserve
Bond Market Inflation Expectations Remain Muted
- Despite enormous expansion of the monetary base, bond market inflation expectations remain low as reflected by pricing of inflation indexed bonds (TIPs) and non-index bonds.
- Regular surveys of FOMC members suggest that the Fed does not believe inflation will exceed their 2% target for the foreseeable future.
EXPECTED INFLATION OVER THE NEXT FIVE YEARS AND THE FOLLOWING FIVE YEARS
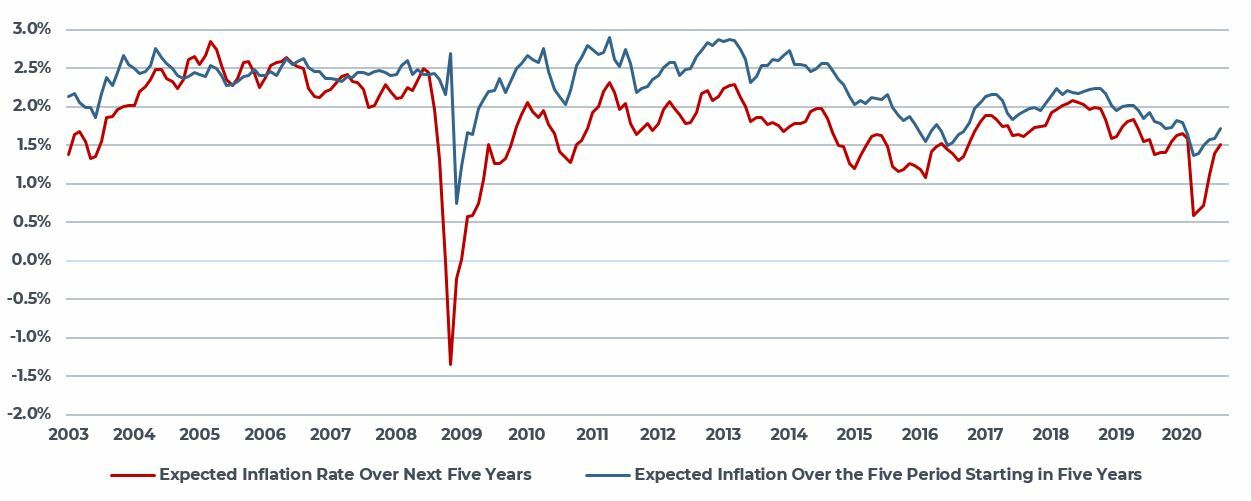
Source: Federal Reserve, Treasury
Consumer Survey Inflation Expectations Also Remain Muted
The Federal Reserve Bank of Cleveland’s monthly consumer survey also indicates inflation staying low for the foreseeable future.
EXPECTED INFLATION OVER THE NEXT FIVE YEARS AND THE FOLLOWING FIVE YEARS
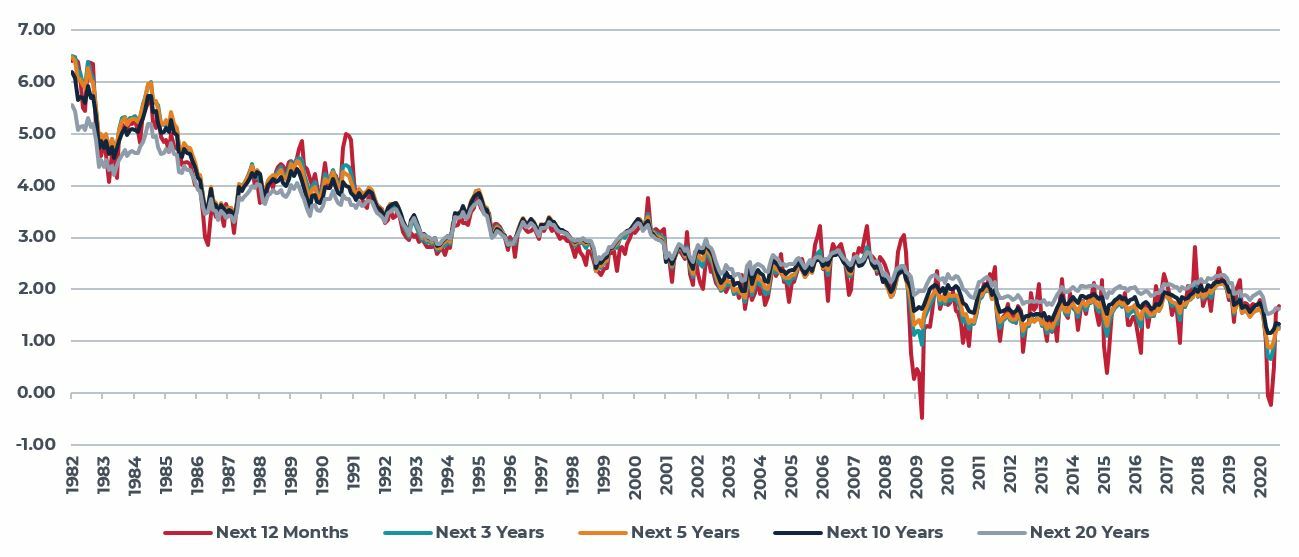
Source: Federal Reserve, Bank of Cleveland
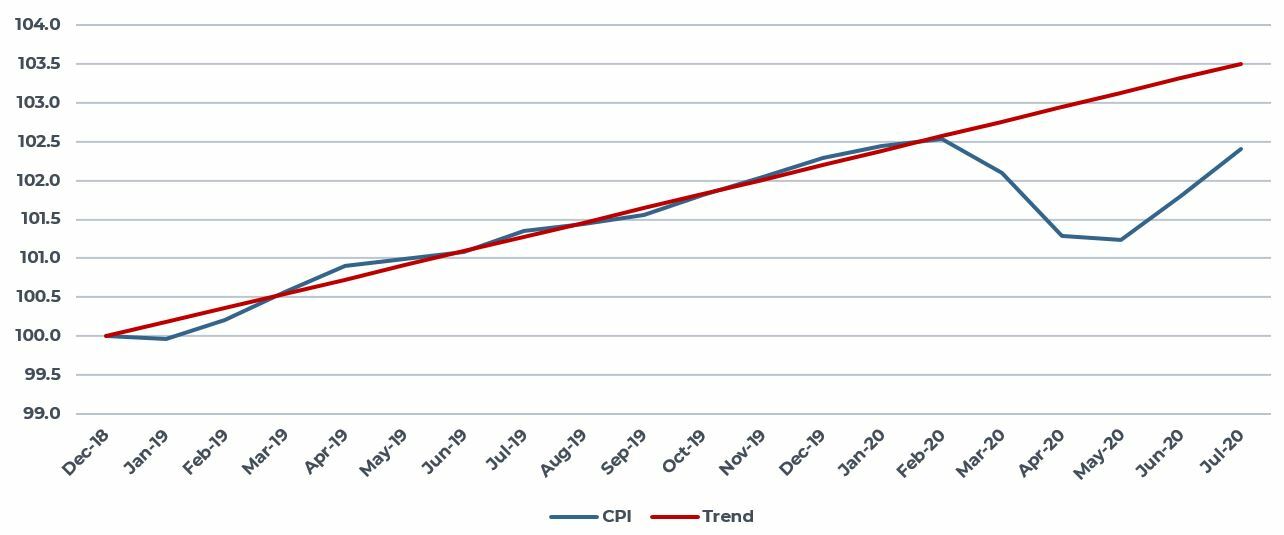
What We Are Experiencing Today is Reflation Not Inflation
The U.S. Consumer Price Index fell at an annualized rate of more than 14% between February and May as the COVID-19 induced economic shutdown led to an annualized decline in Q2 real GDP of nearly 33%. During June and July, prices increased at an annual rate of 7% per month, leaving the overall CPI still well below trend (and the trend growth rate was slightly above 2% pre-pandemic).
CONSUMER PRICE INDEX (CPI)
DECEMBER 2018 = 100
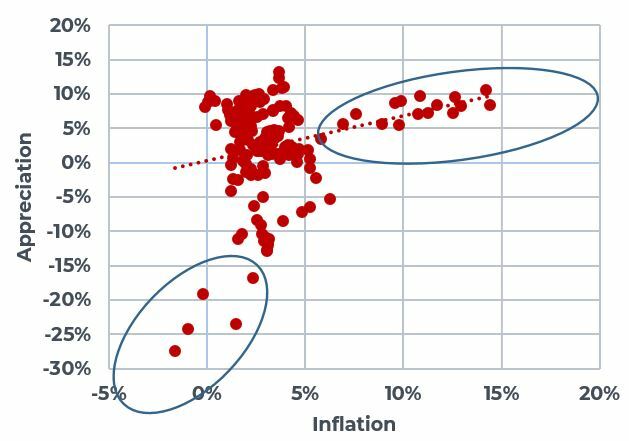
Real Estate and Inflation
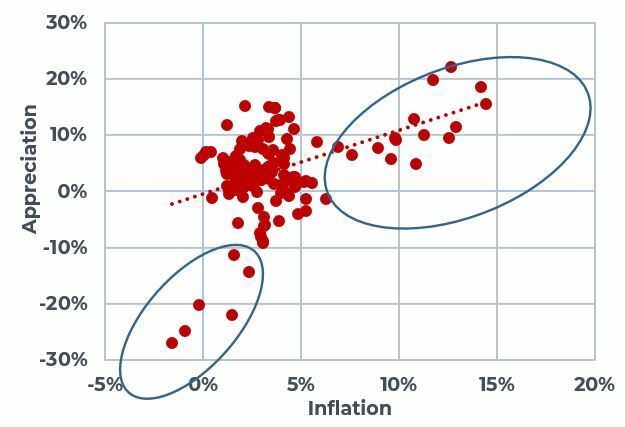
Given the current weakened state of the U.S. economy and the rapid decline in money velocity, we do not expect rapid near-term acceleration in inflation. Rather, the downside risk of slowing inflation and deflation remains elevated. History does warn us, however, to guard against inflation complacency. Property has provided inflation protection in prior inflationary periods. In each of the four charts, we are showing year-over-year property capital appreciation versus year-over-year consumer price inflation since the beginning of the NCREIF Property Index in 1978. Across all four property types, periods of extreme inflation (e.g. inflation above 5%) is accompanied by higher levels of capital appreciation. This higher inflation occurred between 1978 and 1982 and the correlation of inflation to property appreciation is markedly higher during this period. Overall, industrial and office properties were shown to have the greatest correlation between inflation and appreciation during periods of high inflation while apartment properties appear to have the strongest correlation during all time periods.
APARTMENTS AND INFLATION
Year-Over-Year Capital Appreciation and Inflation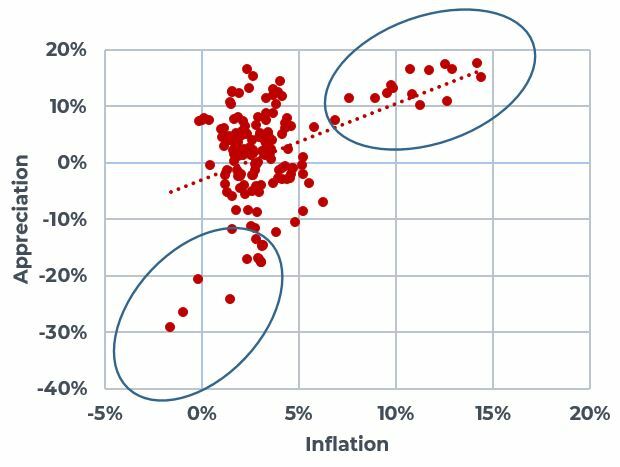
INDUSTRIAL PROPERTIES AND INFLATION
Year-Over-Year Capital Appreciation and Inflation
OFFICE PROPERTIES AND INFLATION
Year-Over-Year Capital Appreciation and Inflation
RETAIL PROPERTIES AND INFLATION
Year-Over-Year Capital Appreciation and Inflation
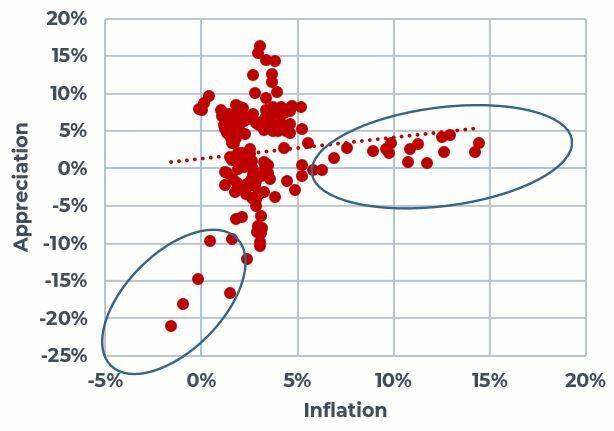
Sources: NCREIF and Bureau of Labor Statistics
This material is intended for information purposes only and does not constitute investment advice or a recommendation. The information and opinions contained in the material have been compiled or arrived at based upon information obtained from sources believed to be reliable, but we do not guarantee its accuracy, completeness or fairness. Opinions expressed reflect prevailing market conditions and are subject to change. Neither this material, nor any of its contents, may be used for any purpose without the consent and knowledge of AEW.
