MOST RECENT DATA SUGGESTS LENDERS’ “RISK-OFF” ATTITUDE
- Debt used to fund new real estate acquisitions was €129bn for 2020. This is down by 15% from 2019 due to the Covid-19 lockdowns. Across the entire European market, the average annual acquisition LTV remained at under 50%.
- The latest 2021 EPRA and INREV portfolio loan-to-value ratios (LTV’s) returned to their year-end 2019 levels and remain also well below their 2008-09 record levels, confirming the trend seen when considering only acquisitions.
- Our updated loan-level database shows average margins for mid-year 2021 at 2.7%, their highest levels since 2003 continuing their upward trend. Given the near zero level of base rates, all-in interest rates remained stable below 3%.
- All-in UK rates remained stable while non-UK rates increased more in 2021 than in 2020, which is likely to be a delayed impact from Covid-19 as closed loan margins are typically finalised well after they were first offered.
- Retail loan margins remain elevated in the post-Covid period, albeit less than expected. The lowest average margins are recorded for logistic and industrial collateral loans.
- Most interestingly, our latest data reveals that margins by LTV loan buckets have been impacted by the pandemic, as there were no loans at all recorded with LTV’s above 80% post 2019.
- This suggested “risk-off” attitude from lenders was further confirmed by the average margin for 70-79% LTV loans reported up by 150 bps while below 50% LTV loan margins remained relatively flat, as shown in the chart below.
- Despite this logical reaction from lenders in the post-Covid market, the additional post-2019 loan data available did not improve our previously presented model’s ability to predict loan pricing.
Margin per LTV Bucket 2010-2019 vs 2020-2021
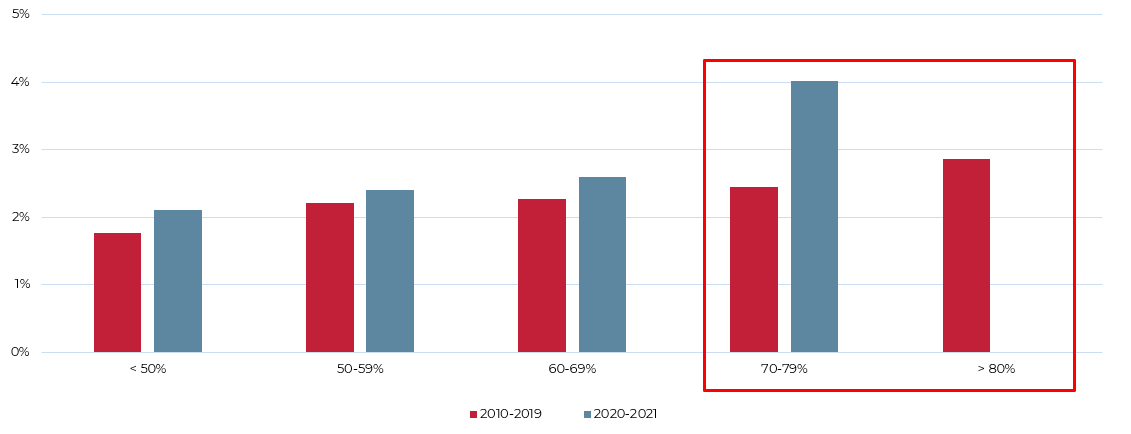
Sources: RCA, REC & AEW Research
ACQUISITION LOAN FUNDING WAS DOWN 15% DUE TO COVID
- Based on our latest data and estimates, debt used to fund new acquisitions came down by 15% from 2019 to €129bn in 2020 due to the Covid-19 lockdowns.
- Across the entire market, the total amount of debt over acquisition volumes (or LTV) remains at historically safe levels below 50%. This is well below the 2007 pre-GFC record level.
- Demand for debt finance remains low due to abundant equity capital, historically low initial property yields and continued caution and conservatism amongst borrowers.
- Supply of bank debt might have also been hampered by the wide range of new regulations triggering.
- This has also increased the focus on funding by non-bank lenders through syndication of bank loans and bilateral lending.
Annual Loan Origination for Acquisitions with market-wide LTV
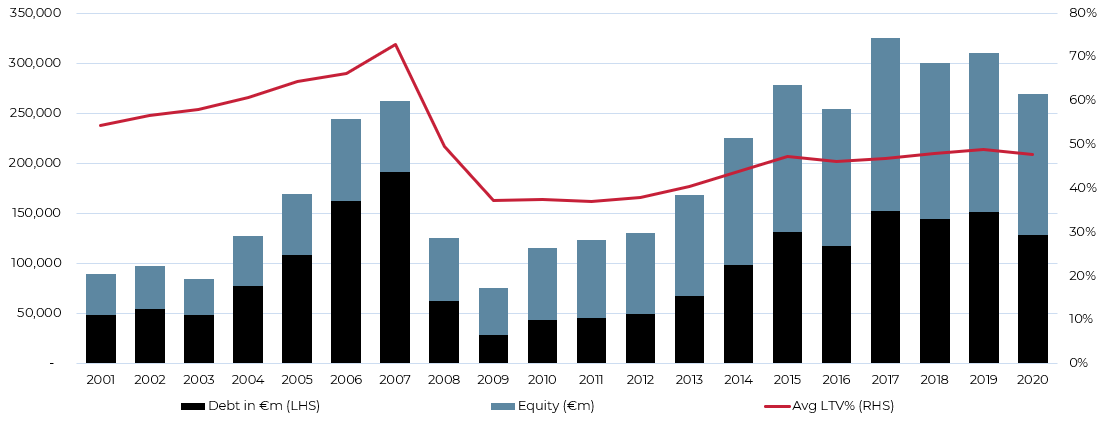
Sources: RCA, CBRE, AEW & Research
MID-YEAR 2021 REPORTED LTV’S BACK TO PRE-COVID LEVELS
- The latest 2021 EPRA and INREV reported loan-to-values (LTV’s) on total portfolio (i.e. not new acquisitions) came back down to their pre-Covid, year-end 2019 levels, for REITs and private funds, respectively.
- During 2020 and possibly due to Covid-19 related valuation adjustments, both reported LTVs had increased by 100 bps.
- But, during the first half of 2021 LTVs returned to pre-Covid levels, likely due to banks focusing on lower refinancing LTV’s and more stabilised values.
- Since 2015, the reported LTV’s have remained in a tight range of 35-40% for REITs based on the EPRA data and 20-25% for private real estate funds based on the INREV data.
- In both cases, reported LTVs remain well below 2008-09 record levels, confirming our acquisition LTV data above.
- This data does not preclude a future increase in LTV’s as Covid-related valuation impacts might be delayed.
Reported Sector Average Loan-to-Value Ratio
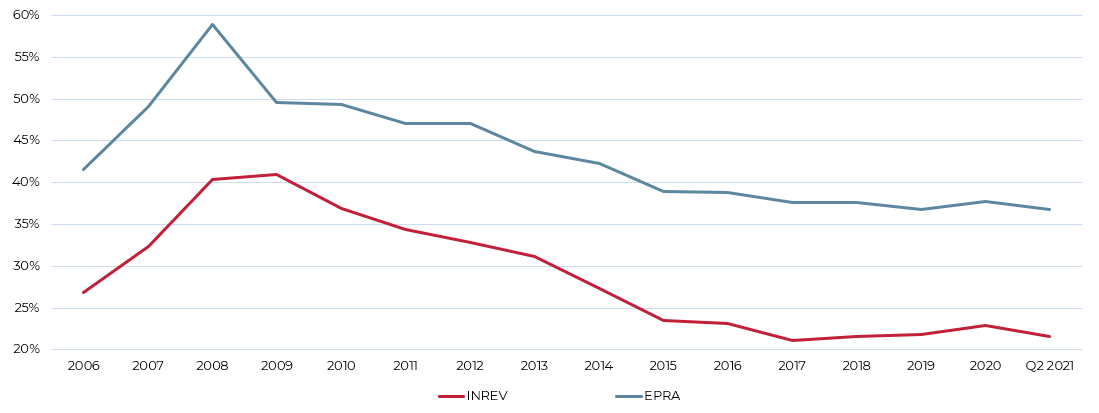
Sources: INREV & EPRA
EUROPEAN CRE LOAN TRANSPARENCY IMPROVES SLOWLY
- As highlighted in previous work, transparency remains limited in European commercial real estate lending despite being one of the key drivers of the GFC. But, it has been slowly improving.
- Apart from the re-launched CBRE debt map, we now have also data from Chatham and INREV as well.
- Coverage across markets varies and can partly explain why all-in interest rates are different between sources. For example, the AEW data covers any loan with sufficient data from our actual loan pipeline while CBRE data focuses on prime collateral loan pricing.
- AEW average all-in rates stand at 3.2% while CBRE prime lending rates are 150 bps lower at 1.7%.
- As it can be easily noted from the chart, the target IRR’s for debt funds from the INREV survey do seem out of line with actual all-in rates. It seems that targets far exceed actual loan interest rates regardless of the source used.
Comparison of European All-in Interest Rates vs. INREV IRR
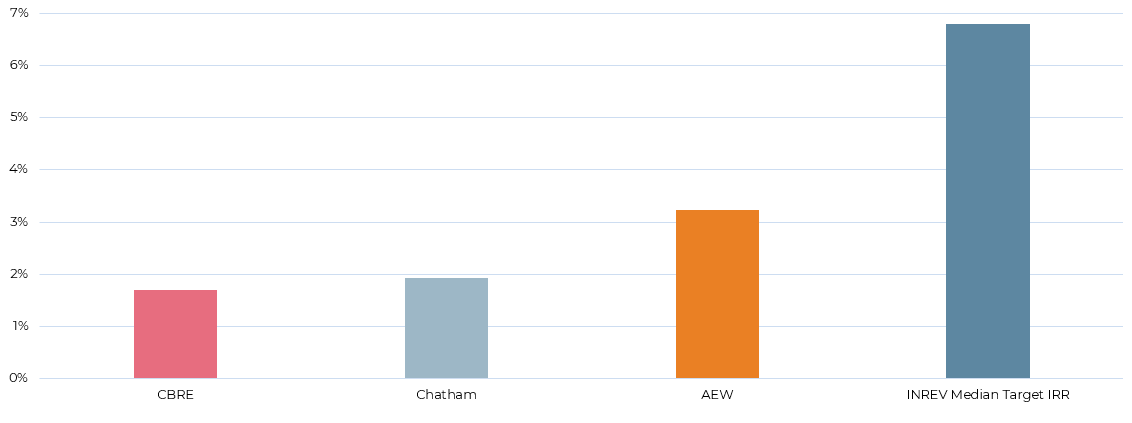
Sources: RCA, REC, CBRE, INREV, Chatham & AEW Research
LOWER LTV & RATES EMERGE IN POST-COVID ERA
- We have updated our granular loan by loan database with another 240 records of loans originated since Sep-19 to bring our data set close to 1250 loans from both in-house and external sources.
- As before, our data goes back to 2003 and our granular data covers over 10% of the overall acquisition debt origination since 2010.
- The full data is shown in the scatter chart indicating that post Covid loans are more prevalent in the lower LTV and low interest rate quadrant. At the same time post-2019 loans are very rare in the higher LTV buckets.
- Our granular loan level data allows for a more precise interrogation of the impact of Covid-19 on latest market trends.
All-in Rates and LTV 2003-2021
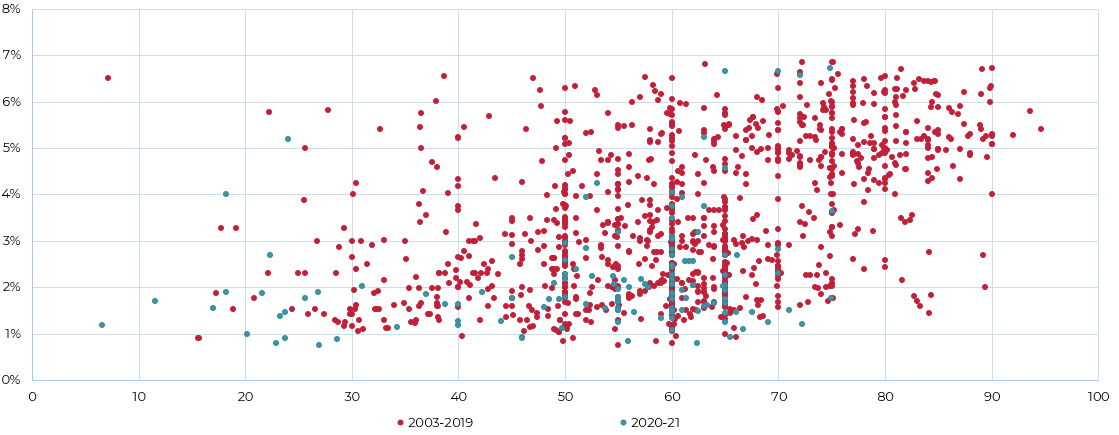
Sources: RCA, REC & AEW Research
LOAN MARGINS MOVE UP, BUT OFFSET BY LOWER BASE RATES
- Loan margins for mid-year 2021 are estimated at 2.7%, their highest levels since 2003 continuing their post-GFC upward trend.
- However, given the near zero level of base or reference rates (such as the five year swap rates) all-in interest rates still remain below 3%.
- It should be noted that we have assumed a 0% floor for any floating rate loans and any floating to fixed rate swaps. Without these customary loan or swap contract floor some borrowers could have benefitted from negative 5-year swap rates.
- The average 50 bps increase in all-in interest rates from 2016 has made debt less accretive for equity investors, especially as prime property yields have continued to tighten in over the same period.
Average European CRE Loan Margins & All-in Rates
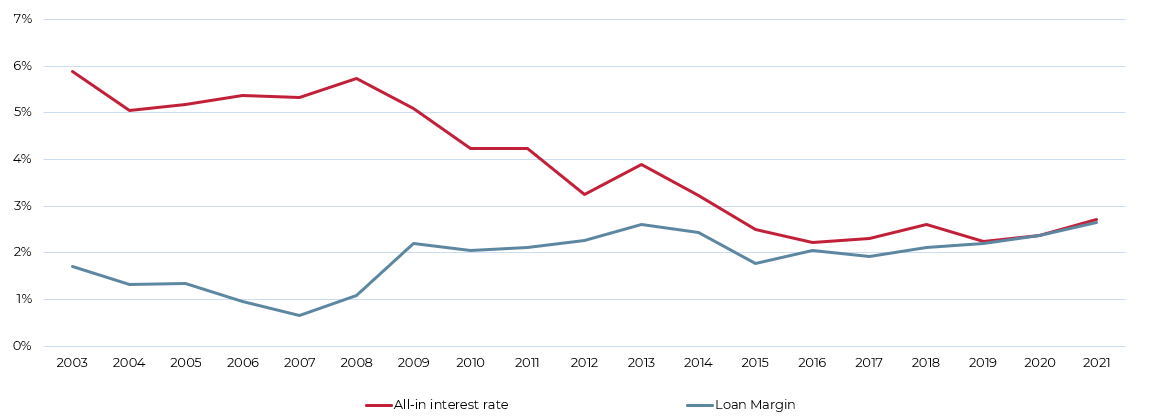
Sources: RCA, REC, AEW & Research
UK LESS IMPACTED BY COVID THAN REST OF EUROPE
- Non-UK all-in interest rates have increased more in 2021 than in 2020, which is likely to be a delayed impact from Covid-19. The recorded loan margins are typically delayed by 3-6 months from when they were first quoted due to the legal, compliance and due diligence process.
- Contrary to expectations, all-in rates for German real estate loans stepped up by an impressive 80 bps in 2021 from an average of 180 bps in 2020, reaching their highest level since 2014.
- German loan margins have been traditionally low due high level of competition and efficient covered-bond funding.
- In contrast, the UK has shown good stability in the last two Covid-impacted years, albeit at higher all-in rates. This difference is explained by the UK’s higher reference or base rate and the lasting impact of the UK’s slotting regulations on banks.
All-in Rates per Country
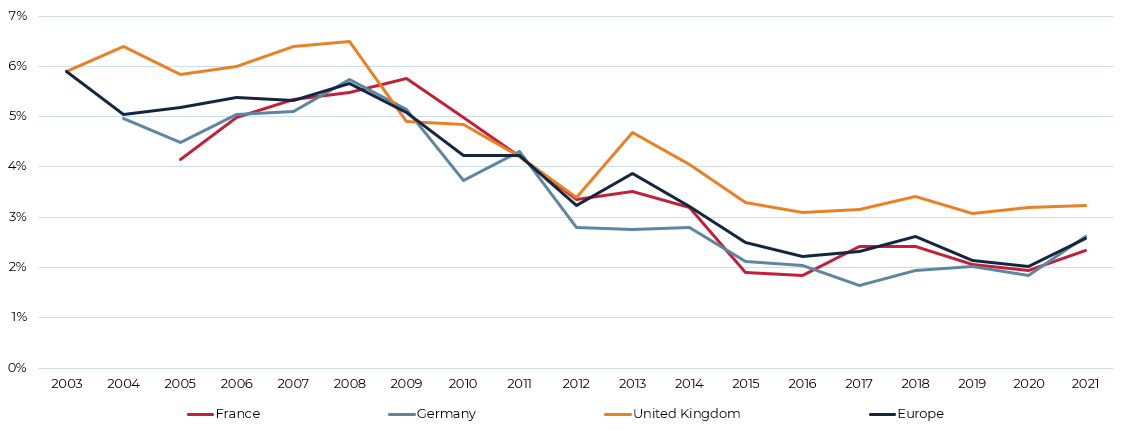
Sources: RCA, REC, AEW & Research
POST-COVID ALL-IN RATES FLAT DESPITE MARGIN WIDENING
- All-in interest rates for commercial real estate loans remained largely unchanged across sectors during the pandemic.
- This was because an increase in margins was offset by a drop in base or reference rates due to unprecedented monetary measures.
- Retail loan margins remained elevated in the post-Covid period. But not significantly higher as one might have expected. This could be due to our data capturing only the most core retail collateral loan deals over the Q2 2020- Q2 2021 period, without any distressed loan pricing recorded.
- At the same time, the lowest average margins are recorded for logistic/industrial collateral loans as the push from investors for this sector remained strong post-Covid.
Loan Margin by Property Type for pre vs post-Covid periods
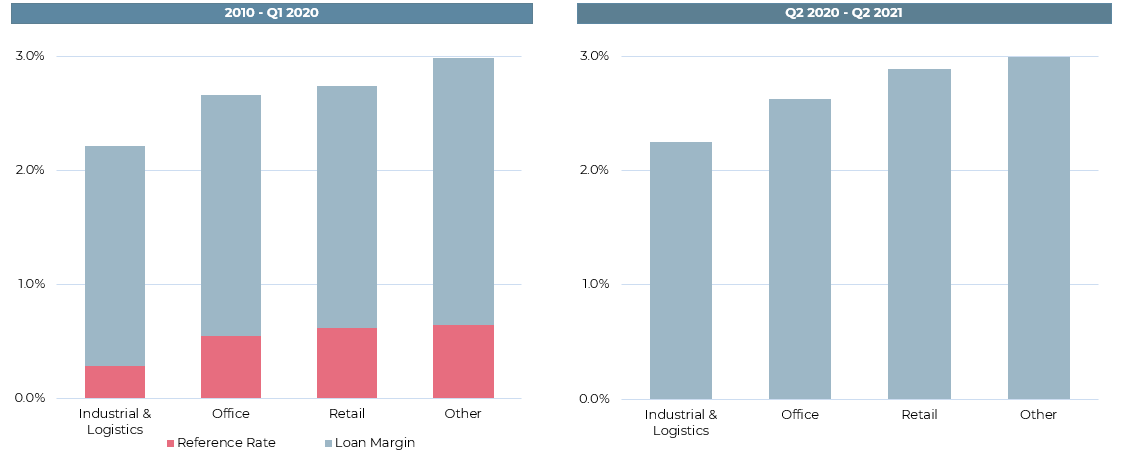
Sources: RCA, REC & AEW Research
PANDEMIC TRIGGERS “RISK-OFF” WITH FEW HIGH LTV LOANS
- Based on our most recent data, it is clear that loan margins by LTV loan buckets have changed significantly since the onset of the pandemic as there were no loans recorded with LTV’s above 80%.
- This signaled a “risk-off” attitude from lenders which was further confirmed by loan margins for loans with LTV’s between 70-79% reported at 3.9%, up 150 bps from the pre-Covid margin of 2.4%.
- On the other hand, loan margins for low risk and below 50% LTV loans remained flat over the period.
- Both data points are consistent and confirm that in the post-Covid period, lenders took more of a “risk-off” attitude by reducing exposure to higher risk loans and demanding higher margins for riskier loans.
- In the end, this seems a logical reaction from lenders in a market with heightened levels of uncertainty and risk.
Loan Margin per LTV Bucket for pre- vs post-Covid periods
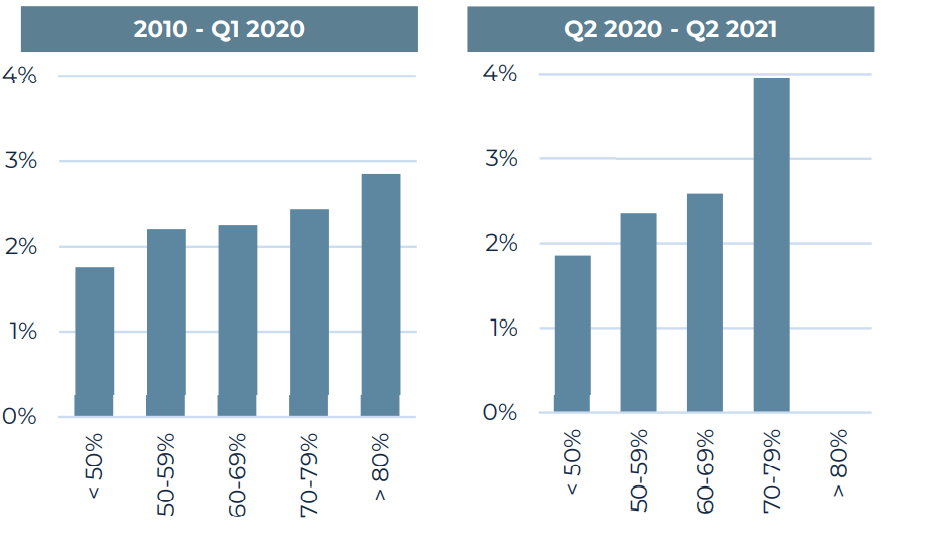
Sources: RCA, REC & AEW Research
LOAN PRICING DRIVEN BY PANDEMIC UNCERTAINTY
- As in our previous Sep-19 report, we have updated our model which predicts the all-in interest rate based on key loan variables such as the LTV, vintage of origination, property type and the location of the collateral.
- Compared to our 2019 results, it is noted that the explanatory power of our original model has decreased slightly from the R-squared of 76% to 74%. This drop is mainly driven by the 2020-21 loans on the right hand bottom of the graph which indicate deals that have a high actual interest rate while a much lower all-in interest rate is predicted by the model based on their individual loan features.
- A reason for this change in the models predictive strength despite the larger dataset, might be that Covid uncertainty was an additional driver of interest rates above and beyond loan fundamentals.
Actual vs. Predicted All-in CRE Interest Rates
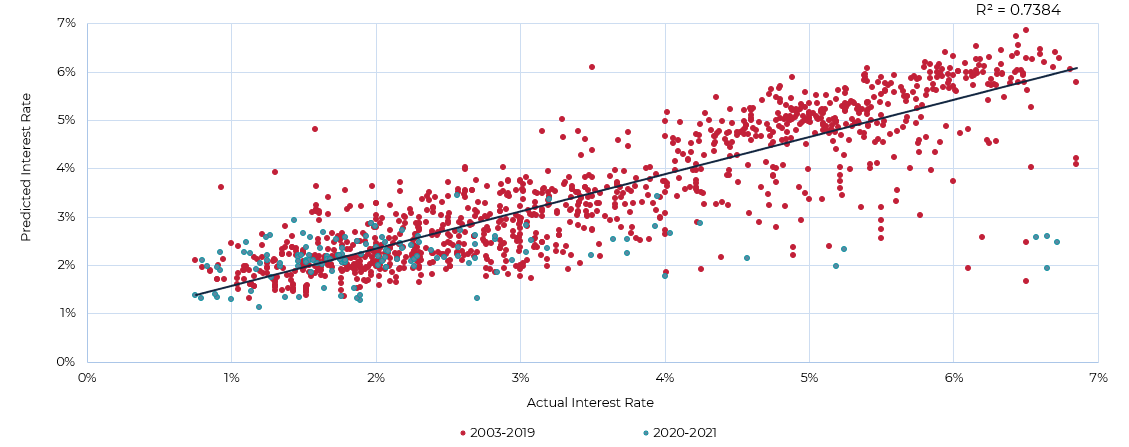
Sources: RCA, REC, AEW & Research
The information and opinions presented in this research piece have been prepared internally and/or obtained from sources that AEW believes to be reliable; however, AEW does not guarantee the accuracy, adequacy, or completeness of such information.
