The U.S. Economy
As of July 2019, the U.S. economy is officially in the longest continuous expansion in the nation’s history, reaching 121 months and surpassing the prior record expansion of March 1991 to March 2001. Despite the record length of the current expansion, preliminary data for the second quarter combined with revised data for 2018 show slower than previously reported growth for 2018 and a significant slowing of aggregate growth between the first and second quarters of 2019. Specifically, revised data show the 2018 GDP growth rate dropping from a previously reported 2.9% to 2.5%, roughly in line with average growth in the post financial crisis period. Additionally, the current estimate for the second quarter of 2019 shows annualized real GDP growth slowing from 3.1% in the first quarter to 2.1% in the second quarter. Most of this slowdown is attributable to a sharp reversal in investment, particularly in non-residential structures and inventories, as well as a steep decline in exports. Reflecting both ongoing concerns related to global trade and a general slowdown in global economic growth, the near-term forecast assumes growth for all of 2019 will remain roughly in line with the revised measure of 2018 (i.e. 2.5%), with even slower, albeit still positive, growth in 2020 and 2021.
FIGURE 1: LONGEST EXPANSION IN U.S. HISTORY – 121 MONTHS
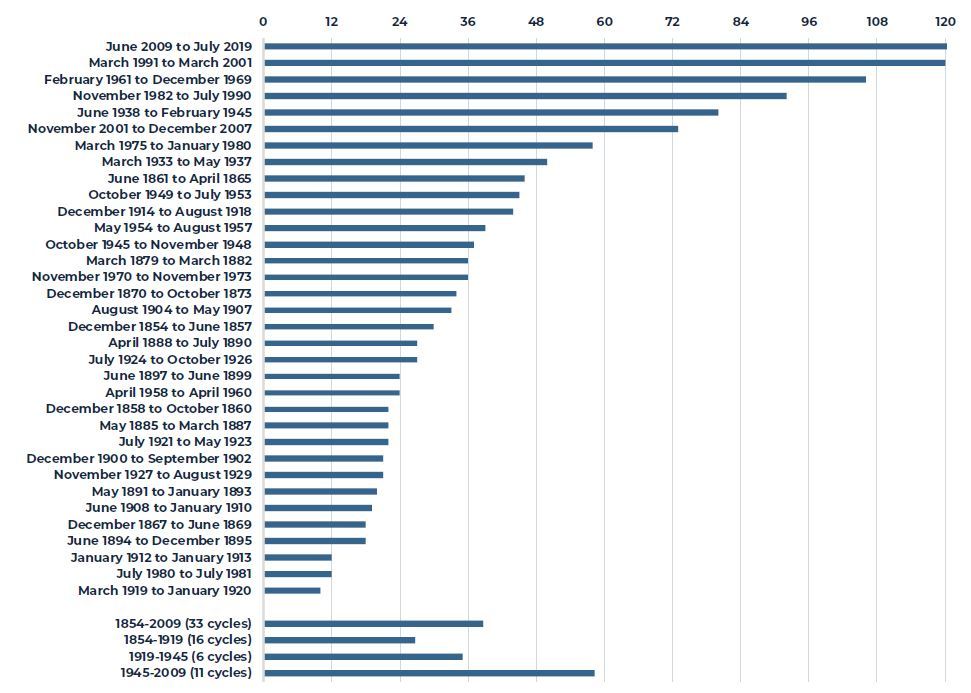
Source: National Bureau of Economic Research
Despite the revisions to 2018 data and slowing growth in the second quarter, the U.S. labor market remains strong with new claims for unemployment insurance and the official unemployment rate, currently 3.7%, still hovering near fifty-year lows. As a result, wage growth continues to accelerate, particularly for the highest income wage earners. Overall, median wage growth in the U.S. has averaged 3.7% over the past year, the highest level since the financial crisis. By income quartile, the strongest gains have clearly accrued to the highest income wage earners, likely a reflection of higher demand for higher skill levels.
FIGURE 2: ANNUAL WAGE GROWTH BY INCOME QUARTILE (%)
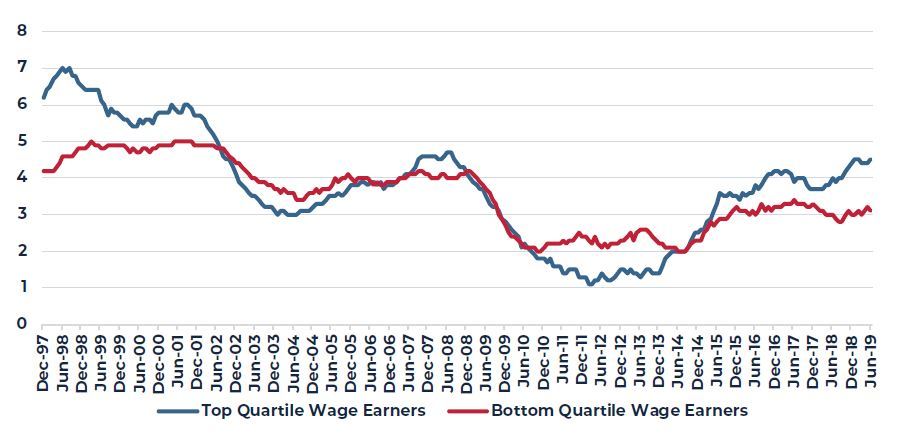
Source: Federal Reserve Bank of Atlanta
Despite accelerating wage growth, increases in unit labor costs and overall inflation remain quite low, most likely reflecting productivity gains across many sectors of the economy. Overall, actual and expected inflation remain stubbornly below the 2% inflation rate targeted by the Federal Reserve and most other central banks. The most recent government GDP report shows year-over-year growth in the core (i.e. excluding food and energy) personal consumption expenditures price index (PCE) of only 1.6%, roughly the same as the bond market’s current expectation for inflation over the next five years.
FIGURE 3: EXPECTED INFLATION OVER THE NEXT FIVE YEARS

Source: Federal Reserve
Faced with slowing aggregate growth and very low inflation expectations, the Federal Reserve Open Market Committee (FOMC) announced at its July meeting a 25-basis-point cut in the key overnight lending rate, the first interest rate cut since 2008. Equally significant, the Fed also announced the immediate end of their process of shrinking their balance sheet, so-called Quantitative Tightening (QT). While Fed guidance about future interest rate cuts was somewhat vague, current bond market pricing anticipates the ten-year Treasury bond yield will remain below 2.5% for at least the next five years while the two-year yield drops to nearly 1.7% over the next two years.
FIGURE 4: FORWARD INTEREST RATES
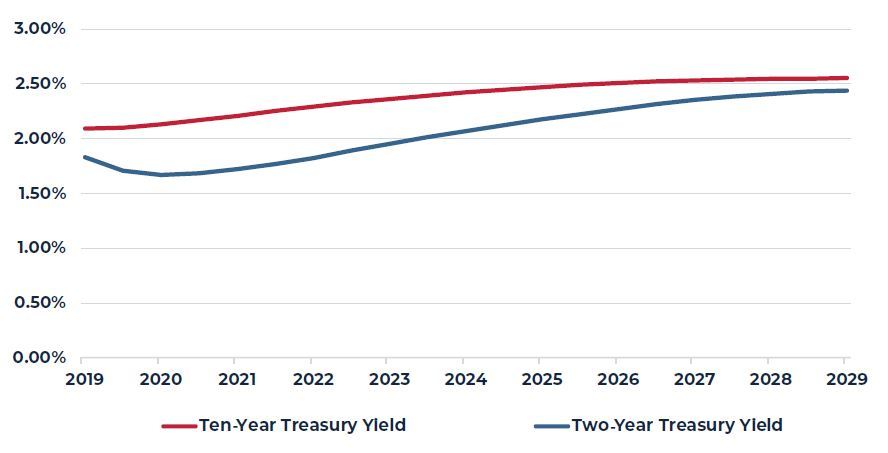
Source: Chatham Financial, July 2019
The U.S. Property Market
The U.S. commercial property market remains largely in equilibrium as the U.S. economy enters its 11th year of the current expansion. During the second quarter, the national average vacancy/availability rates for the major property types were consistent with or slightly lower than prior-quarter levels. In the office market, four-quarter absorption accelerated significantly over the past year, matching the highest level of this expansion (2%+) and moving well ahead of waning supply growth of less than 1.3%.
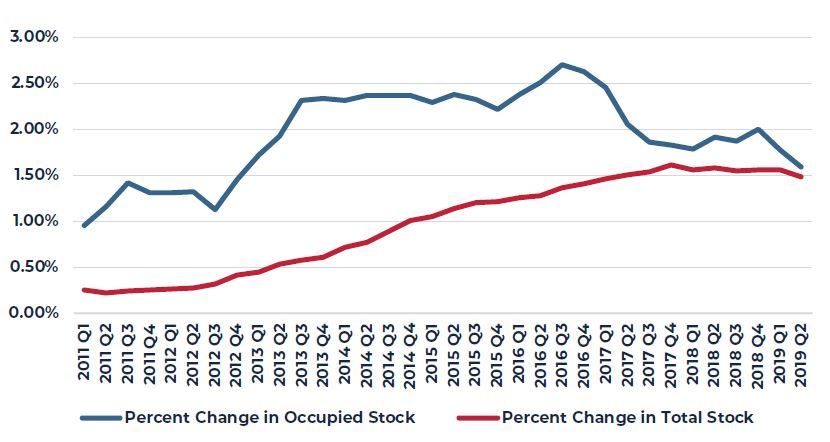
FIGURE 5: OFFICE ABSORPTION AND NEW SUPPLY OVER PRIOR FOUR QUARTERS
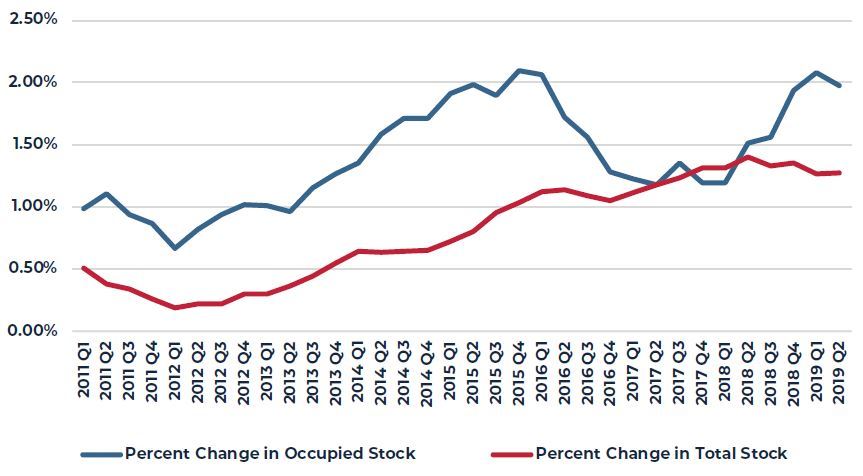
Source: CBRE-EA 2019 Q2
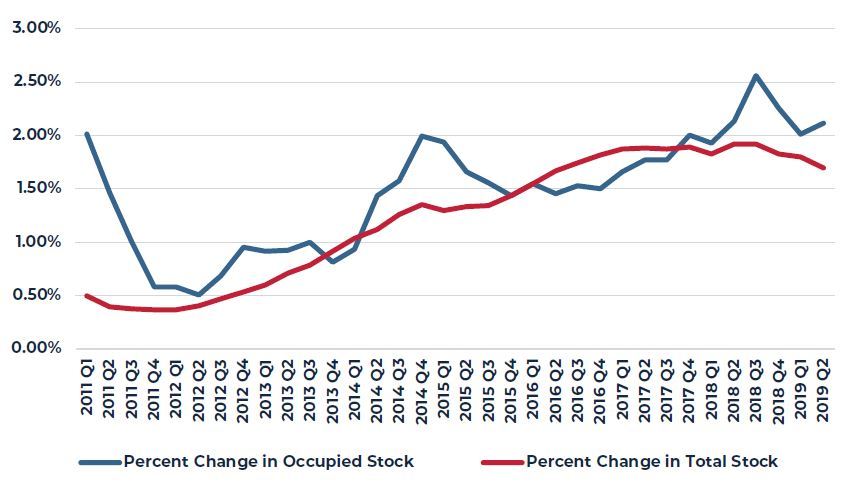
In the industrial property market, absorption has been slowing since the end of 2016; however, this is likely reflective of today’s limited availability in the sector. Nationally, the availability rate has dropped to a near all-time low, while, regionally, availability rates in many metropolitan areas are at record lows. The slowdown in absorption of industrial space accelerated during the first half of 2019, but remained above the pace of new supply growth. With respect to supply, construction activity is moderating and should continue to do so going forward. Rising land, labor and construction costs, limited availability of developable land and the repurposing of existing industrial sites to other uses will continue to contribute to the limited growth in stock for this cycle.
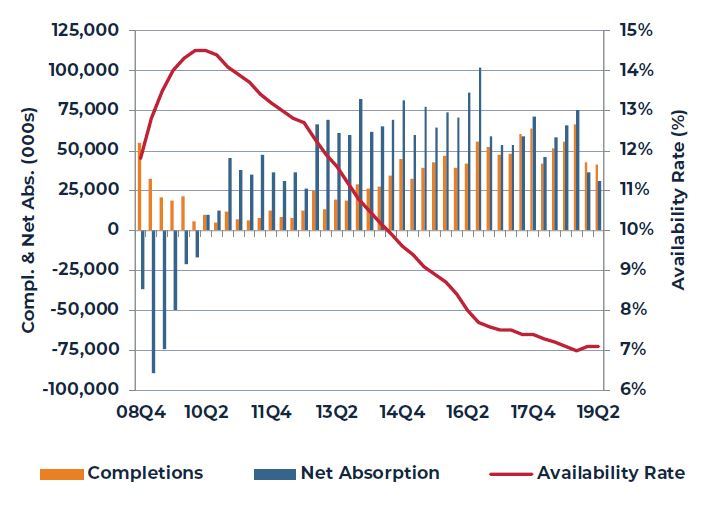
FIGURE 6: INDUSTRIAL ABSORPTION AND NEW SUPPLY OVER PRIOR FOUR QUARTERS
Source: CBRE-EA 2019 Q2
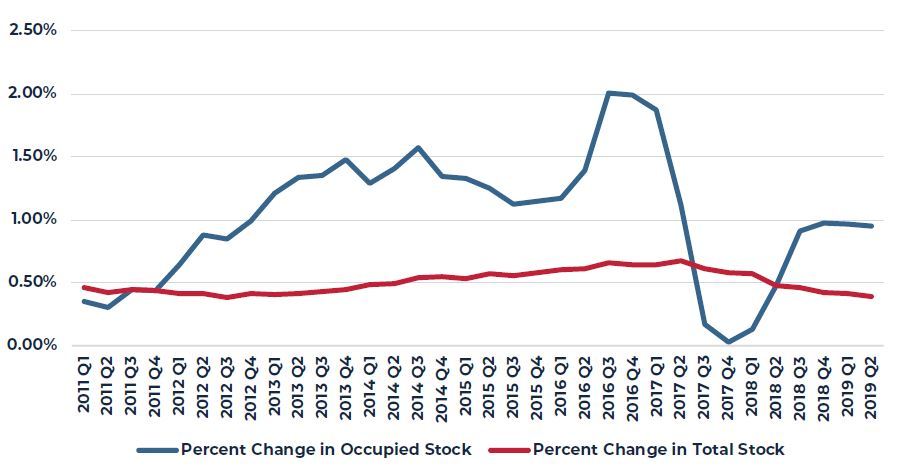
FIGURE 7: APARTMENT ABSORPTION AND NEW SUPPLY OVER PRIOR FOUR QUARTERS
Source: CBRE-EA 2019 Q2
New supply of apartments also appears to have plateaued for this cycle and has actually trended downward over the past several quarters. Meanwhile, apartment absorption continues to trend upward, with second-quarter absorption reaching the highest level recorded in more than twenty years. Finally, shopping center demand and supply growth both remain very weak as the retail sector has broadly been impacted by e-commerce, retailer bankruptcies and generally negative investor sentiment towards the sector.
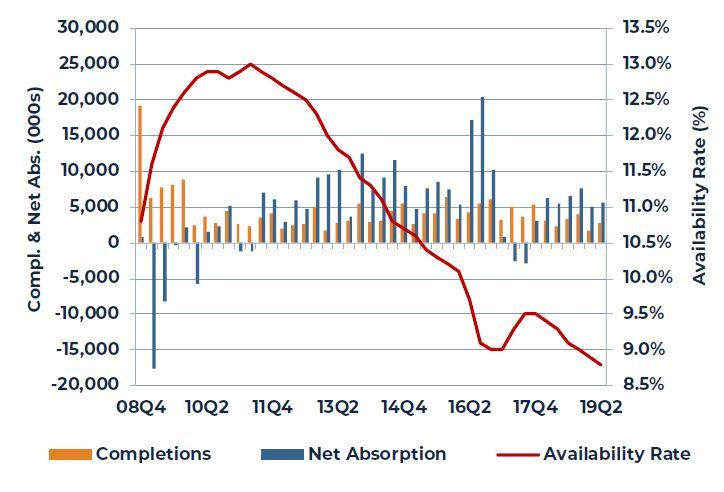
FIGURE 8: SHOPPING CENTER ABSORPTION AND NEW SUPPLY OVER PRIOR FOUR QUARTERS
Source: CBRE-EA 2019 Q2
With the exception of retail properties, property net operating income (NOI) growth has proven resilient during the latter stages of the current economic cycle. Over the past year, NOI growth in industrial, apartment and office properties has accelerated, with industrial leading the group. On average, industrial properties realized a 9% increase in trailing four-quarter NOI growth, followed by apartment properties at 7.9% and office properties at slightly more than 4%. Conversely, the retail sector has posted negative trailing four-quarter NOI growth in each of the past two quarters.
Overall, U.S. commercial property continues to produce solid, albeit somewhat more moderate, returns with the NCREIF Property Index (NPI) recording a 1.8% total return for the second quarter of 2019 and a year-over-year return of 6.5%. Performance during the quarter varied from a more than 3.4% total return for industrial properties to -0.1% for retail properties. This variation was even greater for the trailing one-year period, with industrial property posting a 13.9% total return as compared to only 1.7% for retail. Going forward, valuation risk is clearly greatest for retail properties as limited private market trades introduce appraisal uncertainty and public market (REIT) valuations suggest more re-pricing ahead.
Office
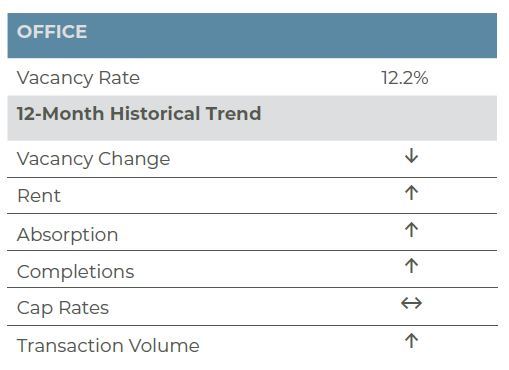
With the U.S. economic expansion now the longest in recorded history, it is no surprise that office fundamentals remained strong in the second quarter of 2019. More than 17 million square feet (msf) of office space were absorbed in the second quarter of 2019, significantly greater than the previous quarter’s healthy absorption of 12.9 msf and well above the 14.7 msf completed during the quarter. This drove the vacancy rate down 10 basis points (bps) from the previous quarter to 12.2%. Impressively, office vacancies are now at their lowest level since early 2001.
San Francisco and Seattle both stood out in terms of high performing office markets with low vacancy rates of 5.1% and 6.9%, respectively. Austin is also performing well and vacancies are declining despite steady supply growth. Austin’s vacancy was just 7.3% in the second quarter, a marked 100 bps below the year-end level and 490 bps below the national average. Meanwhile, San Jose also showed strong improvement with vacancy declining 120 bps year-to-date. Vacancy in San Jose now rests at 9.1%, or 310 bps below the national average. The boom in these tech-heavy markets is often driven by tech firms’ desire to cluster around other tech companies to compete for top-tier talent.
In terms of demand, New York and Washington, DC, reported the two largest absorption totals in the second quarter at 2.8 msf and 2.0 msf, respectively. Washington, DC, will be gaining 25,000 jobs with an average salary of $150,000 due to Amazon’s HQ2 expansion. Amazon’s expansion in the market is also attracting additional tech firms, as Google and other tech companies have begun leasing space nearby. Meanwhile, despite losing out on Amazon’s expansion due to neighborhood push back, New York continues to attract other tech companies to the metro area. Google will increase their presence at Manhattan Hudson Square, growing their New York headcount to 14,000 after investing in Chelsea Market last year and the neighboring Milk building this year. Further, some of the space Amazon backed out of has already been absorbed by other firms. JP Morgan and Bank of America are also expanding their NYC presence, showing the appeal to not just tech firms, but also traditional FIRE (Finance, Insurance and Real Estate) tenants.
Other metros that have seen a large amount of office absorption include Charlotte (1.7 msf), Seattle (1.5 msf), Houston (998,000 sf) and Boston (888,000 sf). Seattle has benefitted from growth among tech powerhouses like Microsoft, Amazon, Facebook, and Google, all of which continue to expand their campuses. Likewise, other influential tech firms like Dropbox, Indeed.com, and LinkedIn are expanding their square footage in Seattle as well. In Houston, WeWork announced further expansion in the metro, while Boston has benefitted from tech and life science growth in the Kendall Square and Seaport submarkets. Google, Amazon, Foundation Medicine, Boeing, and WeWork have all leased or broken ground on additional office space in Boston. The strong demand seen across many markets and the shrinking availability of quality space continues to drive rents higher. Nationally, gross asking rents advanced 5.1% year-over-year in the second quarter, the strongest gain since late 2016.
Going forward, AEW Research forecasts that the broader U.S. office market will remain in equilibrium with both demand and supply moderating in the coming quarters. An overwhelming majority of office markets in the U.S. remain healthy. Office markets with a high proportion of tech firms and large pools of talent will continue to attract new tenants and corporate expansions, adding to their growth. Through 2020, the office sector will likely benefit from rent growth in excess of 3%, particularly in tech-heavy markets. Longer term, growth will moderate towards 3%. Overall growth in cash yields, however, will be tempered by high capital expenditure requirements needed to retain existing tenants and to compete for new tenants.
CBRE-EA Market Fundamentals
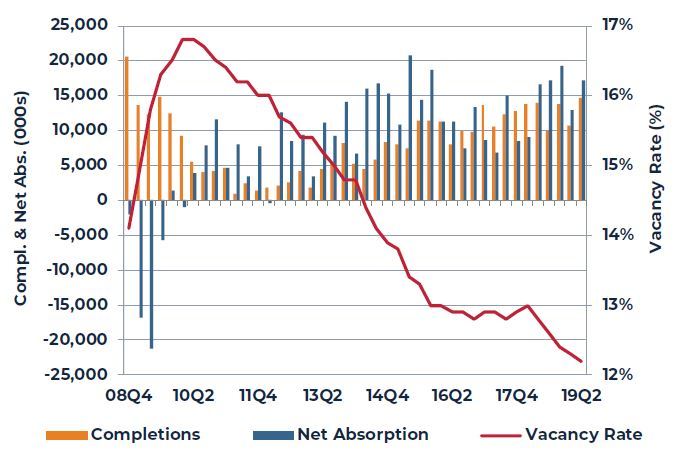
Source: CBRE-EA
Apartment
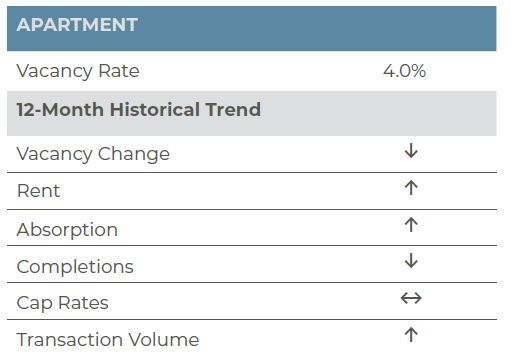
The ongoing economic expansion and solid job growth continue to support the U.S. apartment market. Fundamentals were remarkably healthy in the second quarter of 2019, buoyed by exceptionally strong demand. More than 160,000 apartment units were absorbed on a net basis in the second quarter, the strongest quarterly demand reported since mid-2000. Further, demand outpaced still healthy new supply of 71,700 units by 125%. The demand/supply dynamics resulted in tighter market conditions, with vacancy dropping to 4.0% at quarter end. The current vacancy rate is now tied with the third quarter of 2018 for the lowest vacancy rate since 2001.
In addition to healthy new leasing activity, renewal rates remained strong. Per RealPage, the resulting multifamily turnover rate dropped to only 47.5%, the lowest level in at least two decades. The lower turnover generally translates to stronger NOI growth due to reduced downtime and lower “make-ready” expenses. The National Apartment Association estimates that turnover costs are at least $1,000 per unit and can easily rise to over $3,000. While rent levels on new leases are typically higher than renewals, the costs associated with turnover usually outpaces the rent gap.
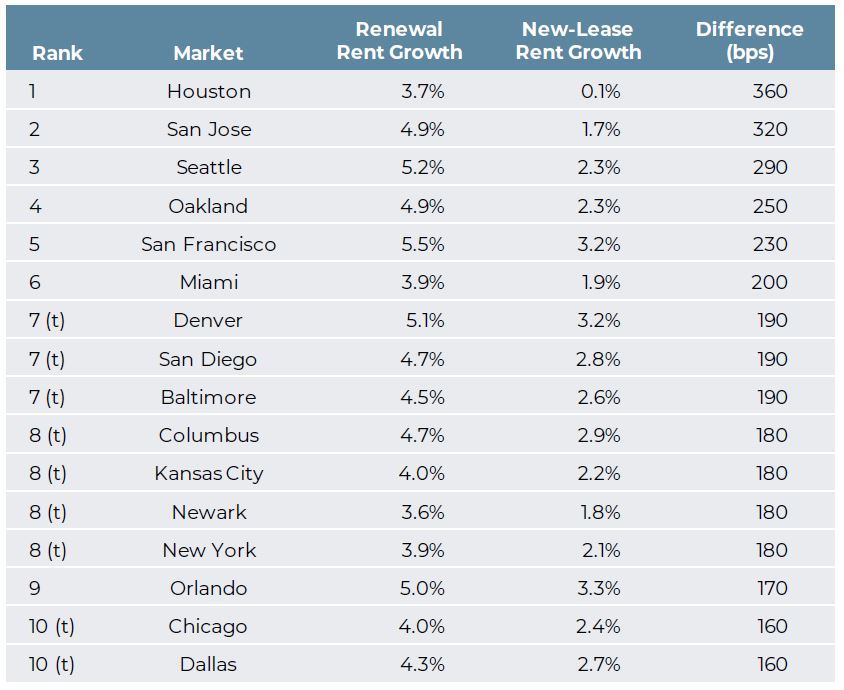
RealPage’s second-quarter data shows all but four of the nation’s 50 largest markets reported higher renewal rent growth relative to new-lease rent growth. Markets where renewal growth outpaced new-lease growth by a significant margin include Houston, San Jose, Seattle, Oakland, San Francisco, Miami, Denver, San Diego, Baltimore, Columbus, Kansas City, Newark, New York, Orlando, Chicago and Dallas. Renewal growth rates in these markets exceeded new-lease rent growth by 360 bps to 180 bps points, with Houston on the higher end of the range and Chicago and Dallas on the lower end. Of the four markets where renewal-rent growth did not outperform, two markets, Milwaukee (3.4%) and Norfolk (3.0%), reported essentially equal renewal and new-lease growth, while the remaining two markets, Las Vegas and Phoenix, reported meaningfully higher new-lease rent growth. That said, the gap between new-lease and renewal-lease rent growth was not as wide as the top renewal outperformers. In Phoenix and Las Vegas renewal rent growth rates were 190-200 bps below new-lease growth. New-lease rent growth in Phoenix and Las Vegas was 8.4% and 8.9%, respectively, versus renewal growth 6.4% and 7.0%.
The strength in renewal rent growth is driven by today’s low vacancy environment, which is limiting mobility in the rental sector. New-lease growth is likely limited due to new supply and concessions being offered at projects that are in lease-up. Going forward, new supply is peaking, which should support better new-lease growth. Meanwhile, ongoing job growth and a lack of affordability in the for-sale residential sector will support rental demand. Vacancies should be stable to declining, which should support future rent growth. Rents in nearly half of the top 50 markets are projected to grow by 4% or better on an annual basis in 2019; longer term, growth will moderate towards 3%.
Markets Where Renewal Rent Growth Most Outperforms
Markets Where New-Lease Rent Growth Most Outperforms
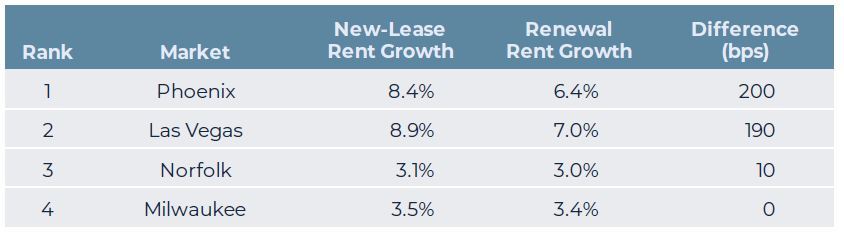
Source: RealPage
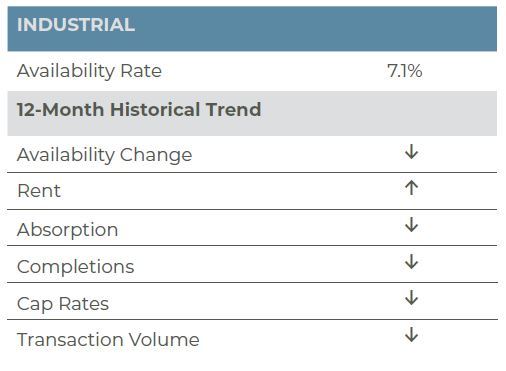
Industrial
The U.S. industrial market showed little deviation from first quarter trends in the second quarter of 2019. Availability held steady at 7.1%, and fundamentals were slightly tighter (10 bps) then a year earlier. At this point, it is hard to believe that industrial availability stood at 14.5% just nine years ago in the wake of the Great Financial Crisis. Fundamentals have come a long way since then, with the current availability a full 2.7 percentage points below the U.S. historical average of 9.8%. Supply and demand activity remained moderate but balanced in the second quarter, with 41 million square feet (msf) of new deliveries and 30 msf of net new leasing, both down meaningfully from year-end levels. On the demand side, we continue to believe that the slower leasing activity is a function of exceptionally tight availability today. This notion is supported by the fact that rent growth in the sector remains strong; industrial rents rose an impressive 7.8% year-over-year at the national level.
On the supply side, deliveries have been noticeably slow through the first half of 2019. Unsurprisingly, major distribution hubs such as Atlanta (9.2 msf completed year to date), Houston (7.8 msf), Dallas (7.4 msf), Chicago (6.8 msf) and Fort Worth (4.6 msf) have led the way in aggregate square footage delivered. However, supply as a percentage of inventory tells a different story. Austin (1.8% of inventory delivered year to date), Trenton (1.5%), San Antonio (1.4%), Greenville (1.4%) and Toledo (1.3%) all rank near the top of the list of markets that are still experiencing high levels of construction halfway through the year. For the most part, these are smaller industrial markets that share one of two things in common: 1) they either have rapidly growing populations and are underserved in regards to industrial square footage per capita (Austin, San Antonio); or 2) they are in small, relatively affordable cities (Trenton, Greenville, and Toledo) that are optimally located geographically to serve hundreds of millions of people nearby. Austin has an industrial square foot per capita of just 39 square feet per person, while San Antonio has just 47 sf per person, both a far cry from other Texas markets like Houston (83 sf) and Dallas/Fort Worth (114 sf), as well as the national average of roughly 75 sf per capita (per CoStar). Smaller markets are beginning to see meaningful growth as developers and investors alike seek additional yield in areas that have cost, demographic and locational advantages.
A topic on the forefront of many investors’ minds is that of the U.S.-China trade war and how it will impact both the flow of goods in and out of the U.S. and, by extension, the U.S. industrial property market. In 2018, the U.S. imposed $250 billion worth of tariffs on Chinese goods. In response, China retaliated with its own $110 billion of tariffs on U.S. goods. Trade negotiations are ongoing; however, it is not likely an agreement will be reached in the foreseeable future, especially given the mixed signals with respect to the progress of the negotiations. In early July, the Trump Administration announced it would exempt 110 Chinese products from 25% tariffs, which signaled talks were headed in the right direction; by August 1, however, President Trump announced a new 10% tariff would take effect September 1, on $300 billion of product from China. So far, a number of sectors have reported being impacted by the tariffs, particularly the automotive and food and beverage sectors. Many U.S. businesses are attempting to source goods from nations other than China in an effort to save on costs, which is disrupting supply chains nationwide.
Nevertheless, the trade war has had little impact on the U.S. industrial market to date; availability has been stable and rents are rapidly rising, despite an increased cost of goods for many industrial end users. Increasing material costs could work to slow supply growth in the sector and across all property types, which given the late-stage of the expansion would be viewed favorably. Overall, the ongoing trade discourse needs to be monitored going forward, as any major news in one direction or another could have positive or negative implications on the national industrial market.
The industrial property outlook remains favorable with both moderate supply and demand expected. The balanced fundamentals will support continued rent growth. Growth will be strongest (5%-8%) in secondary markets like Sacramento, Jacksonville, Las Vegas and Toledo. Major West Coast and East Coast markets will experience healthy but more tempered growth in the 4%-5% range near term. Longer term, we expect growth across all markets to moderate to 3%.
CBRE-EA Industrial Market Fundamentals
Source: CBRA-EA
Retail
The woes for brick and mortar retail continued into the second quarter of 2019. Through the first two quarters of the year, Coresight Research reported the announcement of nearly 7,500 store closings, more than the total closings (5,864) for all of 2018. The list of closings includes 650 Dress Barn locations as parent company Ascena Retail Group is closing the brand. While it is not surprising to see Dress Barn on the list of closings, other retail stalwarts are taking advantage of today’s headlines, seeing it as an opportunity to close underperforming stores, including Family Dollar (390 stores), Walgreens (195), Starbucks (150), Lowes (51), CVS (46), Wal-Mart (17), Target (6) and Nordstrom (4). On net, despite some closures, Nordstrom and Target continue to add to store counts, as does Dollar Tree, the parent company of Family Dollar. Meanwhile, TJX, Costco, Whole Foods, Lululemon, Ulta, Urban Outfitters, Madewell and Aldi remain in expansion mode and are contributing to the 3,039 store openings announced year-to-date. Despite the large number of closures and net loss in store count, the net square footage demanded has remained positive and, along with moderate supply, continues to contribute to an improvement in availability.
On net, over 17 million square feet (msf) of space was absorbed in the first half of the year and nearly 59 msf was absorbed in 2018 per CBRE-EA. Construction activity continues to wind down with less than 14 msf of space completed through June 2019, the lowest two-quarter completion level ever reported. Further, in 2018 only 43 msf of new space was delivered to the market, the lowest annual total during an expansion. The combination of moderate demand and minimal new supply allowed availability to improve to 6.2% in the first quarter of 2019, down from 6.3% in the previous quarter and 6.5% a year earlier. Availability remained at 6.2% in the second quarter of the year, per CBRE-EA’s preliminary estimates.
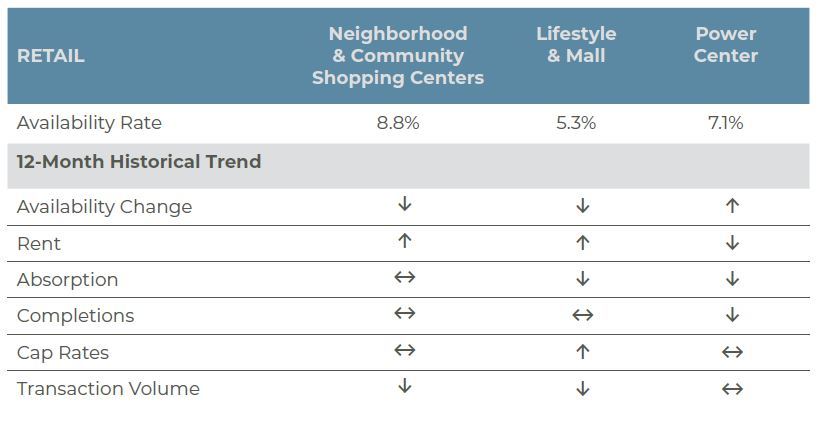
Within the retail market, performance remains uneven as shown by the list of closings versus openings above. Store openings are generally favoring neighborhood and community shopping centers (NCSC) while store closings are impacting the lifestyle & malls (L&M) and power centers (PC) segments of the market. To that end, the NCSC segment of the market continued to outperform the softer performing L&M and PC segments of the market. Availability in the NCSC declined to 8.8% in the second quarter of 2019, down 10 bps from the first quarter and 50 bps lower than one year ago. NCSC availability is now at its lowest level since mid-2007. Meanwhile, the L&M segment of the market experienced a pause in demand in the second quarter as 3.3 msf of space was returned to the market. L&M availability, as a result, edged up to 5.3%, a 50-bps increase over the 4.8% rate reported in the previous quarter. Despite the most recent quarter, the L&M segment of the market has remained fairly stable in recent years, with availability fluctuating between 4.7% and 5.6% since 2013, down from an average of 6.4% from 2010 through 2012.
On the flip side, PC availability has generally trended higher since early 2016 as soft demand continued to impact the market. Availability increased again in the second quarter of 2019, edging up to 7.1%, a 10-bps and 20-bps increase from the prior quarter and year, respectively. PC availability has now increased on a year-over-year basis for 12 consecutive quarters. Again, the PC segment of the market continues to be hampered by soft demand. Roughly 980,000 sf of space was returned to the market in the first quarter while 2.1 msf has been given back in aggregate since mid-2016. In comparison, 4.7 msf of NCSC was absorbed in the most recent quarter and nearly 66 msf has been absorbed since mid-2016. While the L&M sector reported negative demand for the quarter, demand has remained positive since mid-2016, with 12 msf being absorbed.
Going forward, availability will likely nudge lower, with minimal new supply and positive, albeit modest, demand expected. That said, rent growth will be limited in the near term, likely remaining below 2%. Rent growth should gain traction by 2021, but will experience modest increases in the 2-3% range, below the growth expected in the office, industrial and apartment sectors.
CBRE-EA Neighborhood & Community Shopping Center Market Fundamentals
Source: CBRA-EA
Capital Markets
Despite still healthy economic growth and the current expansion emerging as the longest in U.S. history, investment activity was sluggish in the first half of the year as investors remained cautious due to uncertainty related to the trade war and stumbling of the stock market earlier in the year. Overall, sales volume for the first half of 2019 totaled $237 billion, down 3.4% from the same period one year ago. Entity-level trades were notably absent from both first- and second-quarter trades with total entity volume of $4.4 billion, a 68% decline over the first half of 2018. Further, entity-level sales represented less than 2% of all transactions, well below the 7.4% average since 2010. Portfolio trades were also down modestly in the first half of the year with volume of $49.2 billion, a 2.9% decrease from 2018. Individual transaction volume, on the other hand, was up in the first half of 2019 with $183.4 billion in trades, a 1.4% increase from the first six months of 2018. Further, of note, individual trades represented 76% of volume in the second quarter and nearly 80% of first-quarter trades, both well above the post-recession average of 71%. Portfolio trades through the first half of 2019 were only slightly below average at 20.8% versus a post-recession average of 21.9%.
By property type, seniors housing, apartment and office transaction volumes increased 24.2%, 10.8% and 8.2%, respectively, in the first half of 2019 relative to the same period in 2018. In comparison, over the same period, hotel, retail, industrial and land volumes were down 32.3%, 25.4%, 13.8% and 12.6%, respectively. The industrial results were somewhat surprising given the strength of fundamentals and investor interest in the sector; however, a lack of portfolio and entity-level transactions led to the slower volumes. Indeed, demand for industrial product remains strong and this is reflected in the sector’s pricing. According to RCA’s commercial property price index of repeat sales, industrial pricing increased 13.3% year-over-year in June 2019, a pace more than double the all-property index gain of 6.5%. Further, the industrial sector was the only property type to post double-digit year-over-year gains in June 2019. CBD office and apartment pricing remained healthy as well, advancing 7.6% and 7.3%, respectively, over the same period. Suburban office (3.1%) and retail (1.6%) gains lagged; however, this is not surprising given investors’ weaker appetite for both property types. Further, we believe pricing in both segments achieved these small gains due only to the fact that the better properties in the sectors are changing hands. Properties with any challenges, real or perceived, are generally being pulled from the market as sellers are often unwilling to capitulate to close the bid-ask spread.
RCA cap rates were essentially flat across the four major property types, generally changing, plus or minus, by 10 bps or less on a quarter-over-quarter and year-over-year basis. Among institutional investors, NCREIF cap rates for office and industrial trended down modestly, while apartment cap rates were flat. Retail cap rates, meanwhile, edged up 7 bps on a market value-weighted, four-quarter moving-average basis. Further, with respect to the retail sector, there is a growing disconnect between public and private market pricing. Retail REIT implied cap rates currently reflect a sizeable discount to private market cap rates and the spread between them is widening. The REIT implied cap rates for malls is roughly 260 bps higher than the NCREIF average, while the REIT implied shopping center cap rate exceeds the NCREIF cap rate by 160 bps. A lack of transactions in the retail sector is making price discovery more challenging; however, we believe the public markets have likely overshot on the downside, particularly as retail fundamentals remain solid and wages are finally beginning to accelerate. That said, malls, power centers and lifestyle centers will likely have more upward pressure on cap rates than traditional grocery-anchored centers, given the formers’ exposure to apparel.
NPI Cap Rates by Property Type (Market value-weighted; 4-quarter moving avg.)
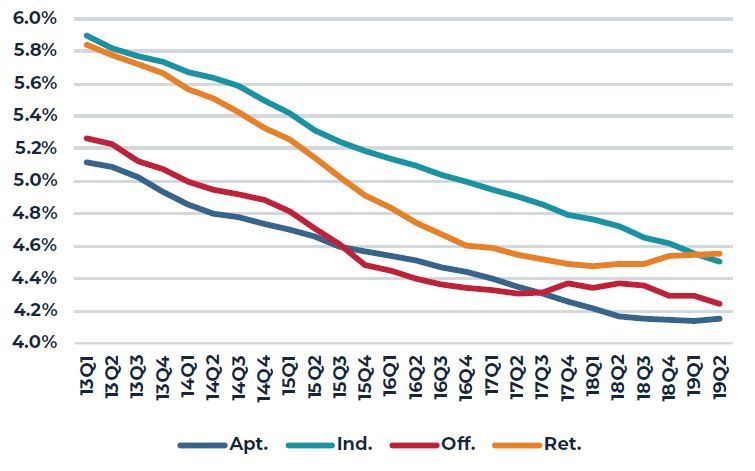
Source: NCREIF
RCA Transaction Volume (Billions of USD)
![]()
Source: Real Capital Analytics
The information and opinions presented in this research piece have been prepared internally and/or obtained from sources which AEW believes to be reliable; however, AEW does not guarantee the accuracy, adequacy, or completeness of such information.