Beginning to See the Light
Recovery from the economic dislocations of the COVID-19 pandemic slowed but continued during the fourth quarter of 2020 with the U.S. economy expanding at an annualized rate of 4.0% (-2.5% for the year) while total employment increased 1.3% (-6.0% for the year). Current forecasts suggest that real GDP will recover to pre-pandemic peak during the second half of this year while the employment recovery draws out into mid-2023.
FIGURE 1
RECOVERY IN REAL GDP AND EMPLOYMENT 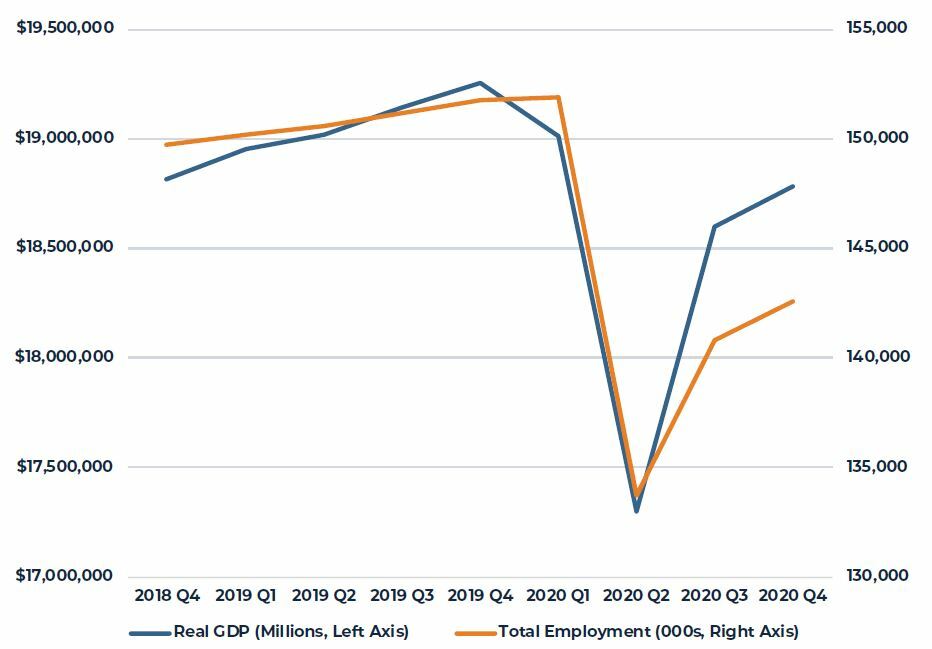
Source: Bureau of Economic Analysis (BEA), Bureau of Labor Statistics (BLS)
While generally encouraging, the recovery is expected to be highly variable by industry sector and geography. The divergence in expected employment recovery is illustrated in Figure 2. Markets that had been growing faster than average prior to the pandemic, such as Austin and Dallas, suffered smaller downturns and will, consequently, return to prior employment peaks earlier. In contrast, markets that had been experiencing little or no population and employment growth prior to the pandemic, such as Chicago and Philadelphia, suffered larger declines and will take much longer to return to pre-pandemic levels.
FIGURE 2
EMPLOYMENT OUTLOOK FOR SELECT MARKETS INDEX, 2019 Q4 = 100
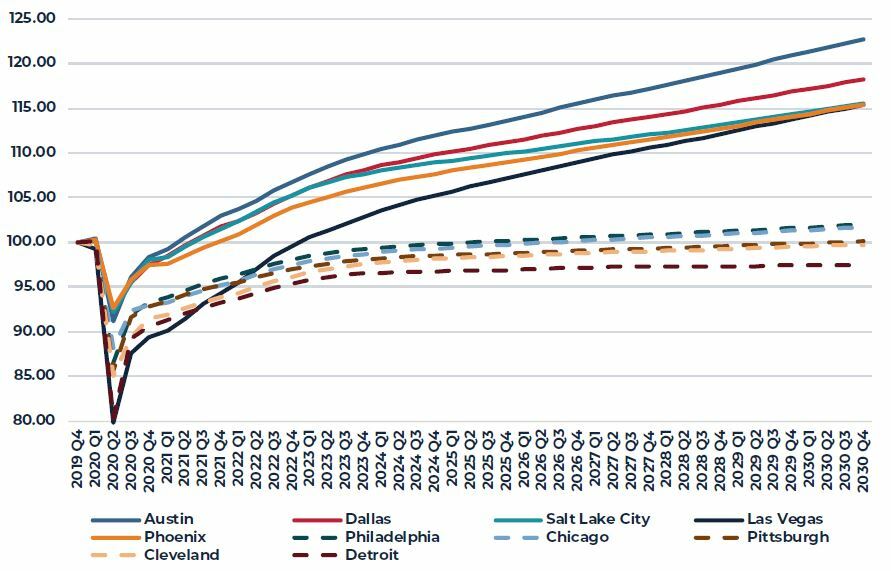
Source: Moody’s Analytics December 2020 Baseline
High-density urban centers with large daytime populations relative to resident population are particularly vulnerable to more prolonged recoveries. Post pandemic, if some share of daytime workers continue to work from home or only return to the office a few days a week, the absolute size of the various retailers and service providers supported by these workers will naturally be smaller. Said another way, these daytime workers have a high multiplier effect on the businesses that supported them prior to the pandemic.
Reflecting the likelihood of a highly variable recovery, fiscal and monetary policy remains extremely accommodating. Following on the heels of the delayed but ultimately delivered fiscal support during the final days of the last administration ($900 billion), the new administration is attempting to pass additional direct spending and other support ($1.9 trillion). At the same time, the Federal Reserve has indicated that it intends to keep the various economic support policies that it has enacted in place until the economy returns to full employment, which is generally interpreted as meaning no change in Federal Reserve policy until at least 2023. More significantly, Federal Reserve Chairman Powell announced in August that the Fed would no longer respond swiftly to inflation above 2% but would instead allow inflation to run above 2% for some future period to offset earlier periods where inflation had been below 2%. This attempt to re-center market inflation expectations at or slightly above 2% has had yielded a marked increase in the Treasury yield forward curve and a steepening of the overall yield curve.
FIGURE 3
TEN-YEAR TREASURY BOND FORWARD CURVE
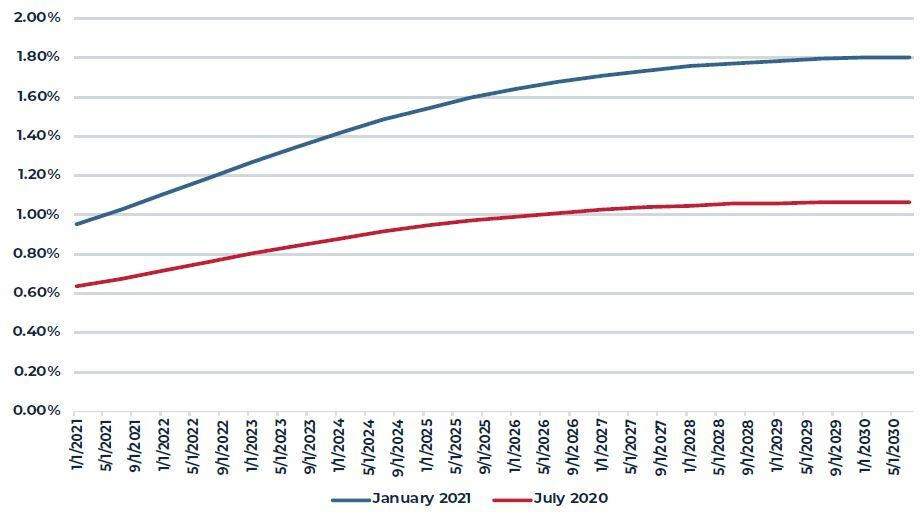
Source: Chatham Financial
U.S. Commercial Property
Despite the change in yield expectations since August, U.S. commercial property represents significant yield advantage to investors (see Figure 4). As of year end, the average NCREIF Property Index income yield was more than 300 basis points above the ten year Treasury bond yield but, more importantly, property yields were more than four times the level of the Treasury bond yield.
FIGURE 4
U.S. COMMERCIAL PROPERTY INCOME YIELD RELATIVE TO TREASURY YIELDS
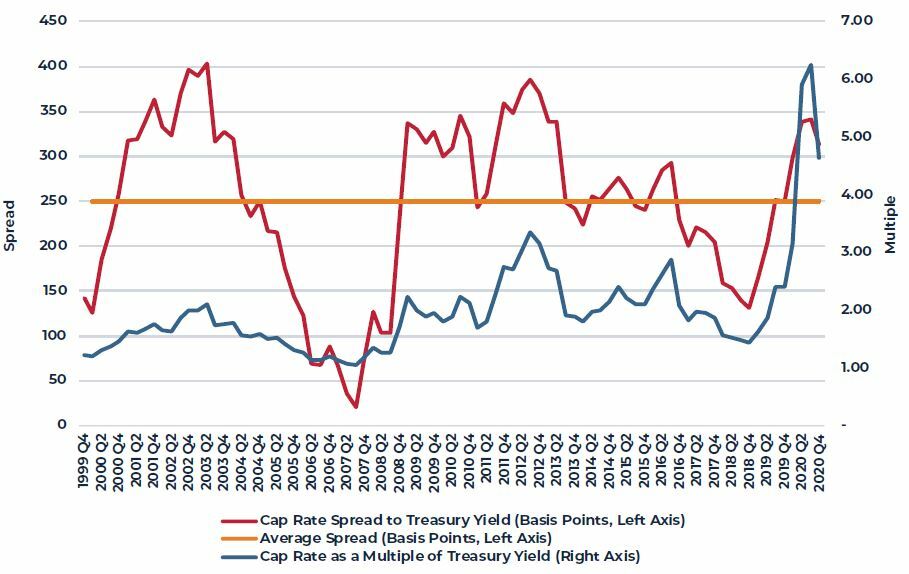
Source: Chatham Financial
Reflecting the relative attractiveness of U.S. commercial property pricing, private equity real estate funds have amassed significant dry powder capital, capital already committed but not yet invested. As of year end, Prequin reports more than $200 billion committed to North American funds, predominantly targeting the U.S. market. More significantly, more than 80% of this capital is earmarked for opportunistic, value-added and debt funds that are typically finite life and finite investment period vehicles. This suggests that much of this capital will be put to work in the market over the next 2-3 years.
FIGURE 5
DRY POWDER CAPITAL COMMITTED TO PRIVATE EQUITY CRE FUNDS IN NORTH AMERICA
(IN BILLIONS)
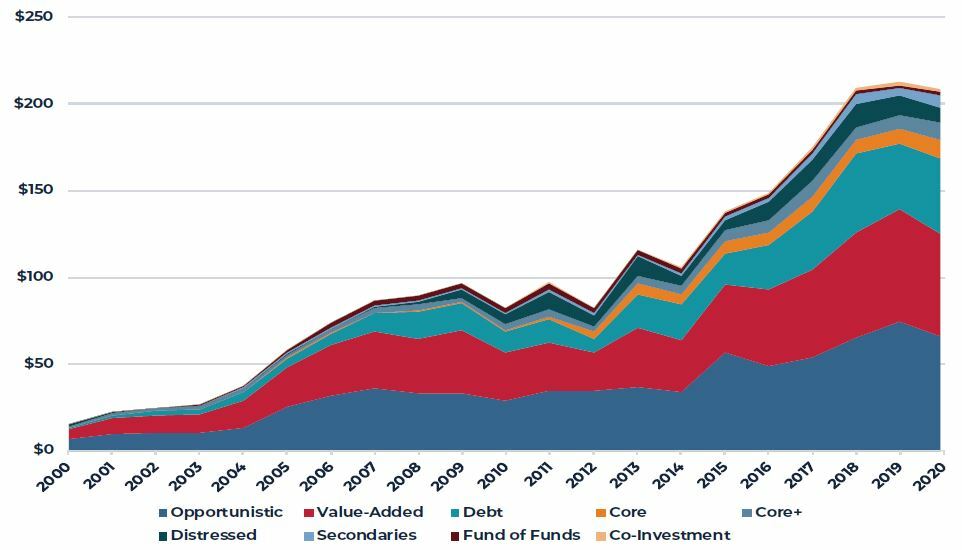
Source: Prequin
Total property transaction volume during 2020 was roughly one-third lower than 2019 as physical travel restrictions, heightened cash flow uncertainty and other pandemic-related factors combined to stymie market participants. Given the large stockpile of capital waiting to be invested, we expect aggregate transaction volumes to quickly return to levels comparable to or greater than recent years.
Near-term investment conviction will likely remain low in situations where the property income is uncertain. This remains the case in hotels, regional malls, some other retail formats and certain office properties. Conviction remains much higher in most industrial properties and, to a lesser degree, apartments and in these cases, pricing may well exceed pre-pandemic levels. Reflecting this, the most recent investor consensus survey suggests continued appreciation in industrial and apartment properties over the next five years largely offset by valuation declines in certain retail and office properties.
FIGURE 6
TOTAL U.S. CRE TRANSACTION VOLUME BY YEAR (IN BILLIONS)
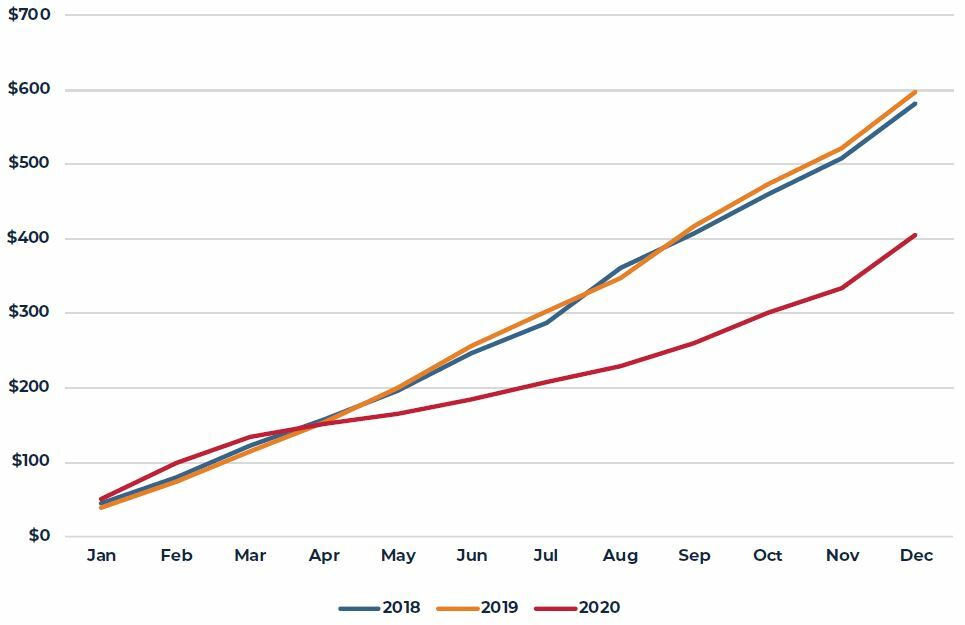
Source: Real Capital Analytics (RCA)
TABLE 1
2020 U.S. TRANSACTION VOLUME BY PROPERTY TYPE RELATIVE TO 2018 AND 2019
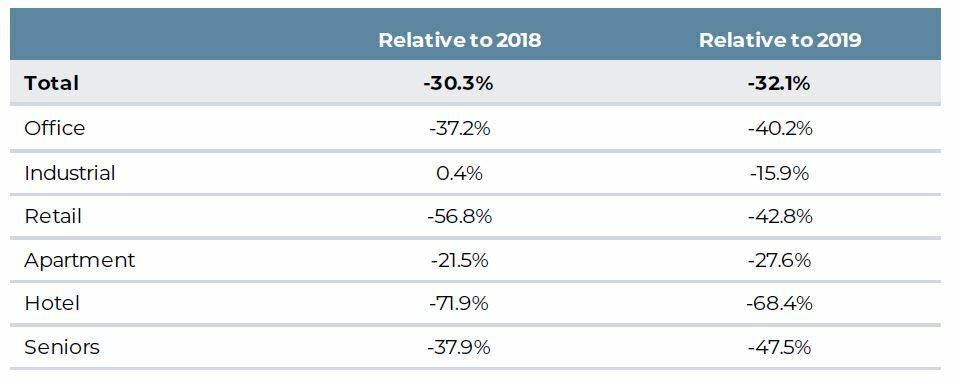
Source: Real Capital Analytics (RCA)
Office
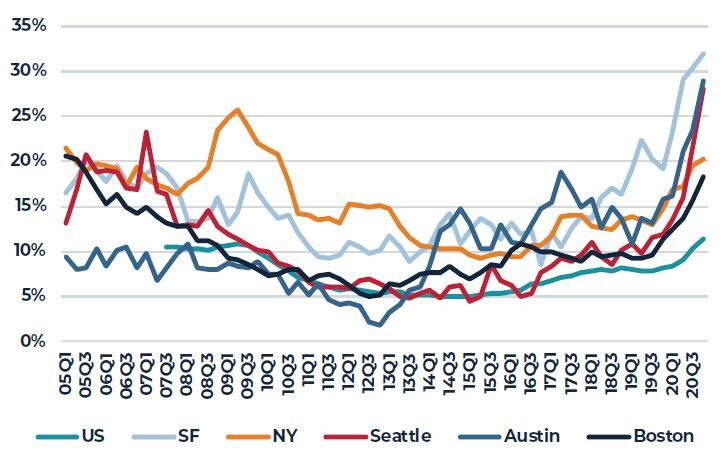
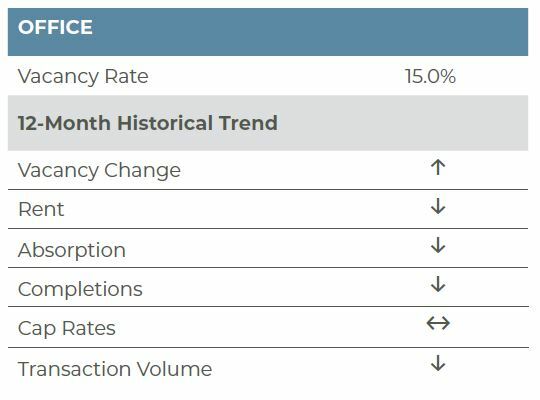
We are almost a year into the pandemic and the impacts on the office sector from work from home (WFH) persist. In some cases too, the rollback of reopening plans has exacerbated the pain in the sector. According to CBRE-EA, office vacancies rose to 15.0% in the fourth quarter of 2020, an increase of 90 basis points (bps) from the previous quarter and 280 bps from the prior year. Overall, vacancies are now at their highest level since mid-2013 and are only 180 bps below the peak of the Great Financial Crisis (G.F.C.). More troubling, however, is that vacant sublet space now totals 11.3% of all vacant space, eclipsing the GFC high of 10.8%. Performance varies greatly across markets, with dense, urban markets with a strong high-tech presence showing greater weakness. Indeed, vacant sublease space as a share of total vacant space exceeds 15% in San Francisco (32.0%); Austin (28.9%); Seattle (27.9%); New York (20.3%); Oakland (19.7%); Boston (18.3%); and San Jose (18.3%). Meanwhile, many markets in the southeast and southwest, which are essentially driving markets and are therefore not affected by the pandemic as it relates to public transportation, are faring significantly better. Miami (4.8%); Houston (5.4%); West Palm Beach (6.2%); Phoenix (6.5%); Fort Lauderdale (6.9%); Orlando (8.4%); and Dallas (8.4%) all are reporting vacant sublet square feet as a share of total vacant square feet of less than 9%.
With the rollout of the vaccine currently upon us, there is a light at the end of the tunnel for the office sector. At the onset of the pandemic, it was feared that workers may never return to the office as WFH was fully embraced and showed great success and promise. That said, WFH fatigue is setting in and it is now clear that some tasks are more productively completed in the office. Further, people, at the end of the day, are social creatures by nature and the impact of WFH on company culture cannot be understated. Overall, the current assumption is now that WFH will take on a hybrid model, with a portion of the work week taking place remotely and a portion in office. We expect few workers will work 100% remotely; instead, a larger percentage of workers will return to the office but dedicate part of their time to remote work. Indeed, according to a recent study of office occupiers from CoreNet Global and Cushman & Wakefield, roughly 10% of workers are expected to work remotely 100% of the time post-pandemic, 10% are expected to be in the office full-time while 80% are expected to split time between the office and WFH. The hybrid shift is a notable one, pre-pandemic only 30% of occupiers espoused the hybrid model. The gain in the hybrid model is overwhelmingly due to a reduction in the ‘full-time office’ workplace model, which stood at 58% pre-pandemic. Translating this shifting dynamic into office fundamentals is tricky as office density post-pandemic is somewhat unclear. First, it is conceivable that density, which has been on an upward trend for some time, could reverse somewhat to allow for greater social distancing. Second, the question of whether hybrid workers will have dedicated office space or will be subject to desk ‘hoteling’ remains unanswered. If we are entering a new world with more contagious diseases and viruses one could argue ‘hoteling’ may be a thing of the past and the impact of greater hybrid work will not be as great. Overall, AEW has modeled these impacts and there is significant variation in office performance based on the assumptions used. Our base case outlook, however, likely suggests a 15% reduction in office demand in the coming years. The impact on the sector will not be immediate, however, given the weighted-average lease term of seven years that persists in the market today. Moreover, future job growth will also offset some of the demand lost to WFH. The bottom line, however, is that double-digit vacancies are likely to persist for some time, limiting future rent growth. As we have stated in the past, however, in a post-COVID environment, performance will be bifurcated with the best properties, with the most up- to-date mechanical and HVAC systems, open concepts with better ventilation and access to amenities will outperform older, more commodity properties.
FIGURE 7
COVID-Induced Occupier Changes
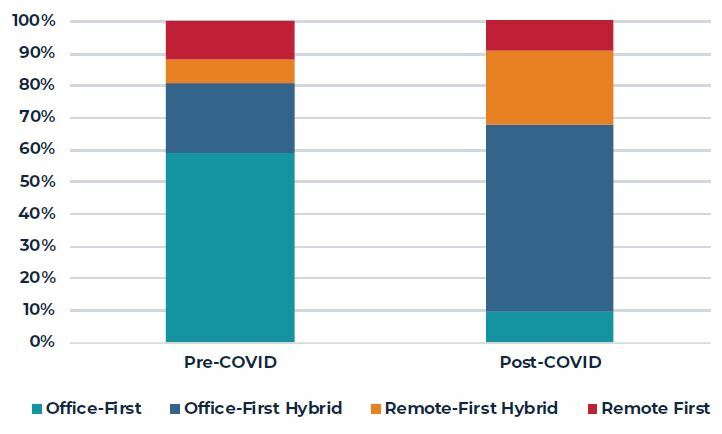
Source: CoreNet Global and Cushman & Wakefield
FIGURE 8
OFFICE SUBLET CONDITIONS ARE WORSE THAN THE GFC
(Sublet Vacant SF as a Share of Total Vacant SF)
Source: CBRE-EA
Apartment
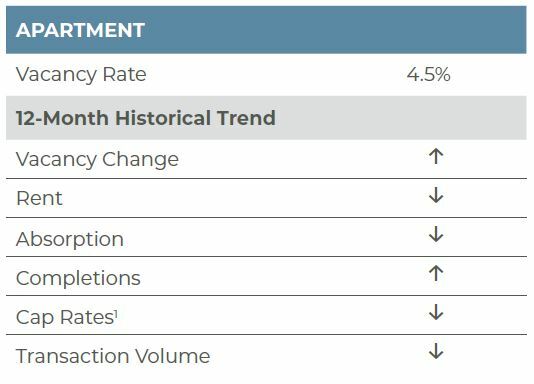
According to CBRE-EA, the national apartment market vacancy rate was 4.5% as of the fourth quarter of 2020. This is an increase of 40 basis points (bps) year-over-year (YOY) and 10 bps on the quarter. Although the vacancy rate has increased, it is still outperforming its historical average of 5.1% over the last 15 years. While the COVID-19 pandemic has certainly had a negative impact on the national apartment market, this shock has not been as detrimental as the G.F.C., when the U.S. vacancy rate increased from 6.3% to 7.2% in FY 2009. With effective vaccines developed, albeit a slow logistical roll-out, the apartment sector will likely see a few more months of slowed demand until urban centers begin to reopen midway through 2021. The new Biden administration is passing economic stimulus, prompting economic recovery and supporting a positive outlook for the multifamily sector.
The national increase in vacancies was not consistent across markets. In fact, CBRE-EA’s Preliminary Flash Report states that of their 66 tracked markets, 35 markets reported a YOY vacancy rate decrease this quarter while 28 markets experienced an increase in vacancies and three markets maintained the same vacancy rate. However, the magnitude of the change was varied, with the largest increase in vacancies (San Francisco, up 330 bps YOY) considerably greater than the largest decrease in vacancies (Albuquerque and Riverside, both down 170 bps YOY). As seen in the previous quarter, markets with a high cost of living and high densities still saw some of the largest vacancy increases in the fourth quarter, such as San Francisco (330 bps); San Jose (230 bps); New York (120 bps); Boston (120 bps); and Washington, DC (110 bps). The ability to work from home and the newly limited cultural experiences in cities has attracted renters to less dense markets where rent is less expensive. Nine metros appear to have benefited from this shift, reporting a dip in vacancies of 100 bps or more, including Albuquerque (-170 bps); Riverside (-170 bps); Oxnard (-130 bps); Las Vegas (-120 bps); Memphis (-120 bps); Providence (-120 bps); Tucson (-100 bps); and El Paso (-100 bps). Of note, sunbelt markets are outperforming traditional gateway markets; again, this is reflective of the ability to work from anywhere and movement towards lower cost and less dense markets.
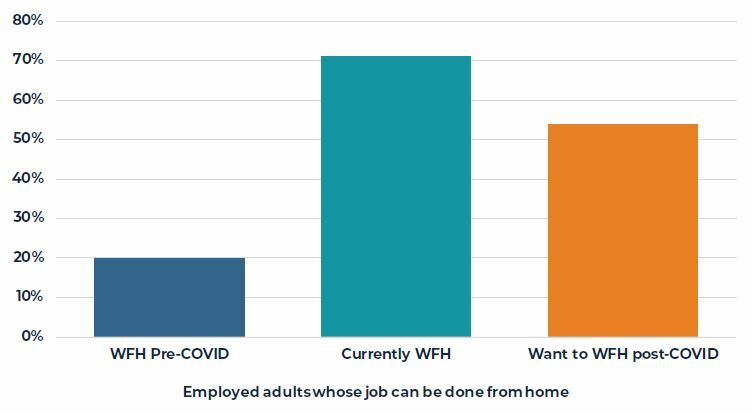
The COVID-19 pandemic has increased the need for at-home working, learning, and entertainment, impacting multifamily trends. Per National Real Estate Investor, renters are preferring amenities that address the era of lockdowns and social distancing, with access to outdoor space, high-speed internet, and extra room for their home offices or their children’s online schooling taking priority. Per the U.S. Census Bureau, 65.3% of households with children reported using online learning this year, as virtual and hybrid teaching has become more prevalent. According to the Pew Research Center, 71% of employed adults who say their job can mostly be done mostly from home are currently teleworking all or most of the time, up from 20% pre-pandemic. Of that same group, 54% report that if given the option, they would continue teleworking all or most of the time even after the pandemic. High-speed internet, already important, has now become a necessity in order for workers to take video calls at home, with Pew reporting that 81% of teleworkers use video conferencing. Properties that can meet the needs of remote working and learning will be at a competitive advantage.
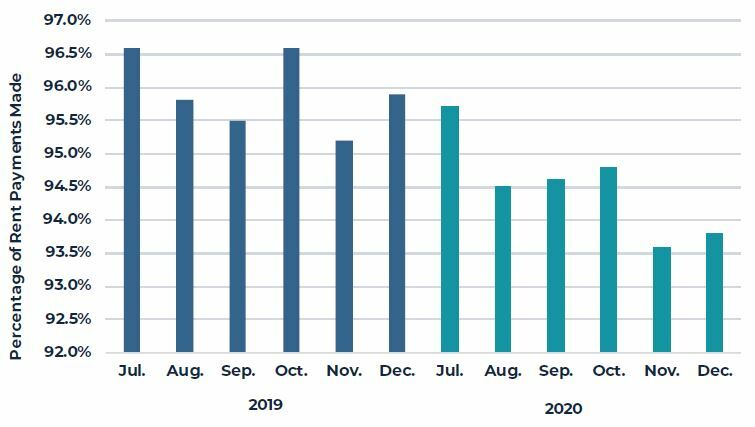
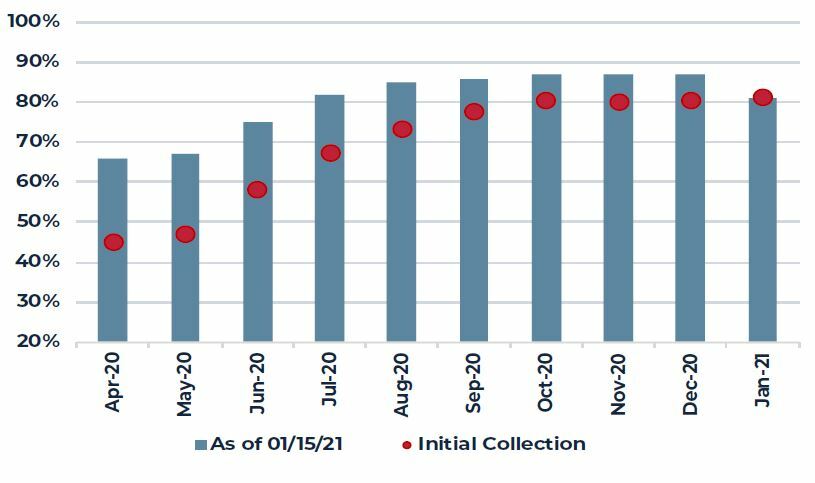
The apartment rent collection rate has dipped slightly, as seen in the chart on the following page. NMHC reports that as of January 20, 2021, 88.6% of apartment households have paid rent. This is 2.5 percentage points below the rent payment share collected by January 20, 2020. The rent collection rate should be monitored moving forward; however, the recently passed federal COVID-19 stimulus includes $25 billion for rental assistance plus additional funding for unemployment insurance, which should support ongoing rent collection rates and economic recovery.
FIGURE 9
U.S. TELEWORK TRENDS
Source: Pew Research Center
FIGURE 10
END OF MONTH RENT COLLECTION RATES
Source: NMHC
Industrial
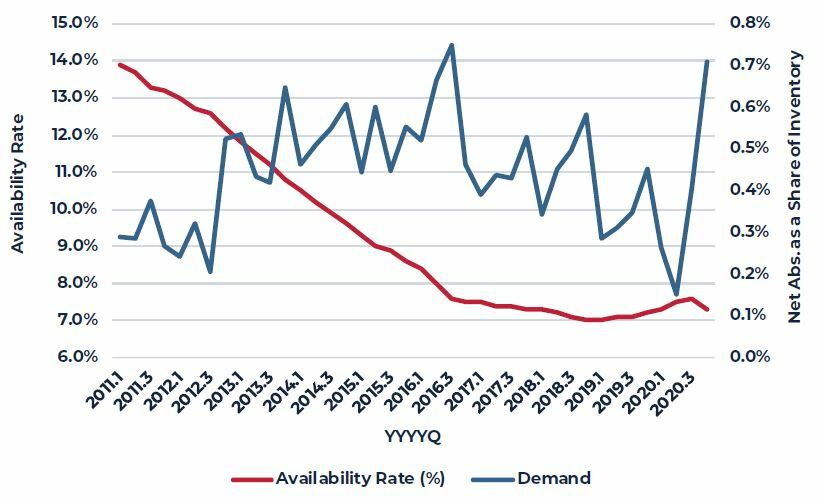
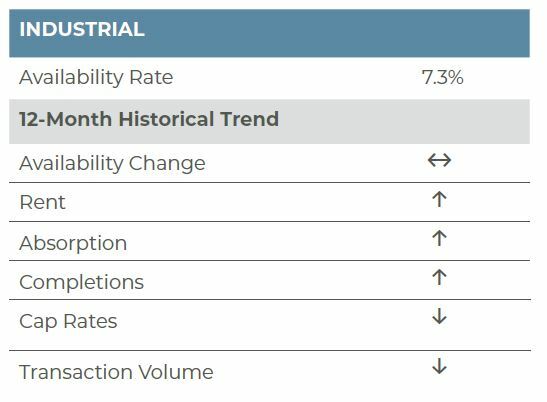
The industrial sector continued to perform well into the fourth quarter, with its robust fundamentals largely insulated from the current economic downturn resulting from the COVID-19 pandemic. Per CBRE-EA, the U.S. industrial availability stood at 7.3% in the fourth quarter, down 30 bps from the prior quarter and up just 10 bps year-over-year (YOY), which is impressive given the economic conditions seen in 2020. The sector’s availability rate has been trending downwards for several years and is well below its historical average of 9.7%, tracked since the first quarter of 1989. The historical average availability rate pre-2014 was 10.1%; since 2014Q3, no quarter has even seen an availability in the double digits. Net absorption this quarter totaled 104.0 million square feet (msf), the highest quarterly demand seen since the first quarter of 2001 and the first quarter to surpass 100.0 msf of absorption in the last four years. Full-year net absorption in 2020 (223.6 msf) was up nearly 12% from 2019 (200.0 msf).
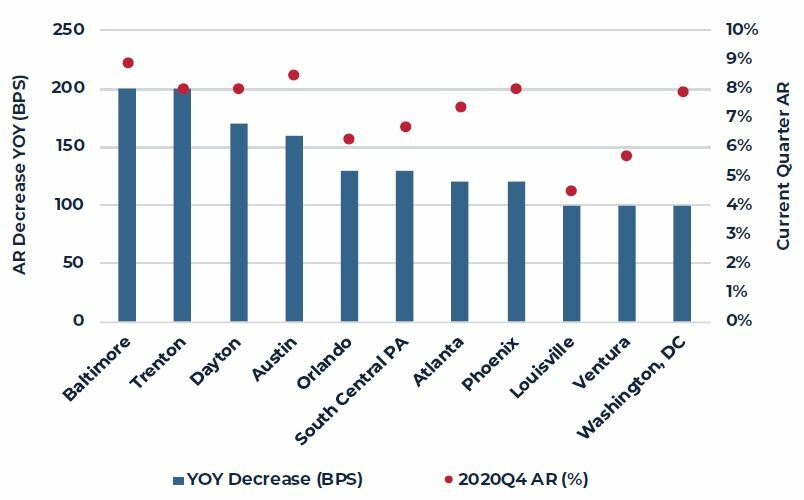
Of the 63 industrial markets tracked by CBRE-EA, 34 markets reported improving or steady availability in 2020. Baltimore (-200 bps), Trenton (-200 bps), Dayton (-170 bps), and Austin (-160 bps) saw the greatest improvements in availability YOY. Only 17 markets saw an increase in availability of 50 bps or more; Houston (270 bps), San Jose (250 bps), San Francisco (250 bps), and Las Vegas (240 bps) saw the largest increases in availability YOY. Demand was strong and widespread across the nation with 19 markets reporting quarterly demand of 1.0% or more as a share of inventory. This quarter, U.S. demand as a share of inventory was 0.7%, the highest share seen since 2016Q3. Overall, in the fourth quarter, industrial demand was meaningfully negative in just one market: Detroit, with –0.5% of inventory. For the year, only Portland (-2.2%), Honolulu (-1.4%), Long Island (-0.9%), San Francisco (-0.6%), San Jose (-0.6%), and Detroit (-0.5%) reported meaningfully negative demand.
The national industrial market has been bolstered by e-commerce growth, which is supporting demand for industrial space, especially by retail trade and manufacturing tenants. CoStar reports 281.7 msf of leasing in the fourth quarter with Amazon once again being the most active lessee. In the quarter, Amazon accounted for nearly 5% of new leases, while Lowe’s, Rite Aid, and Iron Mountain each accounted for roughly 1% of new leases. As a result of stay-at-home orders, consumption of goods in the U.S. has gone up, since spending opportunities on services are limited. According to Green Street Advisors, e-commerce sales are up by roughly 32% in 2020. The online sales penetration rate, or the share of total retail sales made up by e-commerce, has increased by 100 to 150 bps over the last decade but has increased by around 450 bps just this year, now attaining 15% penetration. E-commerce penetration has reached new highs particularly for sporting goods, books and music stores, electronics & appliances, and apparel, with 54%, 51% and 44% of all retails sales for the category done online, respectively.
In regards to the ongoing outlook, the industrial sector will benefit from the economic recovery that is beginning. Moody’s reports that as of January 21st, 8.3% of the U.S. population age 16 and older had received at least one shot of the COVID-19 vaccine, with 1.2% of the population already receiving their second dose. The average daily count for U.S. vaccinations is approaching 1.0 million per day, which would help drop the transmissions rate, increase the share of population inoculated at a faster clip, and allow metros to begin re-opening and rebuilding their economy. While consumers will likely return to stores, restaurant, etc., we expect industrial demand will remain strong, driven not just by e-commerce users but also by retailers looking to expand their distribution networks to compete with online retailers.
FIGURE 11
U.S. INDUSTRIAL DEMAND
Source: CBRE-EA
FIGURE 12
TOP AVAILABILITY RATE IMPROVEMENTS FY2020
Source: CBRE-EA
Retail
The post-holiday surge in COVID-19 infections continues to delay reopening and a subsequent return to normal for the retail sector. Total retail availability remained elevated at 6.6% in the fourth quarter of 2020, flat quarter-over-quarter, but up 40 basis points (bps) year-over-year (YOY). While total retail availability still remains well below the record high of 9.9% during the G.F.C., performance by retail subtype varies greatly. Indeed, the lifestyle & mall (L&M) sector, which was notably weak pre-pandemic, continues to bear the brunt of weakness associated with the pandemic. In the fourth quarter of 2020, L&M availability stood at 6.4%, up 90 bps YOY and only 20 bps shy of the GFC-historical high. Meanwhile, power center (PC) availability edged up 10 bps from the previous quarter and 50 bps YOY; PC availability, however, remains 150 bps below the GFC high. Finally, neighborhood and community shopping center (NCSC) availability was flat on the quarter at 9.4%, but was up 80 bps YOY. NCSC availability, like the PC sector and overall retail availability, remains comfortably below the GFC-high of 13.0%.
The sole cause of rising availability is weak demand, as 2020 total retail completions was the lowest on record, per CBRE-EA. On the demand side, however, roughly 12.4 million square feet (msf) of retail space was returned to the market, only the second time annual demand was negative, with the first being 2009 when 26.6 msf was returned to the market. To put demand conditions into perspective, in the 15 years leading up to 2020, net absorption averaged 76.3 msf annually. Weak demand is not the only immediate concern for the retail sector as rent collections remain the lowest among the four core property types. Per NCREIF, retail rent collections stood at only 81.2%, more than 10 percentage points below all other property types and while it is an improvement from the initial shutdown, collections have remained stubbornly stuck around 80%. Per Green Street rent collections in (2020Q3) remained weakest in the entertainment (~40%), fitness (~65%), personal services (~78%), apparel (~80%) and restaurant (~80%) sectors; in comparison, collections among pet stores, grocery/drugstores, banks and home improvement stores were essentially 100%, while home décor and medical collections stood at roughly 90%-95%. We fully expect 2020Q4 data on rent collections by sector to be similar.
Still, it is impossible to ignore the fact that the retail sector’s struggles began pre-pandemic and the pandemic has only intensified issues in the sector. Changing consumer preferences with respect to online shopping and actual visits to a physical store, competition within the apparel sector due to a proliferation of value-oriented retailers and financial stress among department stores were challenges that weighed on the sector pre-pandemic, particularly impacting the L&M segment of the market. That said, the hardest hit sectors to date during the pandemic are entertainment, fitness, personal services and restaurants, which were the darlings of retail tenancy pre-pandemic. Near-term, these sectors and, subsequently, the NCSC segment of the market, will likely benefit from the recent stimulus package passed at year-end. The stimulus bill included $285 billion in additional small business Paycheck Protection Program (PPP) funds. The PPP loans associated with the December bill have stricter terms and specifically target smaller mom and pops, like restaurants and personal service providers that typically are inline tenants at NCSC properties. The bill specifically restricts borrowers to businesses with fewer than 300 employees that have experienced at least a 25% drop in sales YOY for at least one quarter and precludes publicly-traded companies from receiving loans. Thus, the bulk of L&M tenants will likely be excluded from partaking in the PPP program as the restaurant, entertainment and smaller shop tenants in L&M properties tend to be large, national retailers with greater than 300 employees and/or are publicly-traded companies. The ongoing vaccine rollout, however, offers light at the end of the tunnel; however, widespread vaccination of the U.S. population is unlikely to happen until late 2021. Thus, 2021 will be another tough year for retail, followed by the beginning of a slow and modest recovery in 2022 and beyond. The challenges that existed in the sector pre-pandemic, e-commerce competition and financial instability among retailers, have yet to be solved and this will weigh on the sector’s long-term prospects. As such, we expect retail performance to trail that of industrial and apartments. Within the retail sector, we expect NCSC to outperform L&M in the near-term.
FIGURE 13
NCREIF RENT COLLECTIONS
Source: NCREIF
FIGURE 14
ESTIMATED RENT EXPOSURE TO COVID-SENSITIVE TENANTS
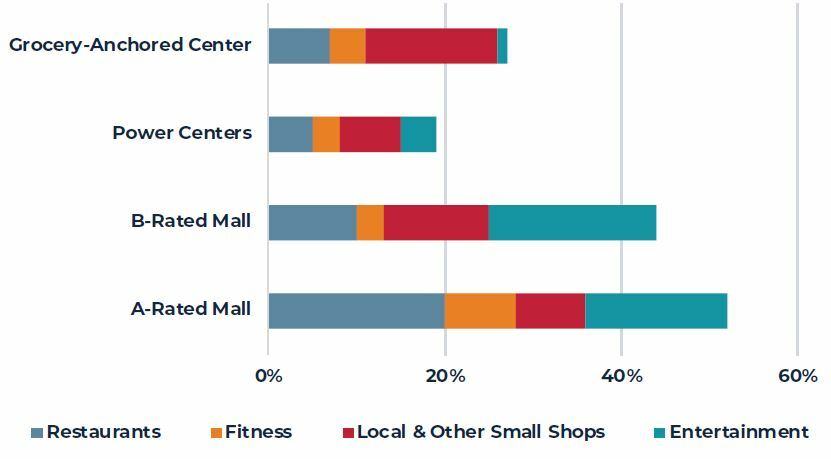
Source: Green Street Advisors
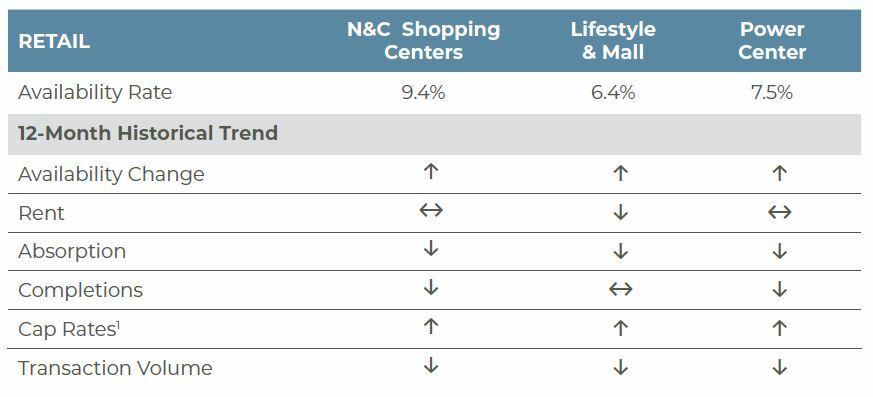
1NCREIF cap rates are lower due to weaker NOI; however, Real Capital Analytics transaction cap rates are flat.
Capital Markets
Transaction activity continued to recover in the fourth quarter of the year. Roughly $145.4 billon in properties changed hands in the quarter, nearly triple the second-quarter COVID trough and roughly double the third-quarter volume. While fourth-quarter transaction volume remained 19% and 16% below the 2019Q4 and 2018Q4 levels, respectively, the most recent quarterly transaction total was nearly 10% ahead of 2017Q4 trades and was on par with 2016Q4. Further, we expect volume will pick up in 2021, particularly as the vaccine continues to be rolled out, allowing for safer travel and greater property tours, and as closed-end fund investors are pressured to get investment dollars out.
As was the case in the third quarter, the apartment and industrial sectors accounted for the bulk of transaction volume, representing 39% and 25% of trades in the quarter, respectively. The share of office and retail transaction volume was similar to the prior quarter as well at 19% and 8%. Development sites (4%), hotel (3%) and seniors housing (2%) reported minimal activity; indeed, the three aforementioned sectors accounted for only $13 billion in volume. Hotel volumes were down 67%, while seniors housing transactions were down 52% year-over-year (YOY). Likewise, office and retail transaction activity was down 35% and 42% YOY; in contrast, industrial activity was down a mere 2% and apartment transaction volume was on par with a year ago. The difference in executed sales of course is related to conviction in NOIs and cash flows; buyers remain wary of properties where the income stream is uncertain.
The steady recovery in transaction volumes was accompanied by an acceleration in price growth. According to the Real Capital Analytics, the National All-Property Commercial Property Price Indices (CPPI) increased 7.3% YOY in December, nearly a 5 percentage point acceleration from the spring low and the largest gain since November 2018. The apartment and industrial sectors continued to outperform with the respective sector CPPIs increasing 8.3% and 8.8% YOY; of note, however, is the fact that the apartment CPPI accelerated from 7.6% YOY growth in September while industrial price growth moderated from 9.1% in September. Meanwhile, CBD and suburban office pricing increased modestly to 2.2% and 1.3%, respectively, while retail continued to post YOY declines in pricing (-4.3%). By market segment, price appreciation in non-major markets is far outpacing major market appreciation. The non-major market CPPI advanced 7.8% in December 2020 YOY, the largest YOY gain since early 2019, while the major market CPPI (Boston, Chicago, Los Angeles, New York, San Francisco and Washington, DC) grew 3.7% YOY. The major market CPPI growth has picked up since the spring; however, it is notably slower than the roughly 5.6% growth reported in in 2019.
NCREIF return performance mimicked the CPPI, the industrial (4.68%), apartment (0.99%) and office (0.48%) sectors reported a positive quarterly total return while retail reported a negative quarterly return (-1.24%). The annual return performance ranking is identical to the quarterly ranking. The industrial (11.78%) sector, however, far outperformed all other sectors and was the only sector to report appreciation in the year. The 2020 apartment return totaled 1.83% with a 3.91% income return and 2.02% depreciation. Likewise, the total and income returns for office tallied 1.57% and 4.39% while the appreciation return was –2.73% for the year. Retail was notably weaker with a negative total return of –7.48%; depreciation of 11.17% was partially offset by an income return of 4.03%. All retail subtypes reported meaningful depreciation; however, the capital value corrections in the super-regional and regional subtypes were at least 5 percentage points greater than all other subtypes.
NCREIF cap rate movements were modest quarter over quarter, with the largest change being a 16 bps decline in the apartment sector to 4.0%. Of note, however, the reduction in cap rates in the apartment sector is likely related to the 5% NOI decline in the quarter. Industrial cap rates stood at 4.65%, down four bps from 2020Q3; office cap rates were flat at 4.84% while retail cap rates dropped to 4.80%, an eight bps decline from the third quarter.
Going forward, we do not expect any significant movements in cap rates in the near term, with the possible exception of non-gateway industrial markets, which may decline modestly. The PREA Consensus Survey continues to expect outperformance from the industrial and apartment sectors with annualized returns of 8.2% and 5.8% over the 2020-2024 period, respectively, both outpacing the 5.1% expected NPI return. Office and retail returns are expected to lag with annualized returns of 4.2% and 1.5% over the same period; of note, both sectors are expected to post minimal or negative returns in 2021 before improving in 2022 and beyond.
FIGURE 15
TRANSACTION VOLUME & PRICING

Source: Real Capital Analytics
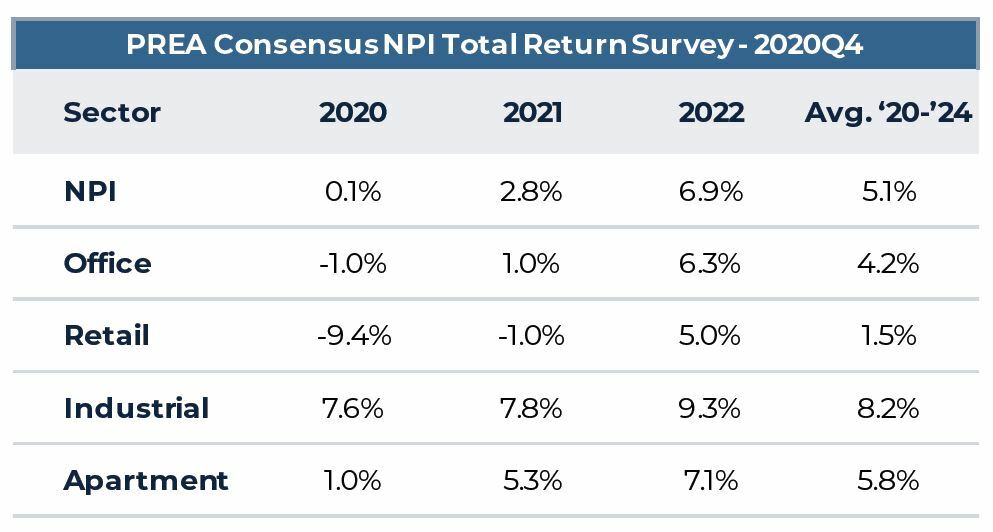
Source: PREA
This material is intended for information purposes only and does not constitute investment advice or a recommendation. The information and opinions contained in the material have been compiled or arrived at based upon information obtained from sources believed to be reliable, but we do not guarantee its accuracy, completeness or fairness. Opinions expressed reflect prevailing market conditions and are subject to change. Neither this material, nor any of its contents, may be used for any purpose without the consent and knowledge of AEW.