“The only thing worse than being blind is having sight but no vision.”
Helen Keller
Late Cycle or Long Cycle?
By any conventional measure, the current recovery and expansion phase of the U.S. business cycle is the longest in the nation’s history. This naturally leads many to conclude that the economy, and by extension property markets, must be “late cycle” with an inevitable downturn just around the corner.
Figure 1: Length in Months of Trough to Peak Portion of U.S. Business Cycles
Source: National Bureau of Economic Research (NBER)
The Business Cycle Dating Committee of the National Bureau of Economic Research (NBER) is the official arbiter of when a recession begins and ends. When measuring the length of a business cycle, this group typically looks at periods of peak-to-trough and trough-to-peak movement and, by these measures, the current cycle is extraordinarily long, 126 months of growth as of year-end 2019 (see Figure 1). When we look at U.S. business cycles in this context, we do indeed see a current cycle that looks overdue for a downturn. Figure 2 shows total employment in the U.S. indexed to equal 100 at the beginning of each of the past five recessions and the current business cycle appears to be still powering along well past the point that any prior cycle had turned down. What is also notable in Figure 2 is the much longer amount of time it took in the current cycle to recover to a value of 100. In other words, to regain the jobs lost in the downturn – nearly 80 months compared with only 50 months in the early 2000’s cycle.
“Prediction is very difficult, especially about the future.”
― Niels Bohr1
Figure 2: Total Employment in U.S. Business Cycles
Index =100 at Beginning of Recession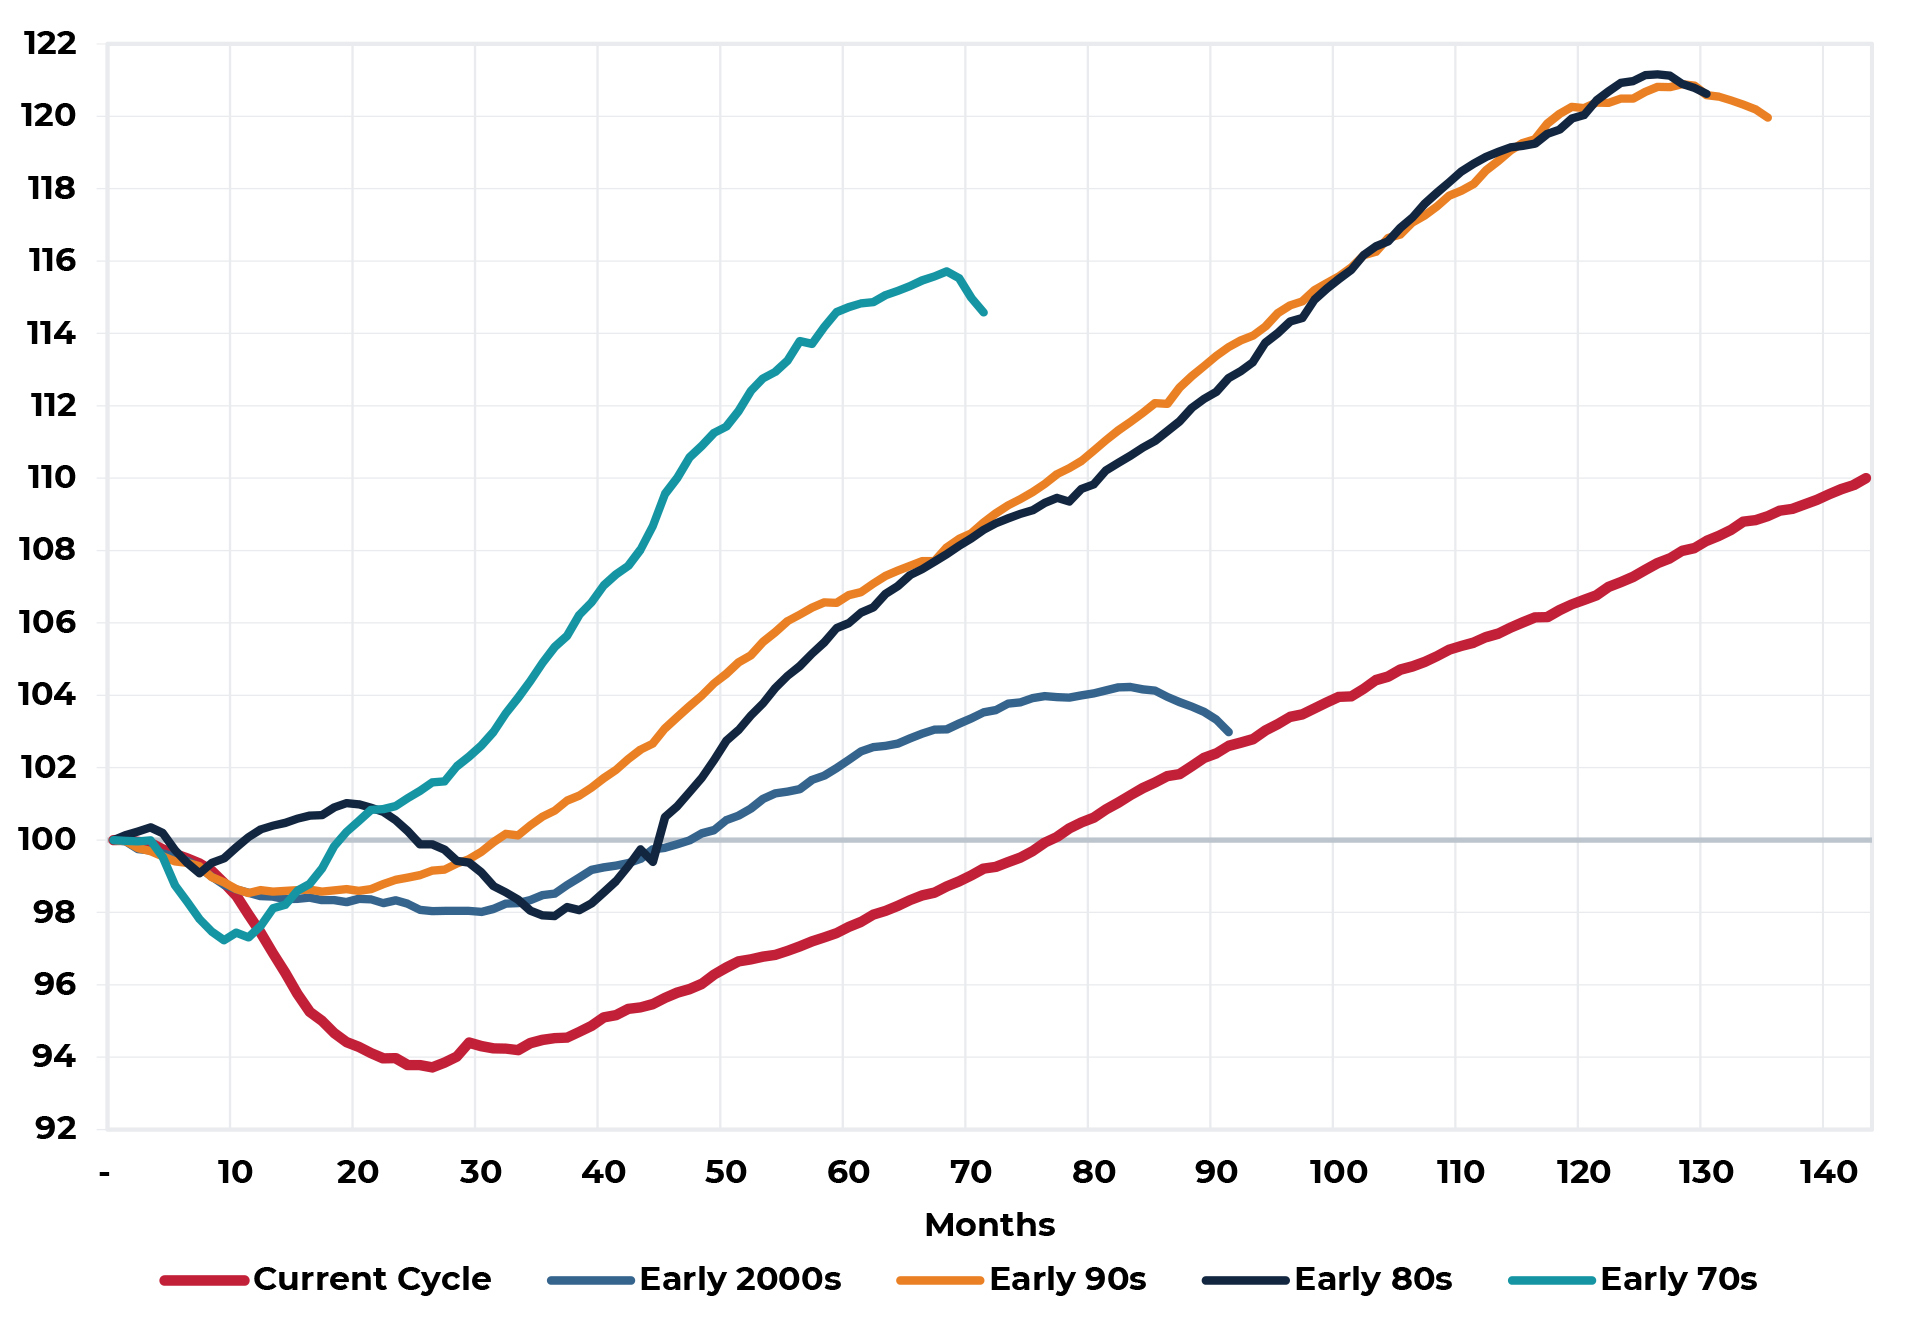
Sources: Bureau of Labor Statistics (BLS), National Bureau of Economic Research (NBER)
If we re-orient how we look at cycles and start the measurement clock at the point where the economy had returned to the pre-recession peak and look only at the true expansion portion of the cycle, we may reach a much different conclusion regarding the late cycle or long cycle nature of the current period. Figure 3 does exactly this by indexing total employment to equal 100 at the beginning of the expansion period, the point at which all lost jobs were regained. In this context, the current expansion is relatively immature, especially when compared with the expansion phases of the 1980s and 1990s. The obvious take away from this alternative way of looking at business cycles is that there is no reason to believe the current expansion needs to end for any age of cycle rationale. As with the economy, so too for the nation’s property markets. Slow and steady economic growth has been extremely supportive of commercial property fundamentals, while the accompanying low inflation and low interest rates of slow growth have been wildly supportive of property pricing. As these conditions continue, so too should healthy property and capital markets.
Figure 3: Total Employment in U.S. Business Cycles
Index =100 at Beginning of Expansion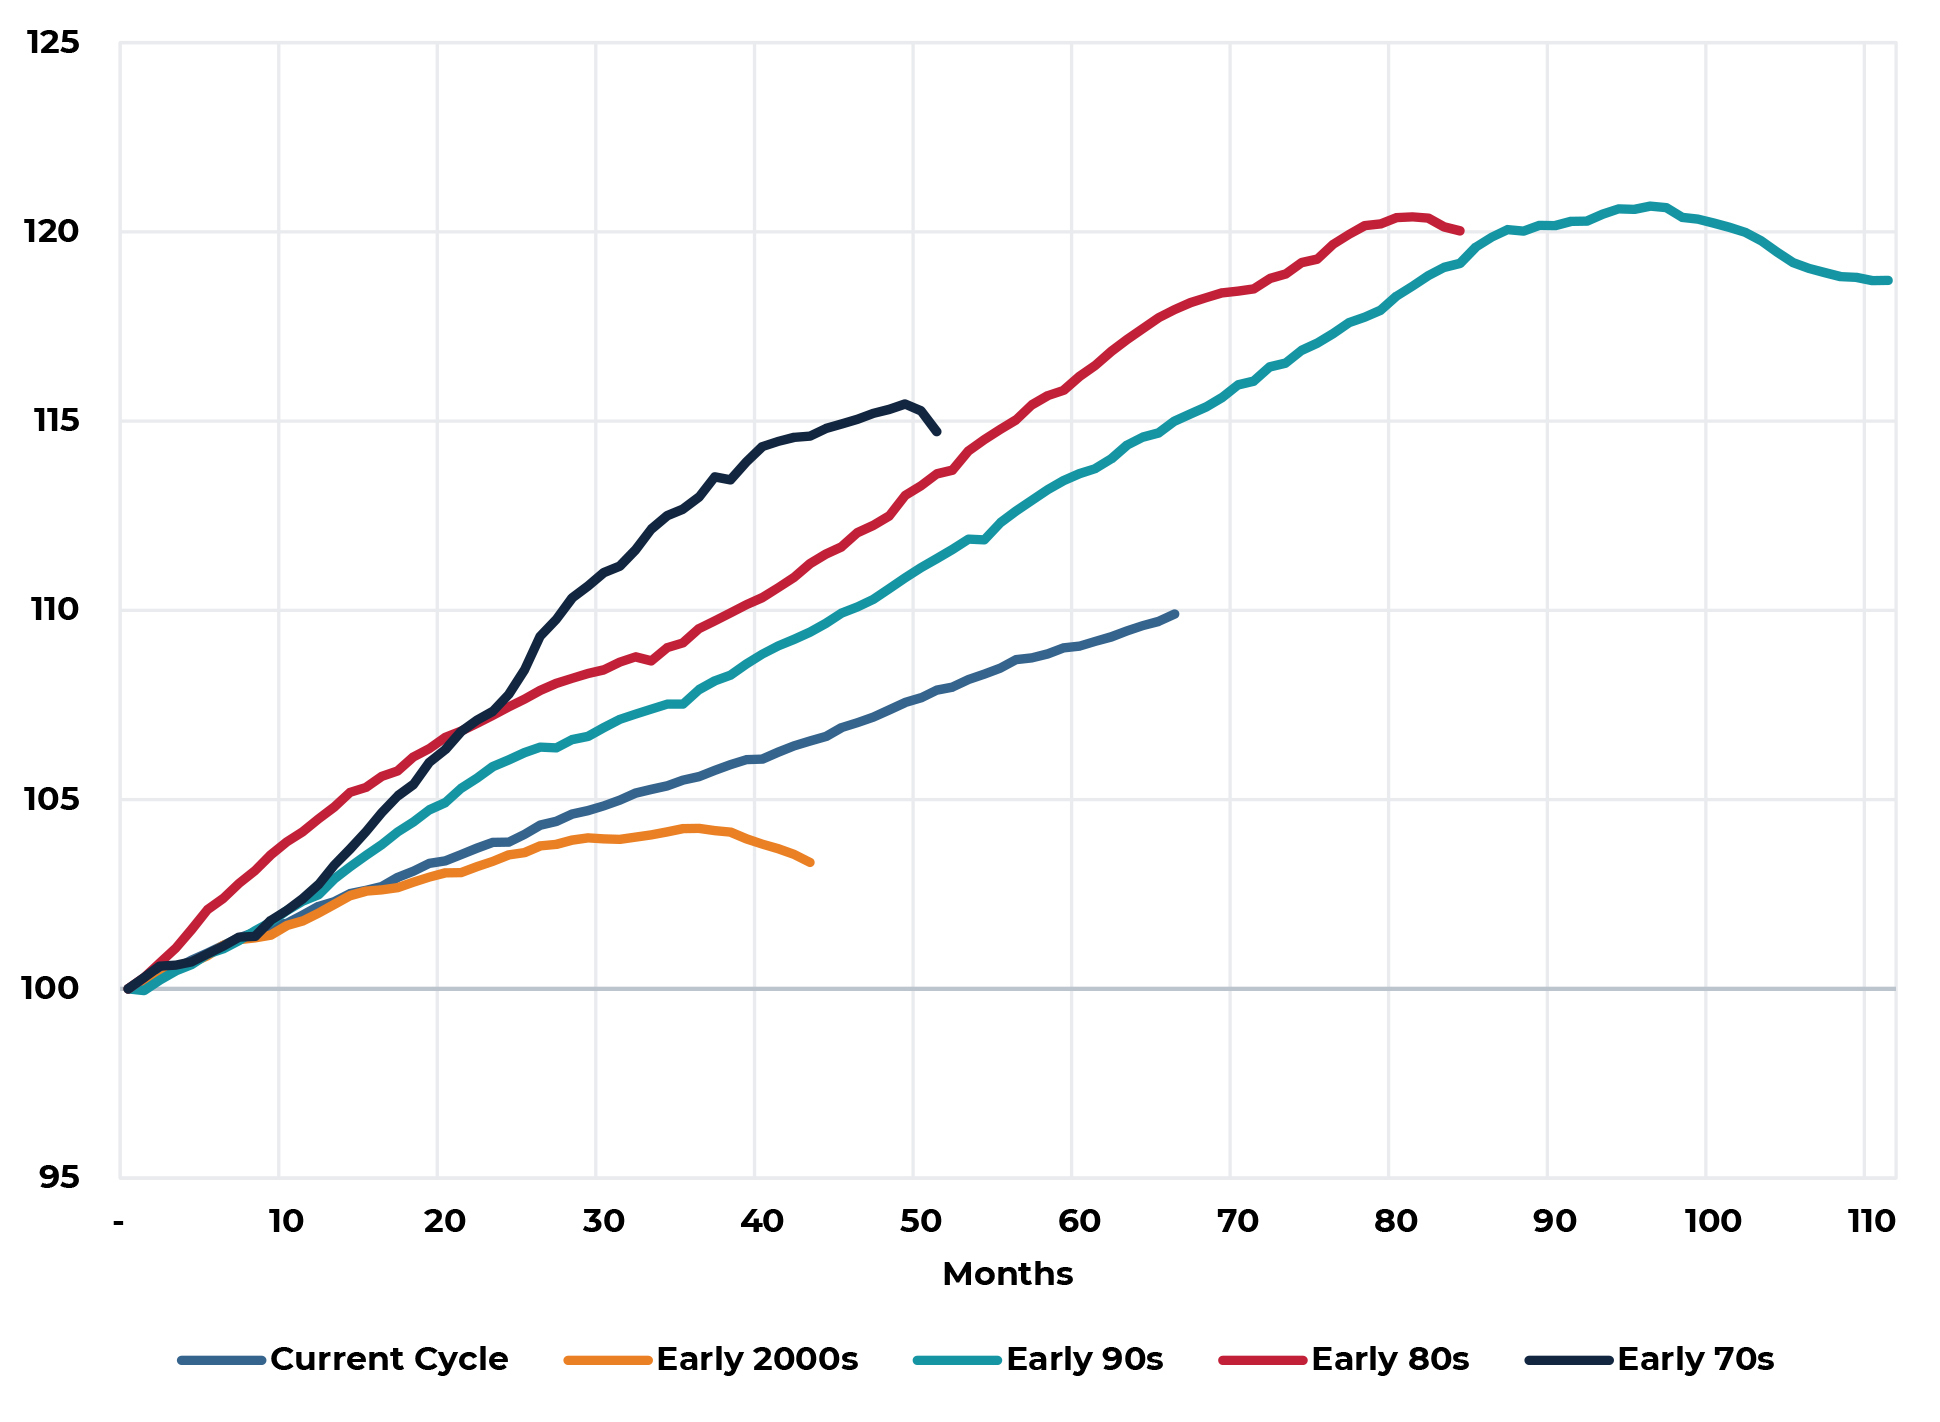
Sources: Bureau of Labor Statistics (BLS), National Bureau of Economic Research (NBER)
Former Federal Reserve Chairman Ben Bernanke has said that expansions do not die of old age, they get murdered. Figure 4 illustrates that it is often the Fed itself that ends expansions by raising interest rates too much or too quickly.
Figure 4: Federal Funds and Recessions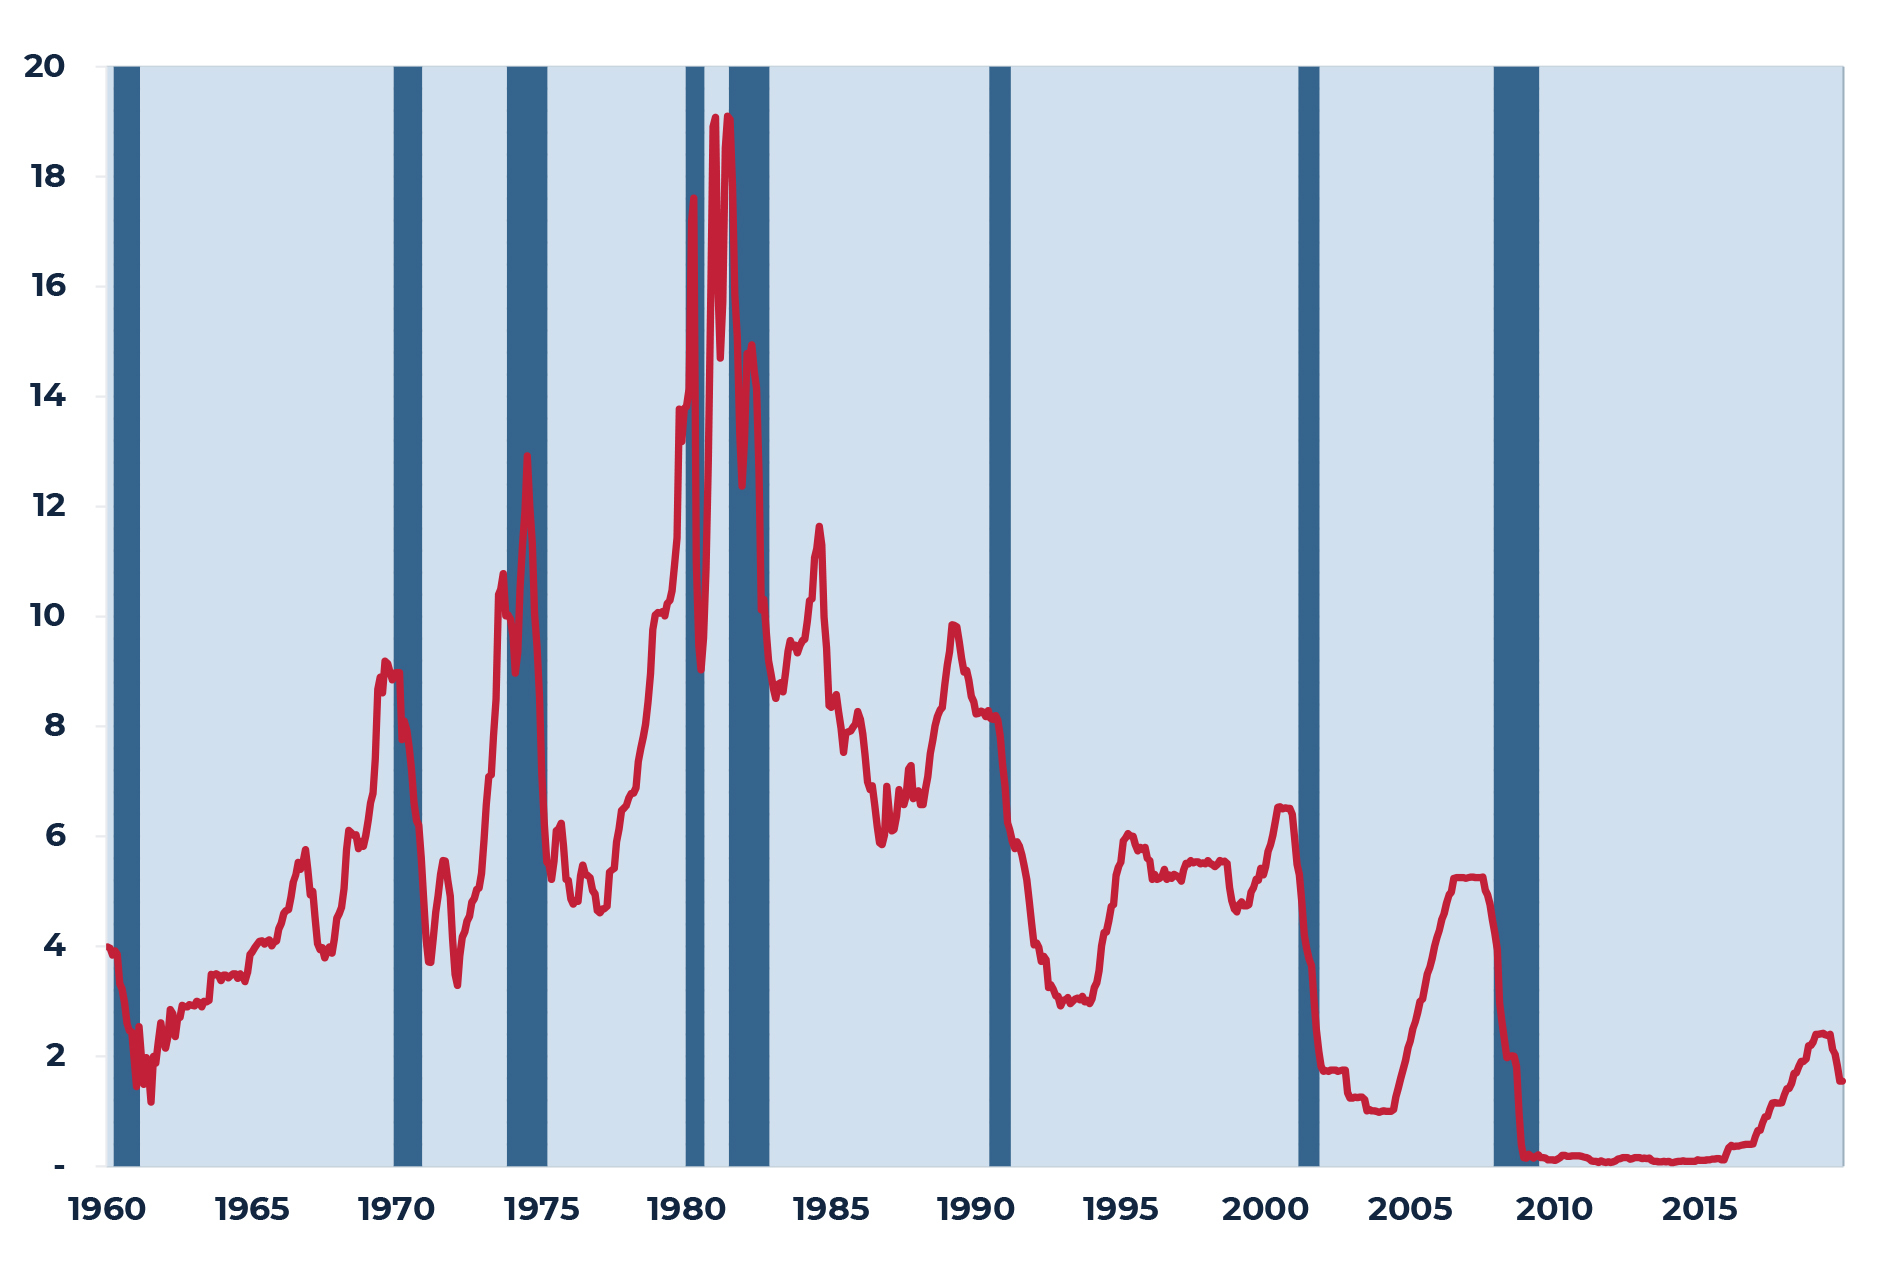
Sources: Federal Reserve
Elections Have Consequences (Except When They Don’t)
In 2010, President Obama is reported to have quipped to Republican Minority Whip Eric Cantor during the debate over the Affordable Care Act (ACA) “elections have consequences” and, with respect to policy outcomes, this is largely true. With respect to the economy, however, the consequences are arguably less obvious. Being a presidential election year, many commentators are employing rhetoric describing the 2020 outcome as highly consequential. This may well be true on a variety of fronts, but with respect to near-term future economic performance, it is doubtful the election itself will be the event that matters most. In Figure 5, we look at total employment during the 12 months prior to and the 12 months immediately following the last ten elections. Absent some unrelated (to the election) economic shock such as the financial crisis of 2008/2009 or the tech sector stock market crash and 9/11 attacks of 2000/2001, employment growth leading up to and following elections tends to move along consistent trajectories. Over the 12 months following the past ten elections, total job growth in the U.S. averaged approximately 1%. If we exclude the 2000 and 2008 elections, the average growth rate rises to almost 2%.
Figure 5: U.S. Total Employment Growth 12 Months Prior to Election Through 12 Months Following Election
Index = 100 in Month of the Presidential Election 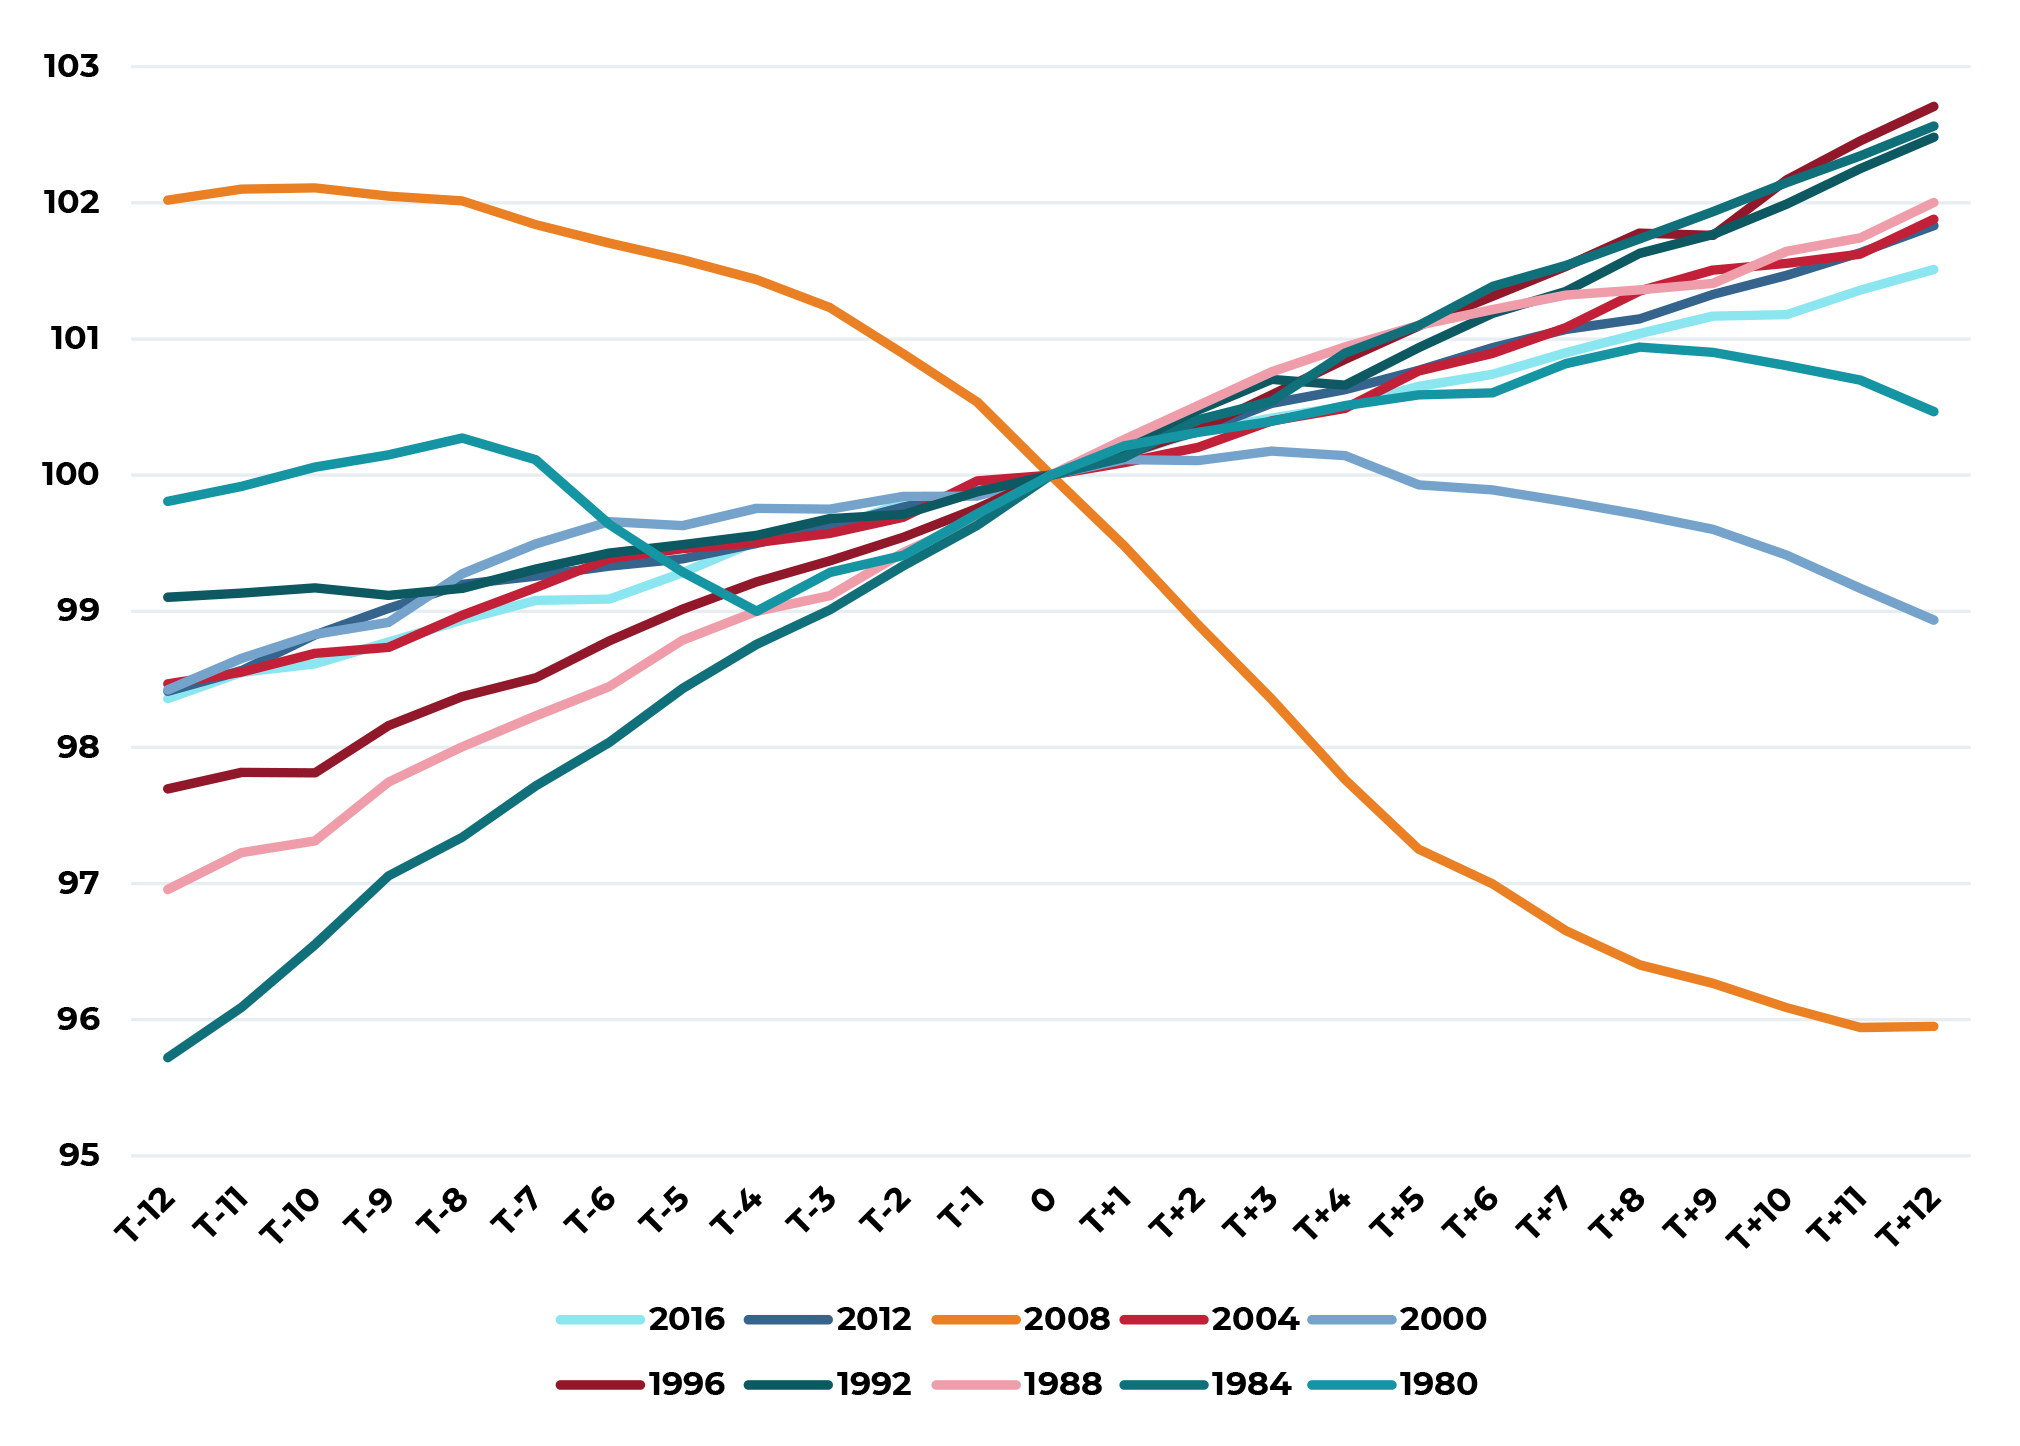
Sources: Bureau of Labor Statics, National Bureau of Economic Research
Figure 6: U.S. Real GDP Growth Four Quarters Prior to Election Through Four Quarters Following Election
Index = 100 in Quarter of the Presidential Election
Sources: National Income and Product Accounts, National Bureau of Economic Research
If we repeat this exercise for real GDP growth, we find that average year following a presidential election showed average growth of 2.4% and, when we exclude the 2000 and 2008 election years, growth averaged 3% in the year following the election. The take away from this is that while the upcoming election may be highly consequential for a variety of reasons, the impact on the economy itself and, by extension, property markets is likely to be small, at least in the near-term.
Anecdotally, we have heard various investors, consultants and others express concern that commercial property transaction volume may slow significantly in the run up to the 2020 election as buyers and sellers react to heightened political uncertainty. While this is entirely possible, the few elections for which we have transaction data do not show any significant change in transaction activity in the year prior to the election and the year following the election, again with 2008 being a distinct outlier due to factors beyond the election itself (see Figures 7 and 8). Given this, we do not expect large changes in property market volume or liquidity during the second half of the 2020.
Figure 7: U.S. Commercial Property Transaction Volume – Total Number of Properties
12 Months Prior to Election Through 12 Months Following Election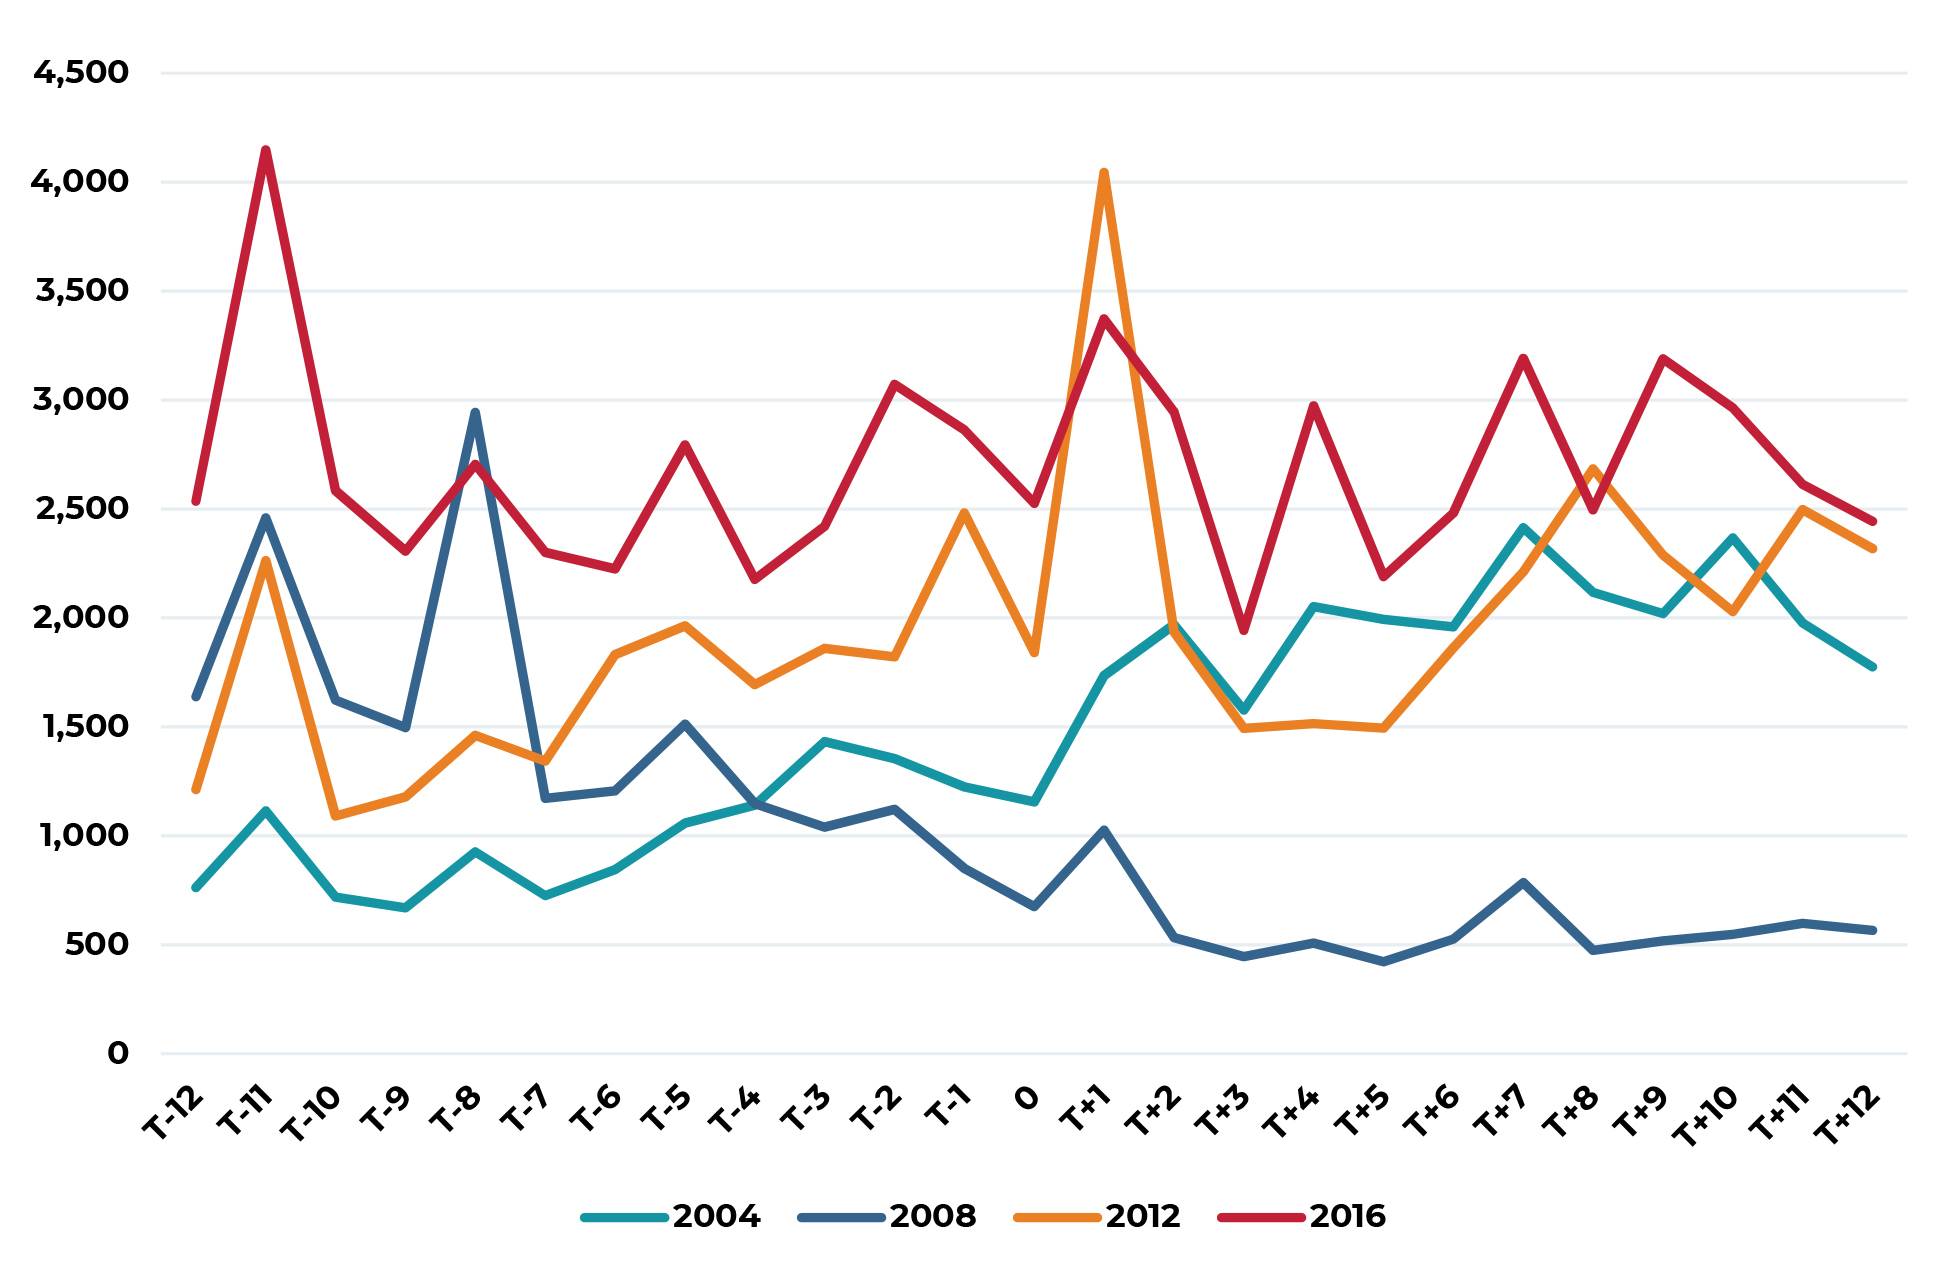
Source: Real Capital Analytics (RCA)
Figure 8: U.S. Commercial Property Transaction Volume – $ Billions
12 Months Prior to Election Through 12 Months Following Election
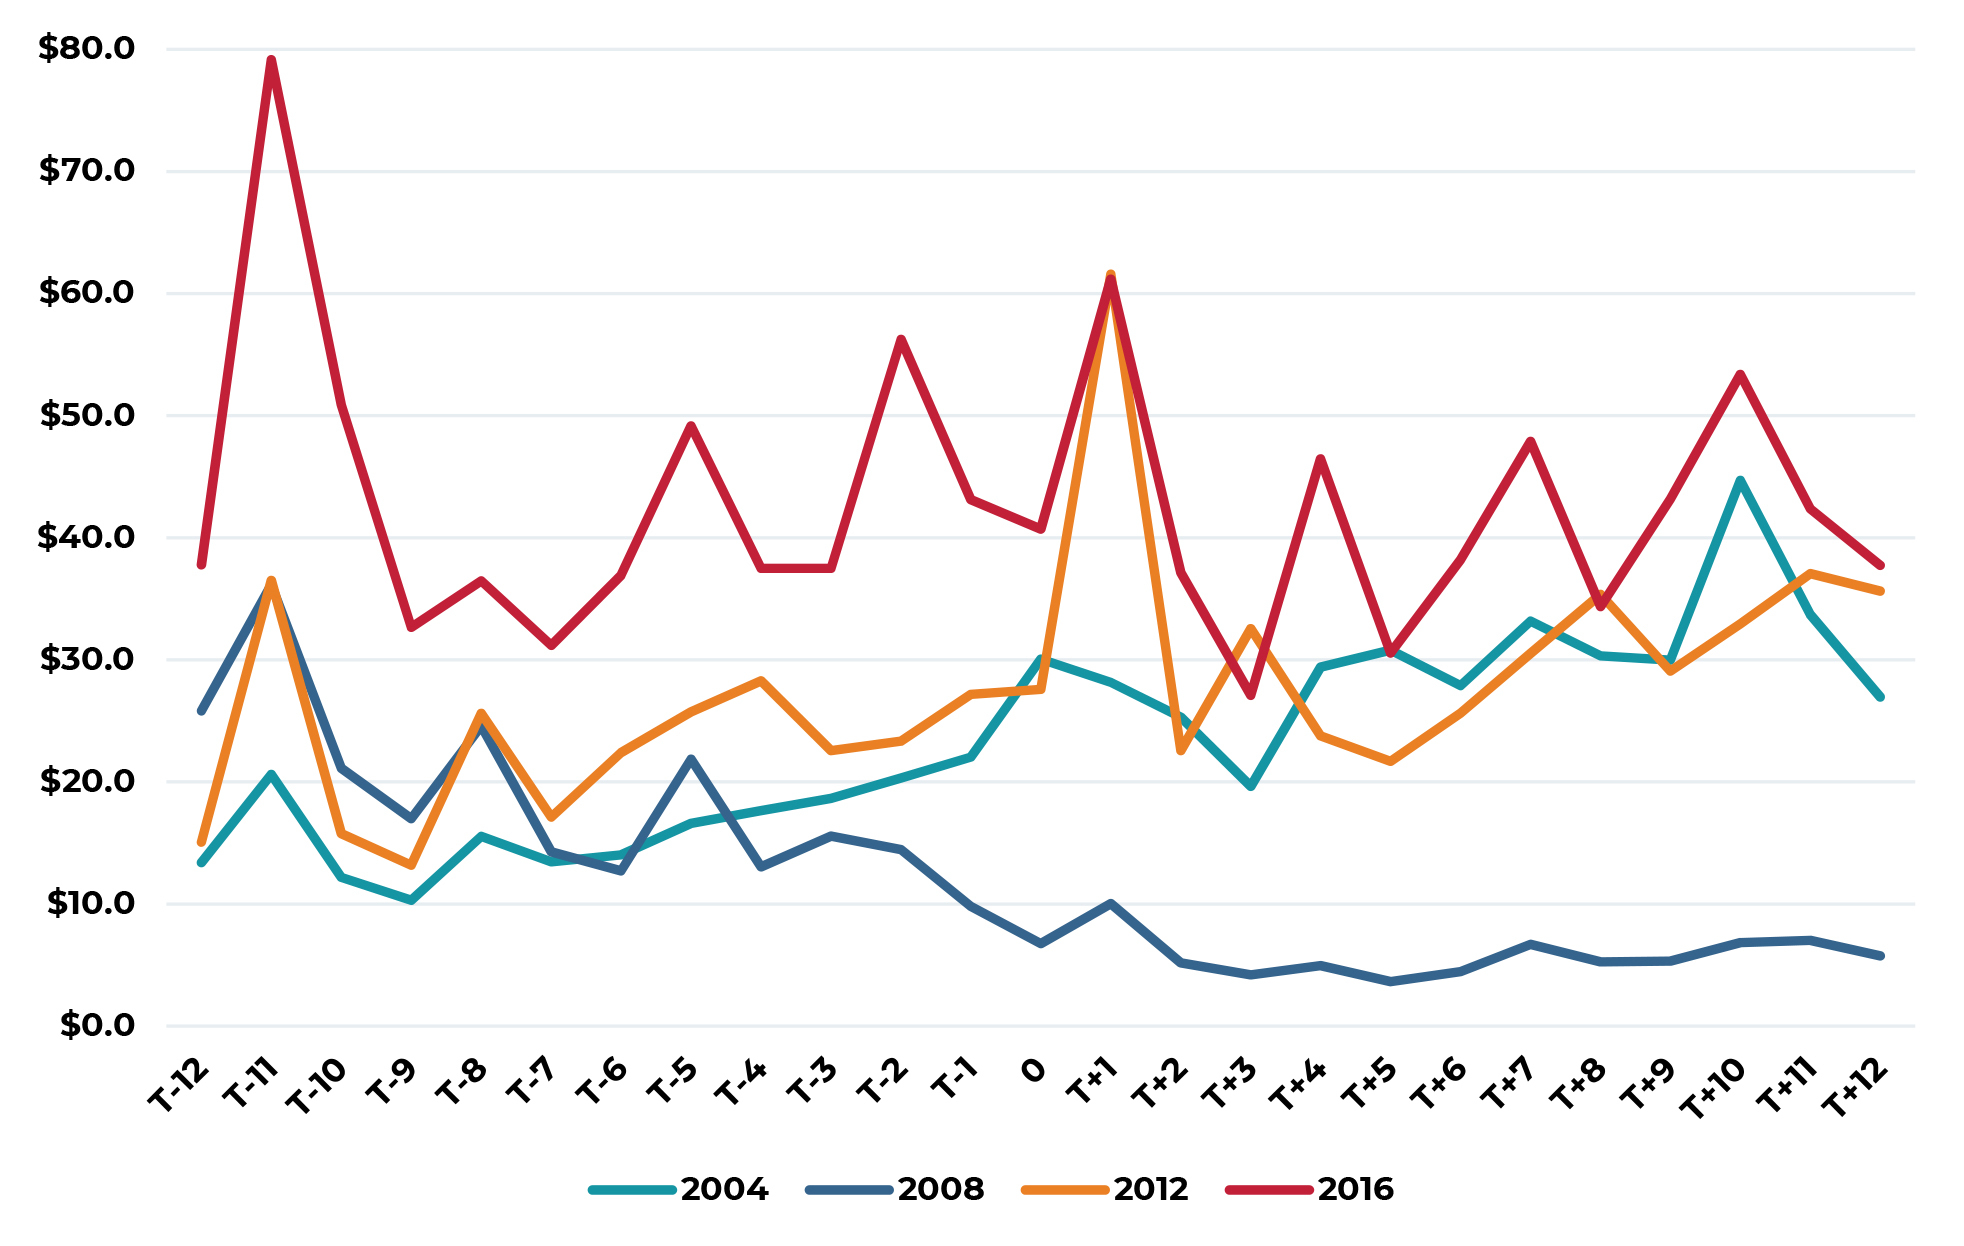
Source: Real Capital Analytics (RCA)
Synchronized Stimulus
While elections themselves might not matter greatly, policy decisions ultimately do matter. Through the end of 2018, the Federal Reserve seemed firmly on a course of desynchronizing monetary policy from the actions being taken by the European Central Bank (ECB) and the Bank of Japan. Indeed, between December 2015 and December 2018, the Federal Open Market Committee (FOMC) voted to raise their benchmark overnight lending rate nine times. Over the same period, the Federal Reserve first stopped expanding the size of its balance sheet and then, early in 2018, began to actively reduce it, thereby also reducing the supply of excess banking system reserves. By the summer of 2019, however, the FOMC abruptly reversed course and cut the benchmark rate three times during the second half of the year while also re-starting the expansion of the Fed’s balance sheet, so far adding approximately $400 billion between the end of August 2019 and the beginning of January 2020.
Figure 9: Growth in Central Bank Balance Sheets
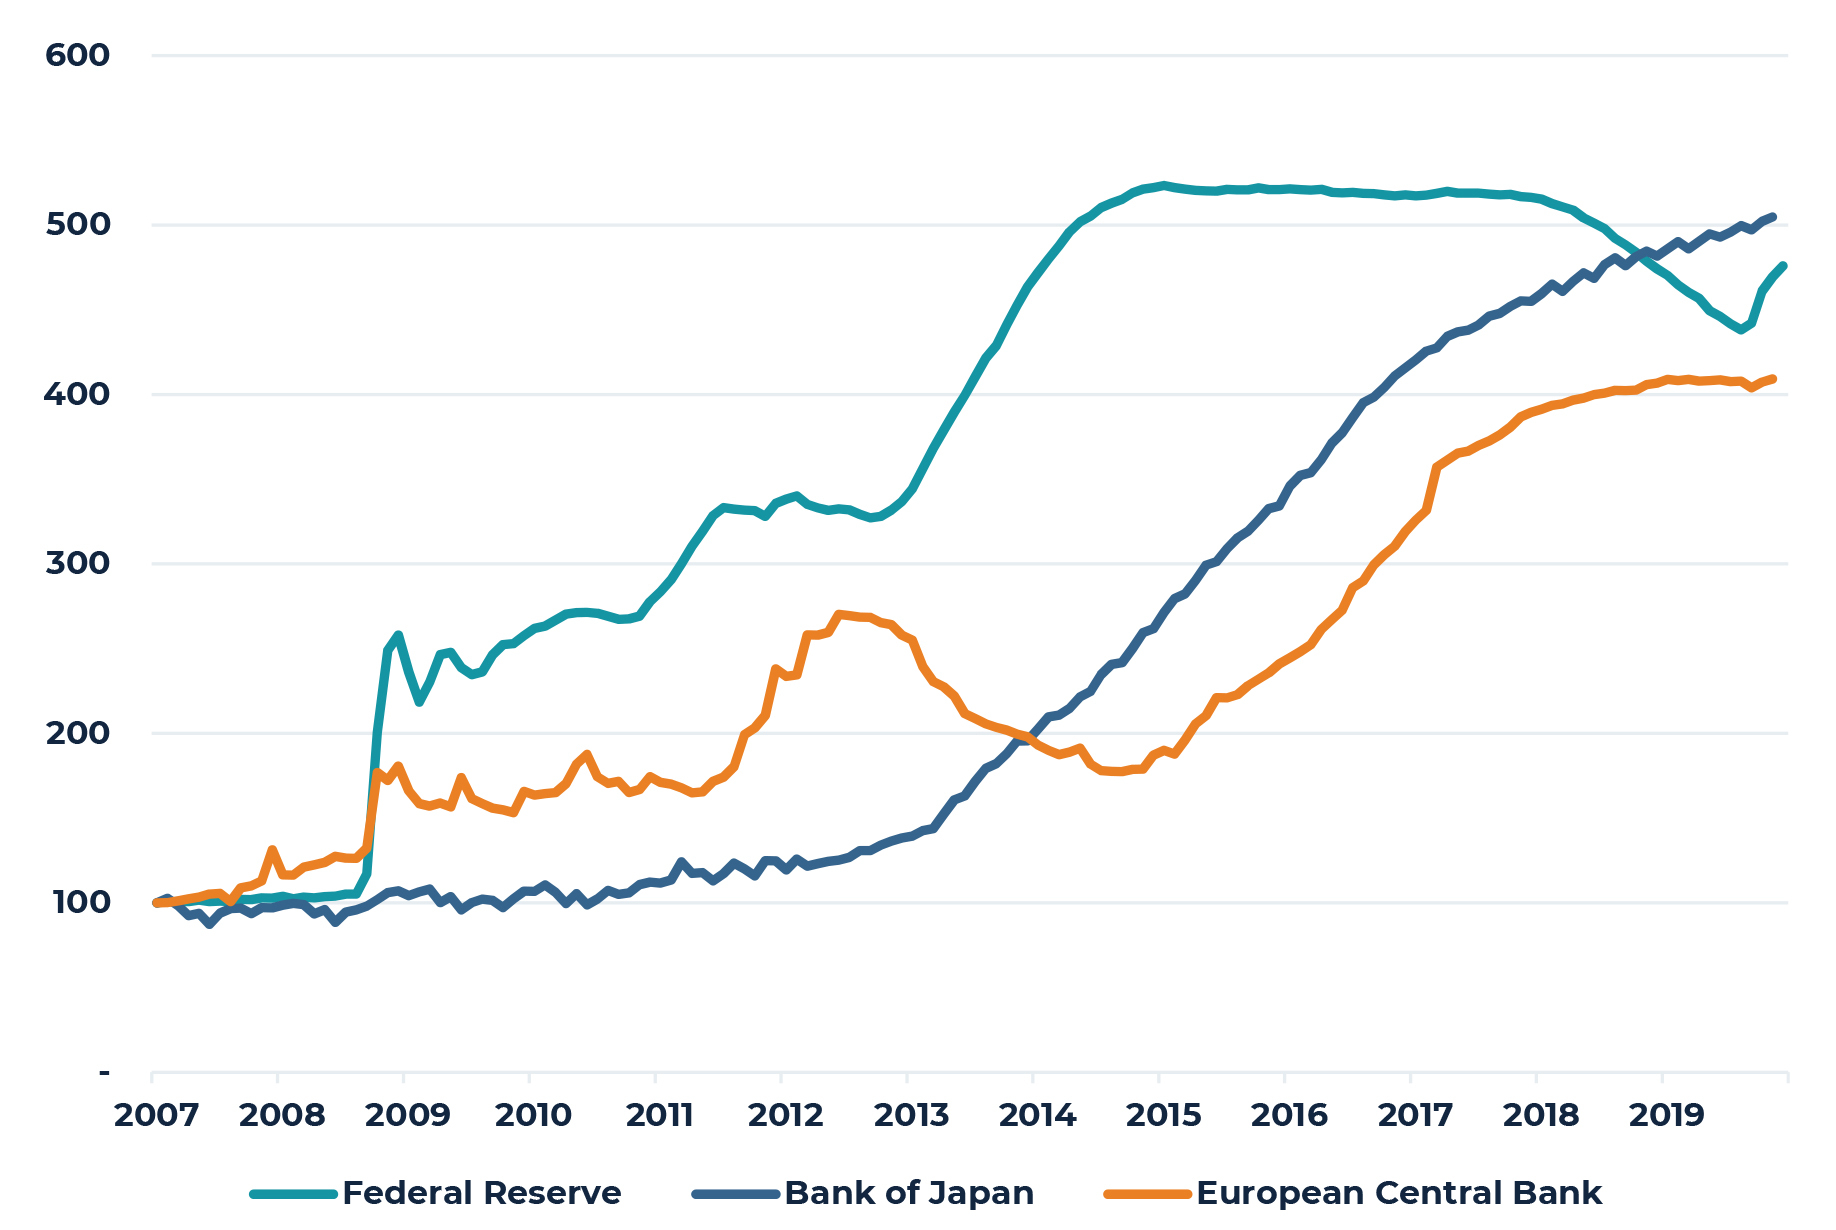
Sources: World Bank and Federal Reserve
While 2019 marked a return to synchronized monetary policy by the largest central banks, fiscal policy in most major economies has been highly stimulative for some time. Currently, nine of the world’s ten largest economies, which represent more than 60% of global GDP, are collectively running annual budget deficits approaching 5% of their aggregate GDP. Only Germany, among the ten largest economies, is currently operating with a budget surplus.
Figure 10: Government Deficit as a Share of GDP for Five Largest Economies (%)
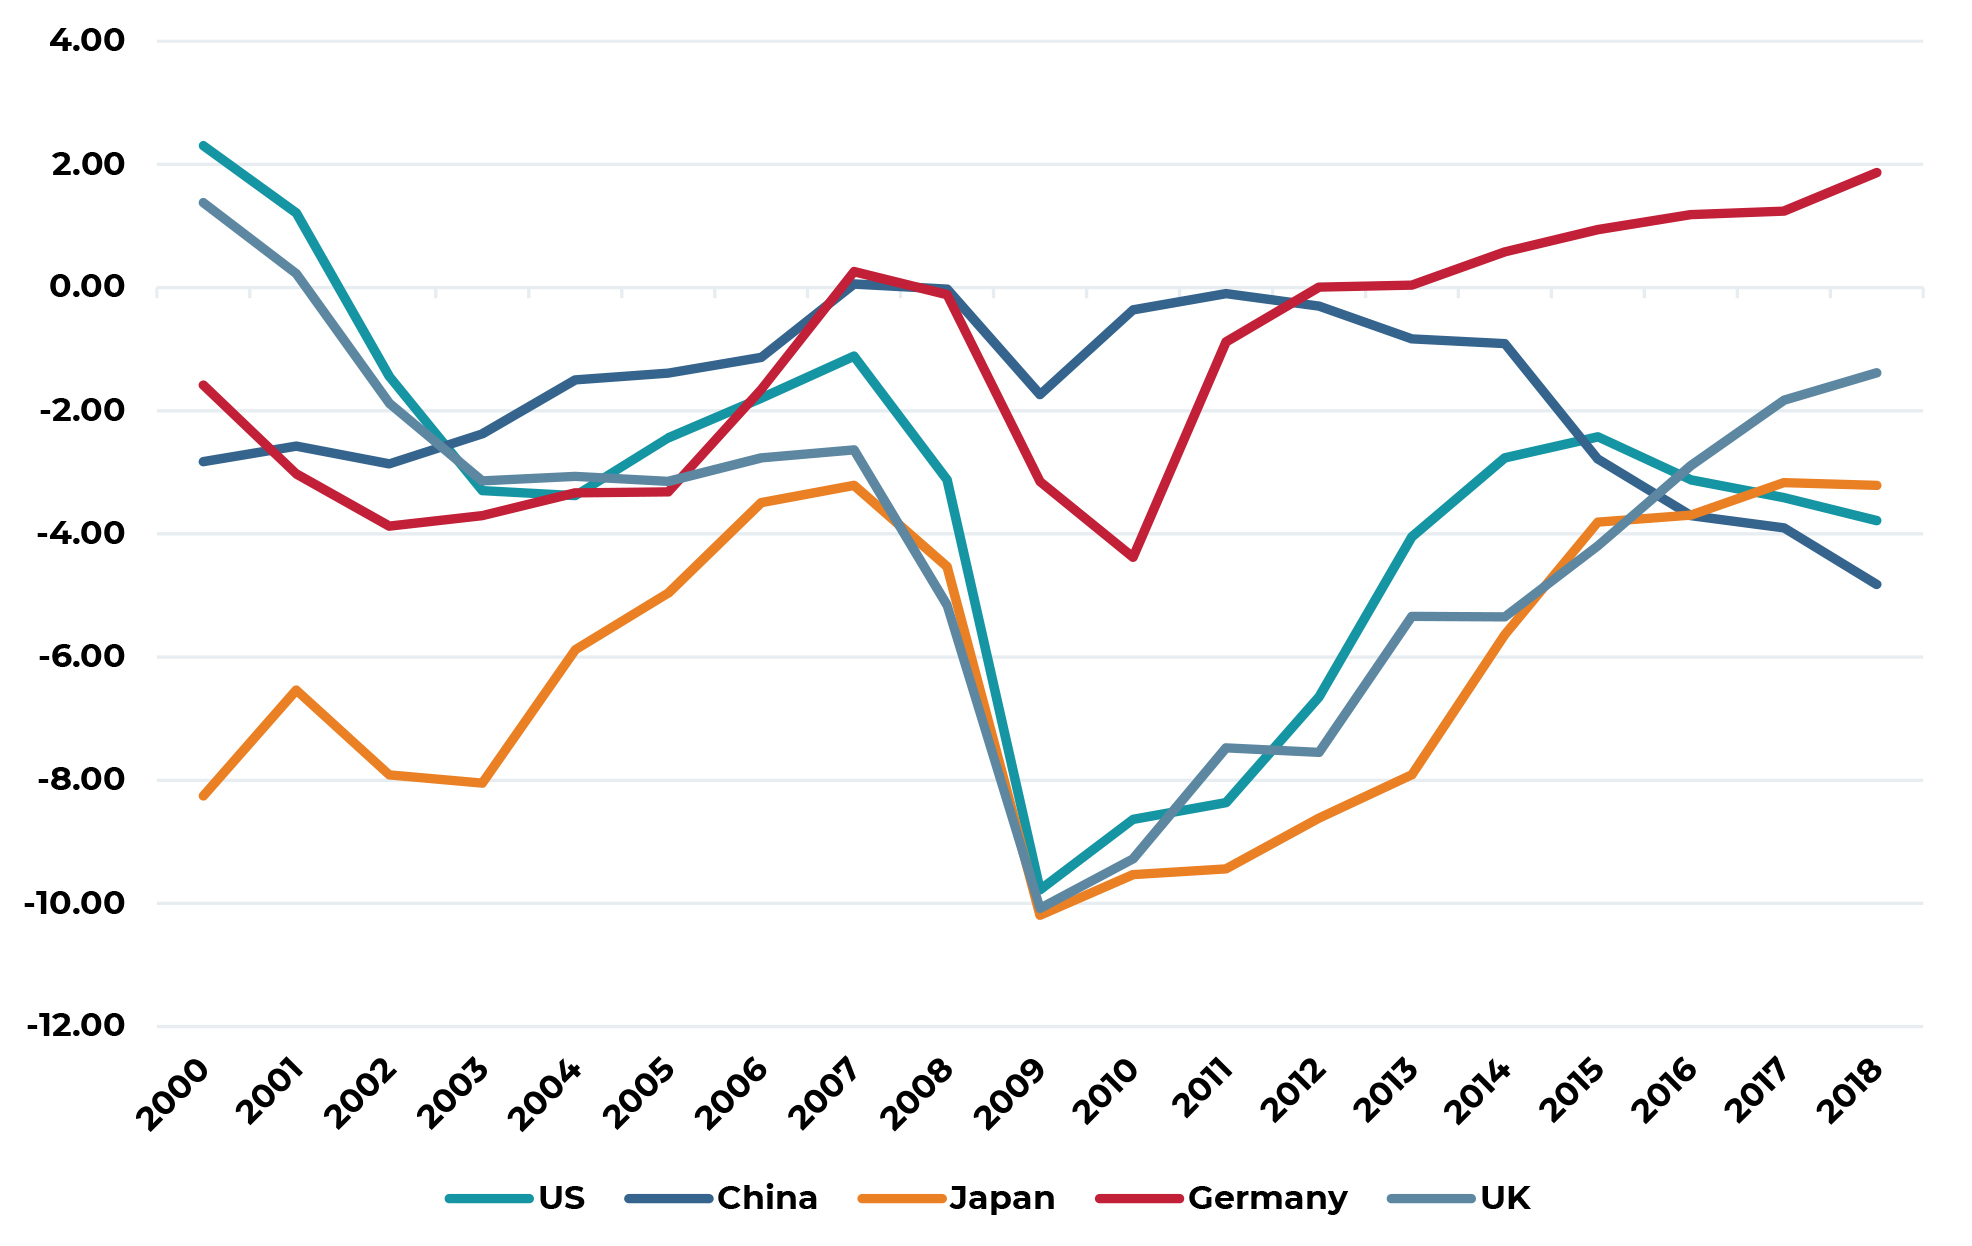
Source: World Bank
Given the Fed’s reversal of their movement towards normalizing monetary policy (i.e. raising short-term interest rates and shrinking its balance sheet), market expectations for future long-term interest rates have moderated considerably over the past six months. Today, the forward curve for the ten-year Treasury bond yield is remarkably flat with expected yields rising to just over 2.2% over the next decade. If market expectations prove correct, there will likely be scant pressure for property yields to move higher, particularly if overall economic growth remains modest but positive.
Figure 11: Market’s Expectation for Ten Year Treasury Yield Over the Next Decade
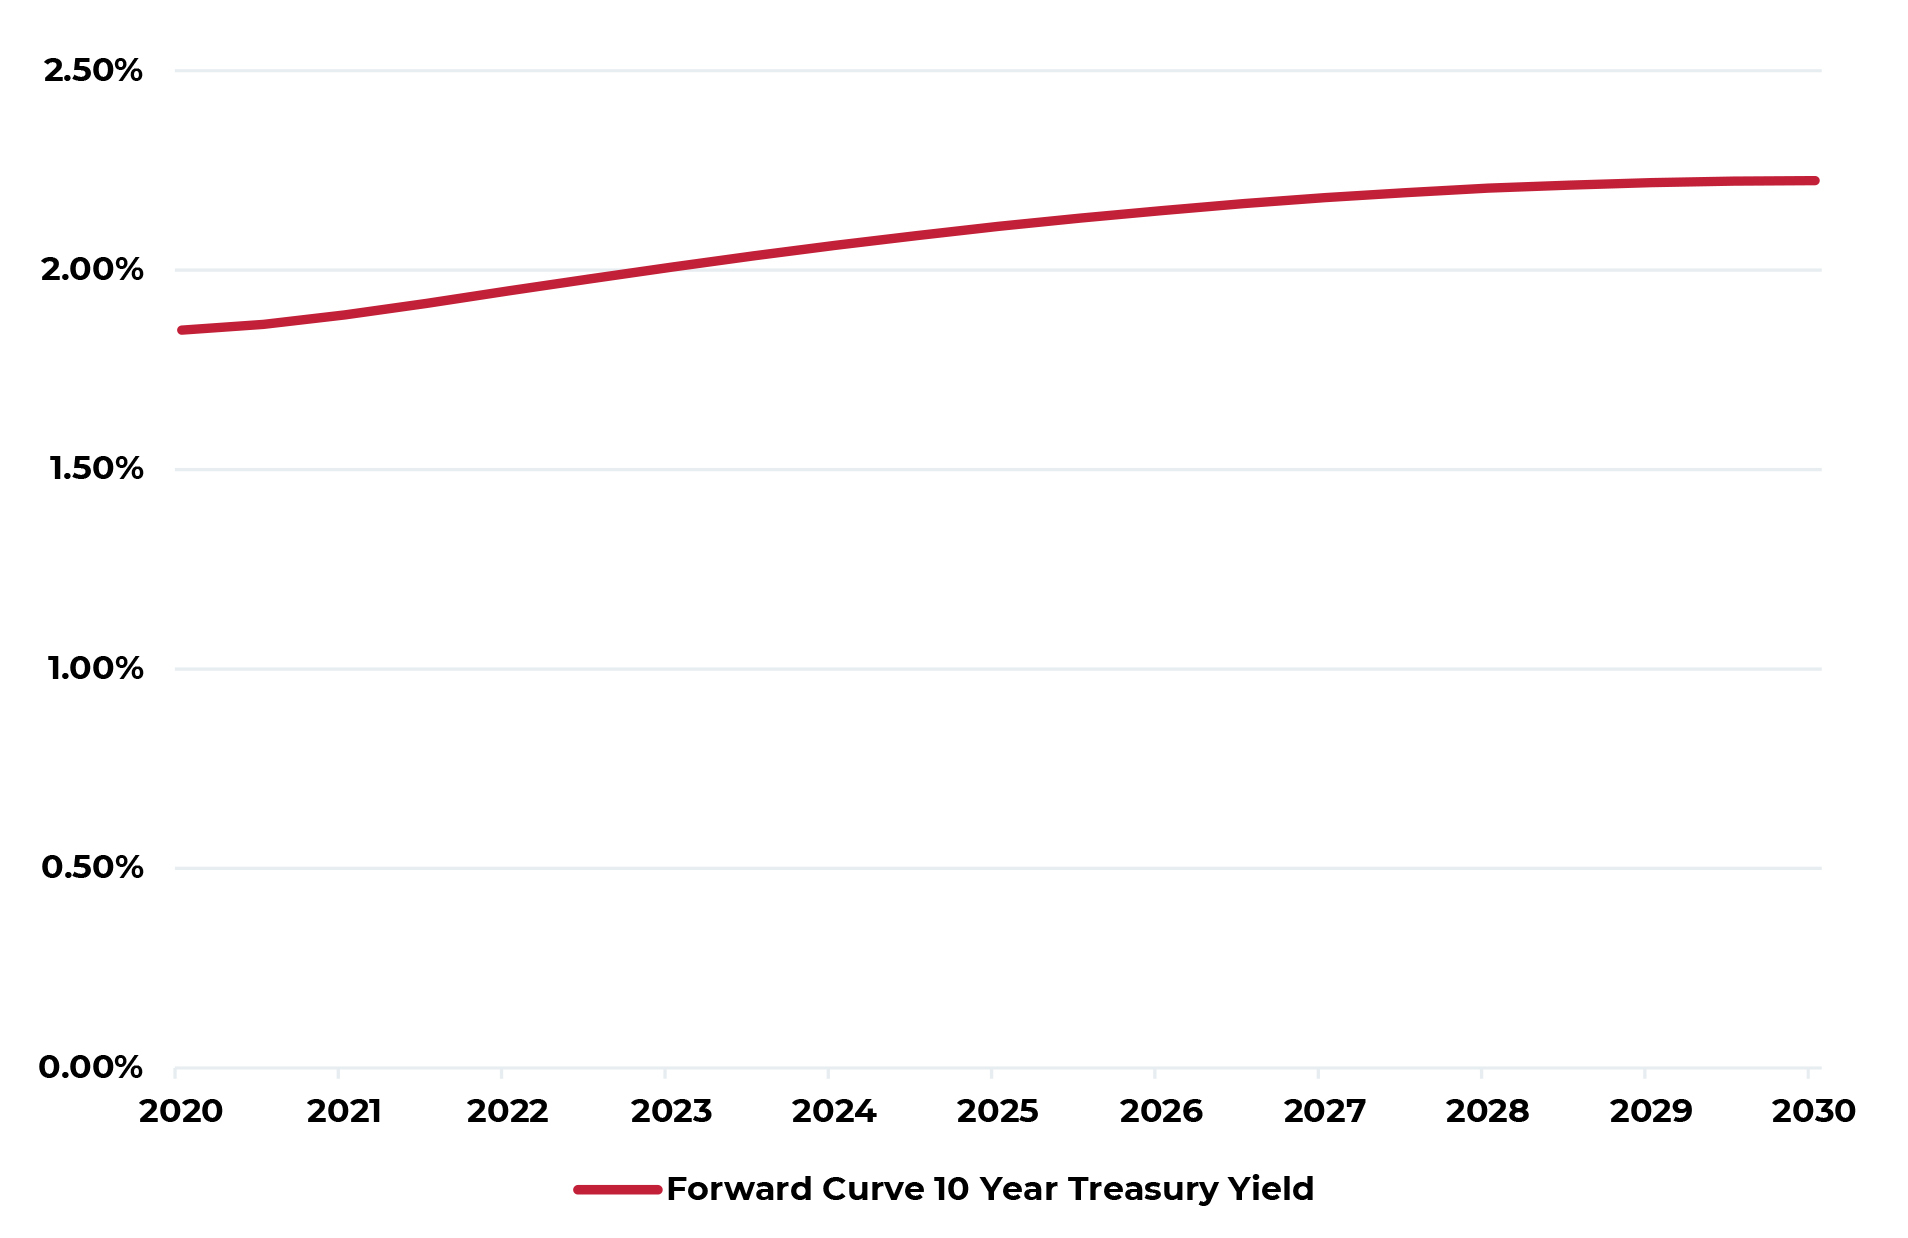
Source: Chatman Financial. January 13, 2020
Green Shoots of Policy Certainty?
With renewed synchronized monetary policy and largely synchronized deficit-driven fiscal policy, expectations for near-term growth have modestly improved and may well improve more over the coming year as trade policy becomes more certain. While not the originator of the expression, Federal Reserve Chairman Ben Bernanke helped popularize the expression “green shoots” while discussing the economy in March 20092. As we start the new year, there are perhaps similar green shoots emerging in three specific global trade policy areas: North American, U.S./China, and Britain/European.
Despite extreme political polarization in Washington, in December the U.S. House of Representatives approved the revised North American Free Trade Agreement, now rebranded as the US-Mexico-Canada Agreement (USMCA), by a large bipartisan majority (385-41) following the addition of significant labor and environmental concessions, which the Senate approved in January (89-10). Similarly, also in December, the large margin of victory by the Conservative Party and Prime Minister Boris Johnson and the subsequent approval by Parliament to proceed with Britain’s exit from the European Union (Brexit) provides another example of a significant reduction in global policy uncertainty. Finally, the U.S. and China trade representatives recently agreed to a small, but meaningful, de-escalation of the ongoing trade and tariff dispute, a so-called Phase One trade agreement. Significant uncertainty remains in many areas – the U.S./Iran conflict being the most obvious and extreme- but also continued political and social unrest in Hong Kong. Still, these three developments offer positive examples of paths towards greater certainty going forward.
Figure 12: Heightened Global Policy Uncertainty
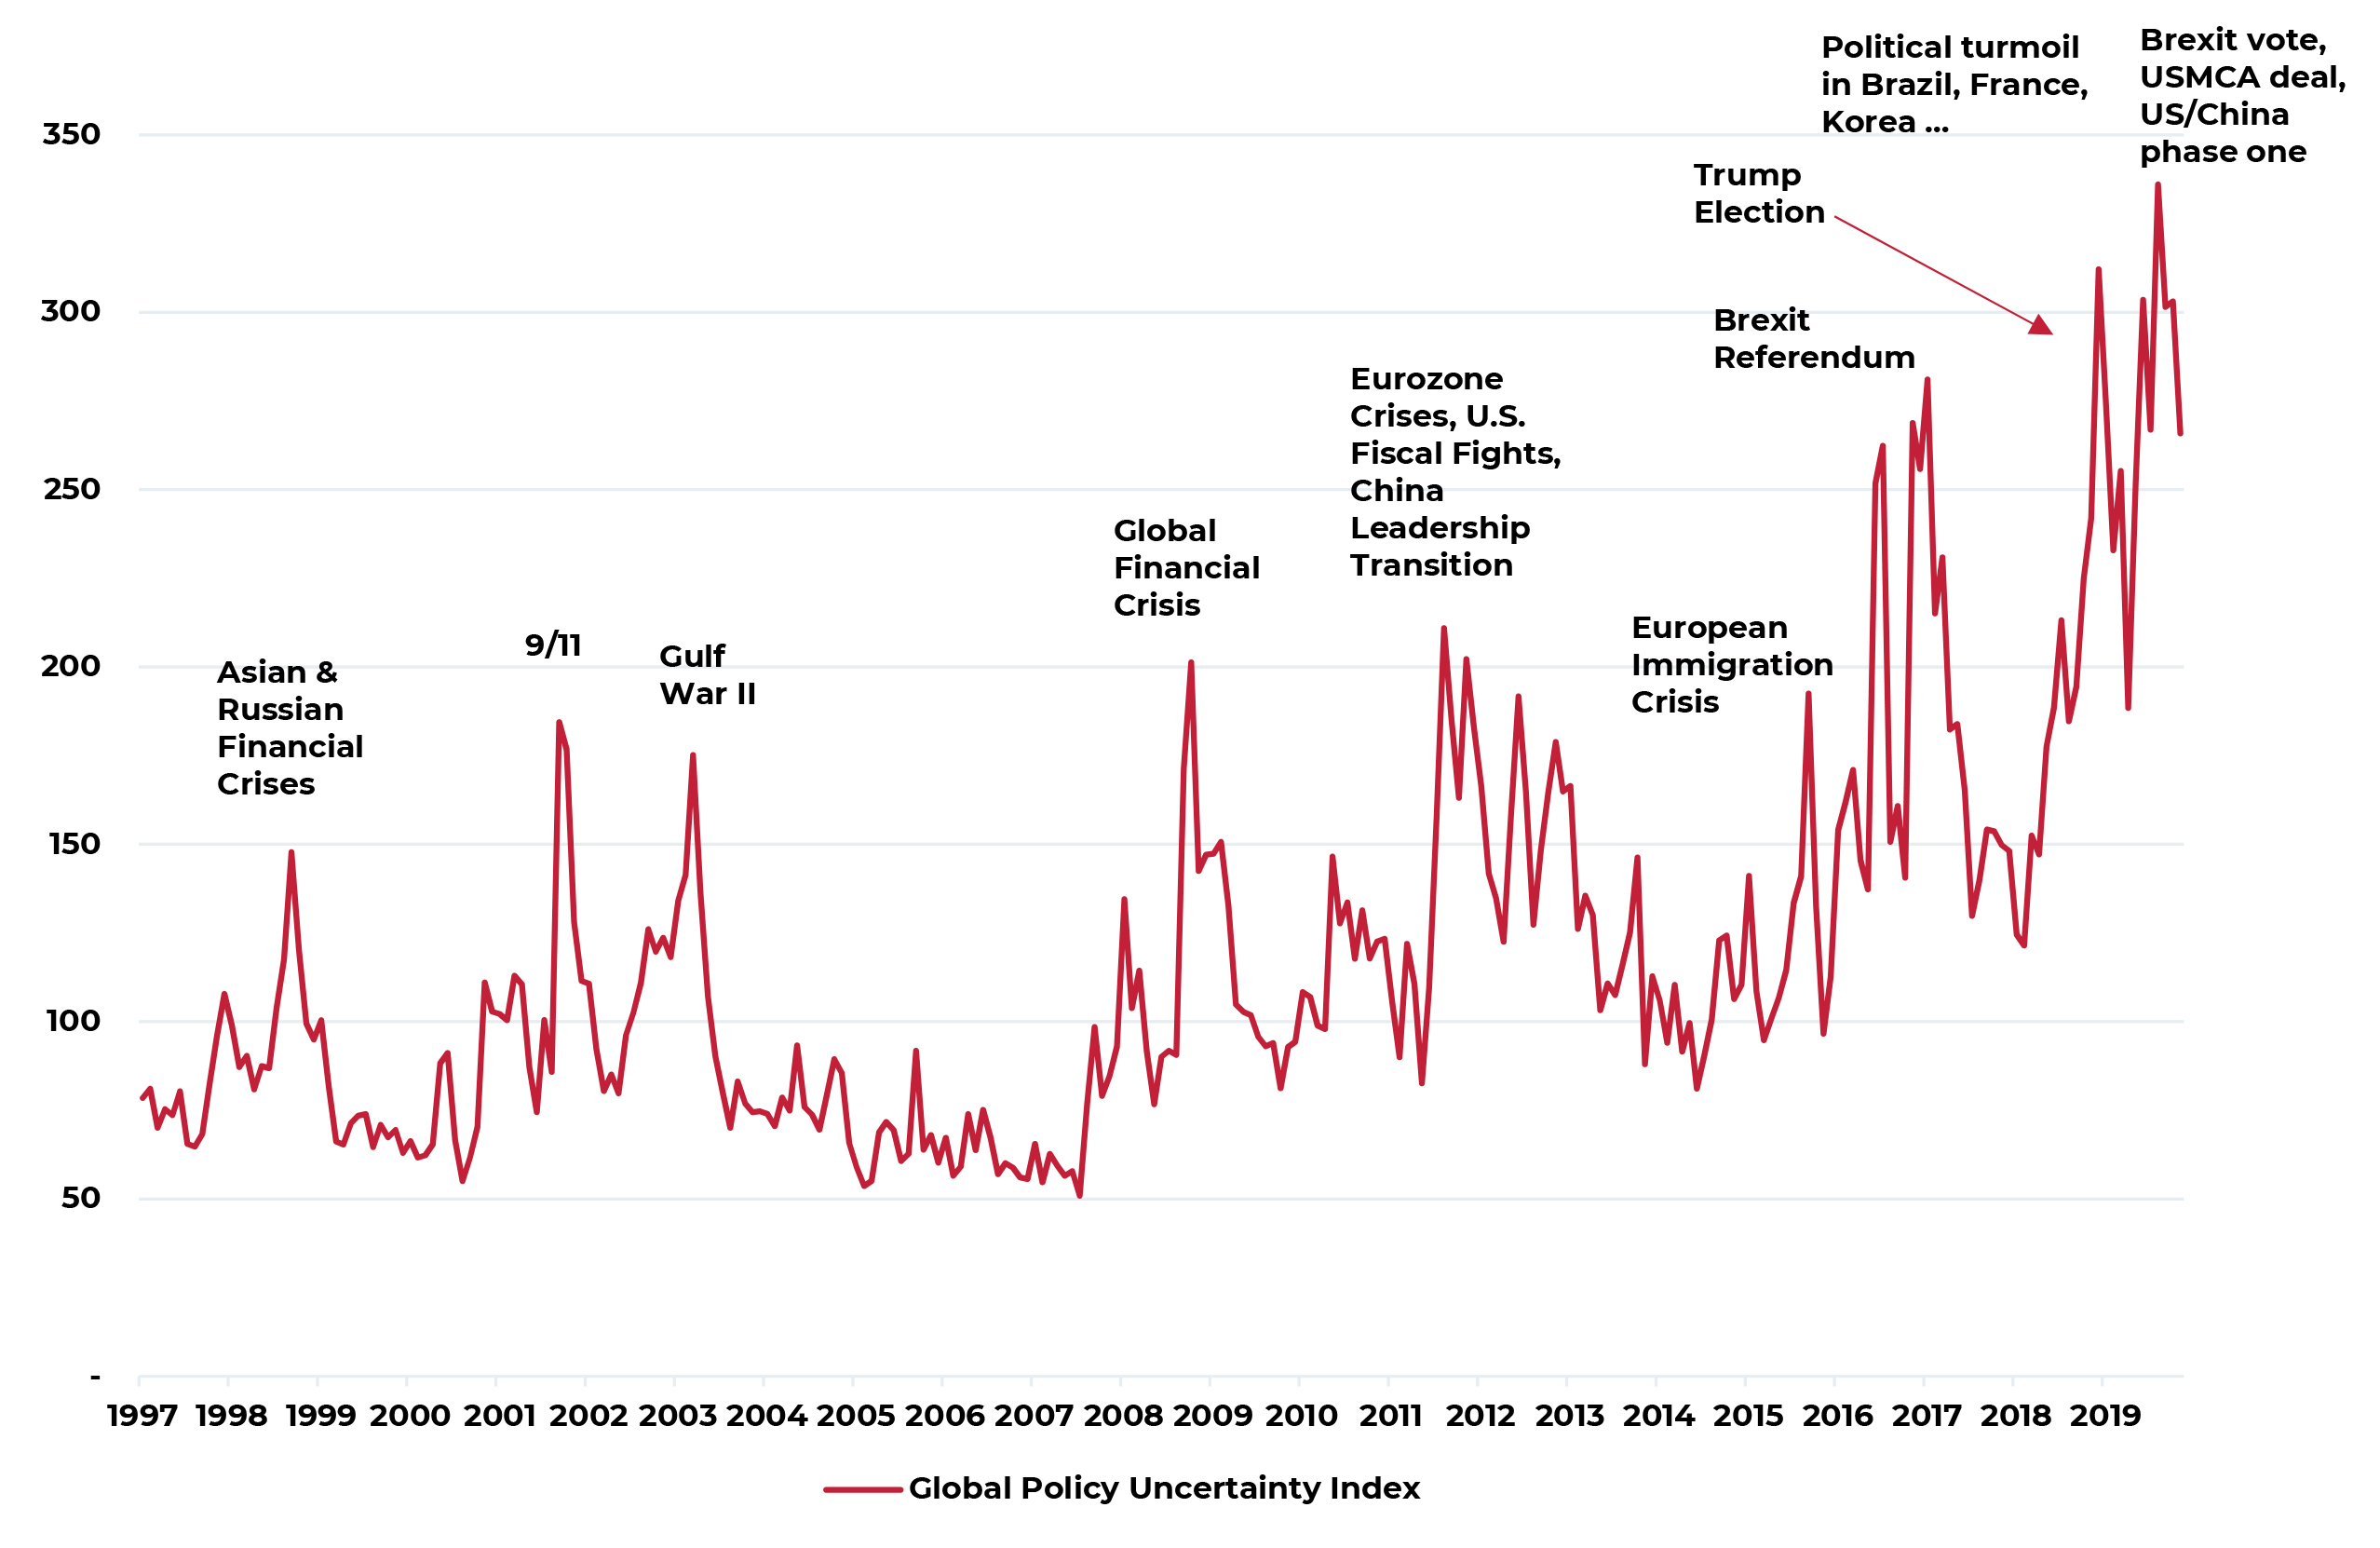
Source: Economic Policy Uncertainty (policyuncertainty.com)3
Heightened uncertainty has been both a positive and negative factor for U.S. property investors. On the positive side, broad uncertainty tends to favor hard assets as investors increase allocations and capital flows to property and other tangible and cash yielding investments. On the negative side, heightened uncertainty also tends to reduce aggregate economic growth and, consequently, demand for property. In the current period that has certainly been true in two specific areas of weakness: global trade and business fixed investment. Any reduction in trade policy uncertainty should lead to somewhat stronger economic growth during 2020 and beyond, as well as stronger property market fundamentals, particularly for already in-favor property such as industrial, a clear beneficiary from increased trade flows and business cap ex spending. To this point, in January the International Monetary Fund (IMF) raised slightly its forecast for 2020 global growth, specifically citing the easing of trade tensions.
Allocations to Real Estate Continue to Grow
Most asset class valuations today are high by any conventional metric. Central banks have historically used monetary policy to pull forward economic activity to combat sluggish demand. Over this past decade, these same banks used monetary policy to also pull forward asset appreciation to deleverage an overleveraged global economy. In Figure 13, we show price appreciation for stocks, bonds and commercial property. As shown, U.S. stock prices today are more than twice the level reached prior to the financial crisis while U.S. bond prices are nearly 60% higher. For its part, commercial property prices are now, on average, approximately 35% above prior peak, but with significant variation by property type and geography. For example, price increases for properties in “major markets” are much closer to the rise in bond prices while average price increases for smaller markets are roughly half as great.
Figure 13: Price Comparison for Stocks, Bonds and Real Estate
Index = 100 at Pre-Financial Crisis Peak4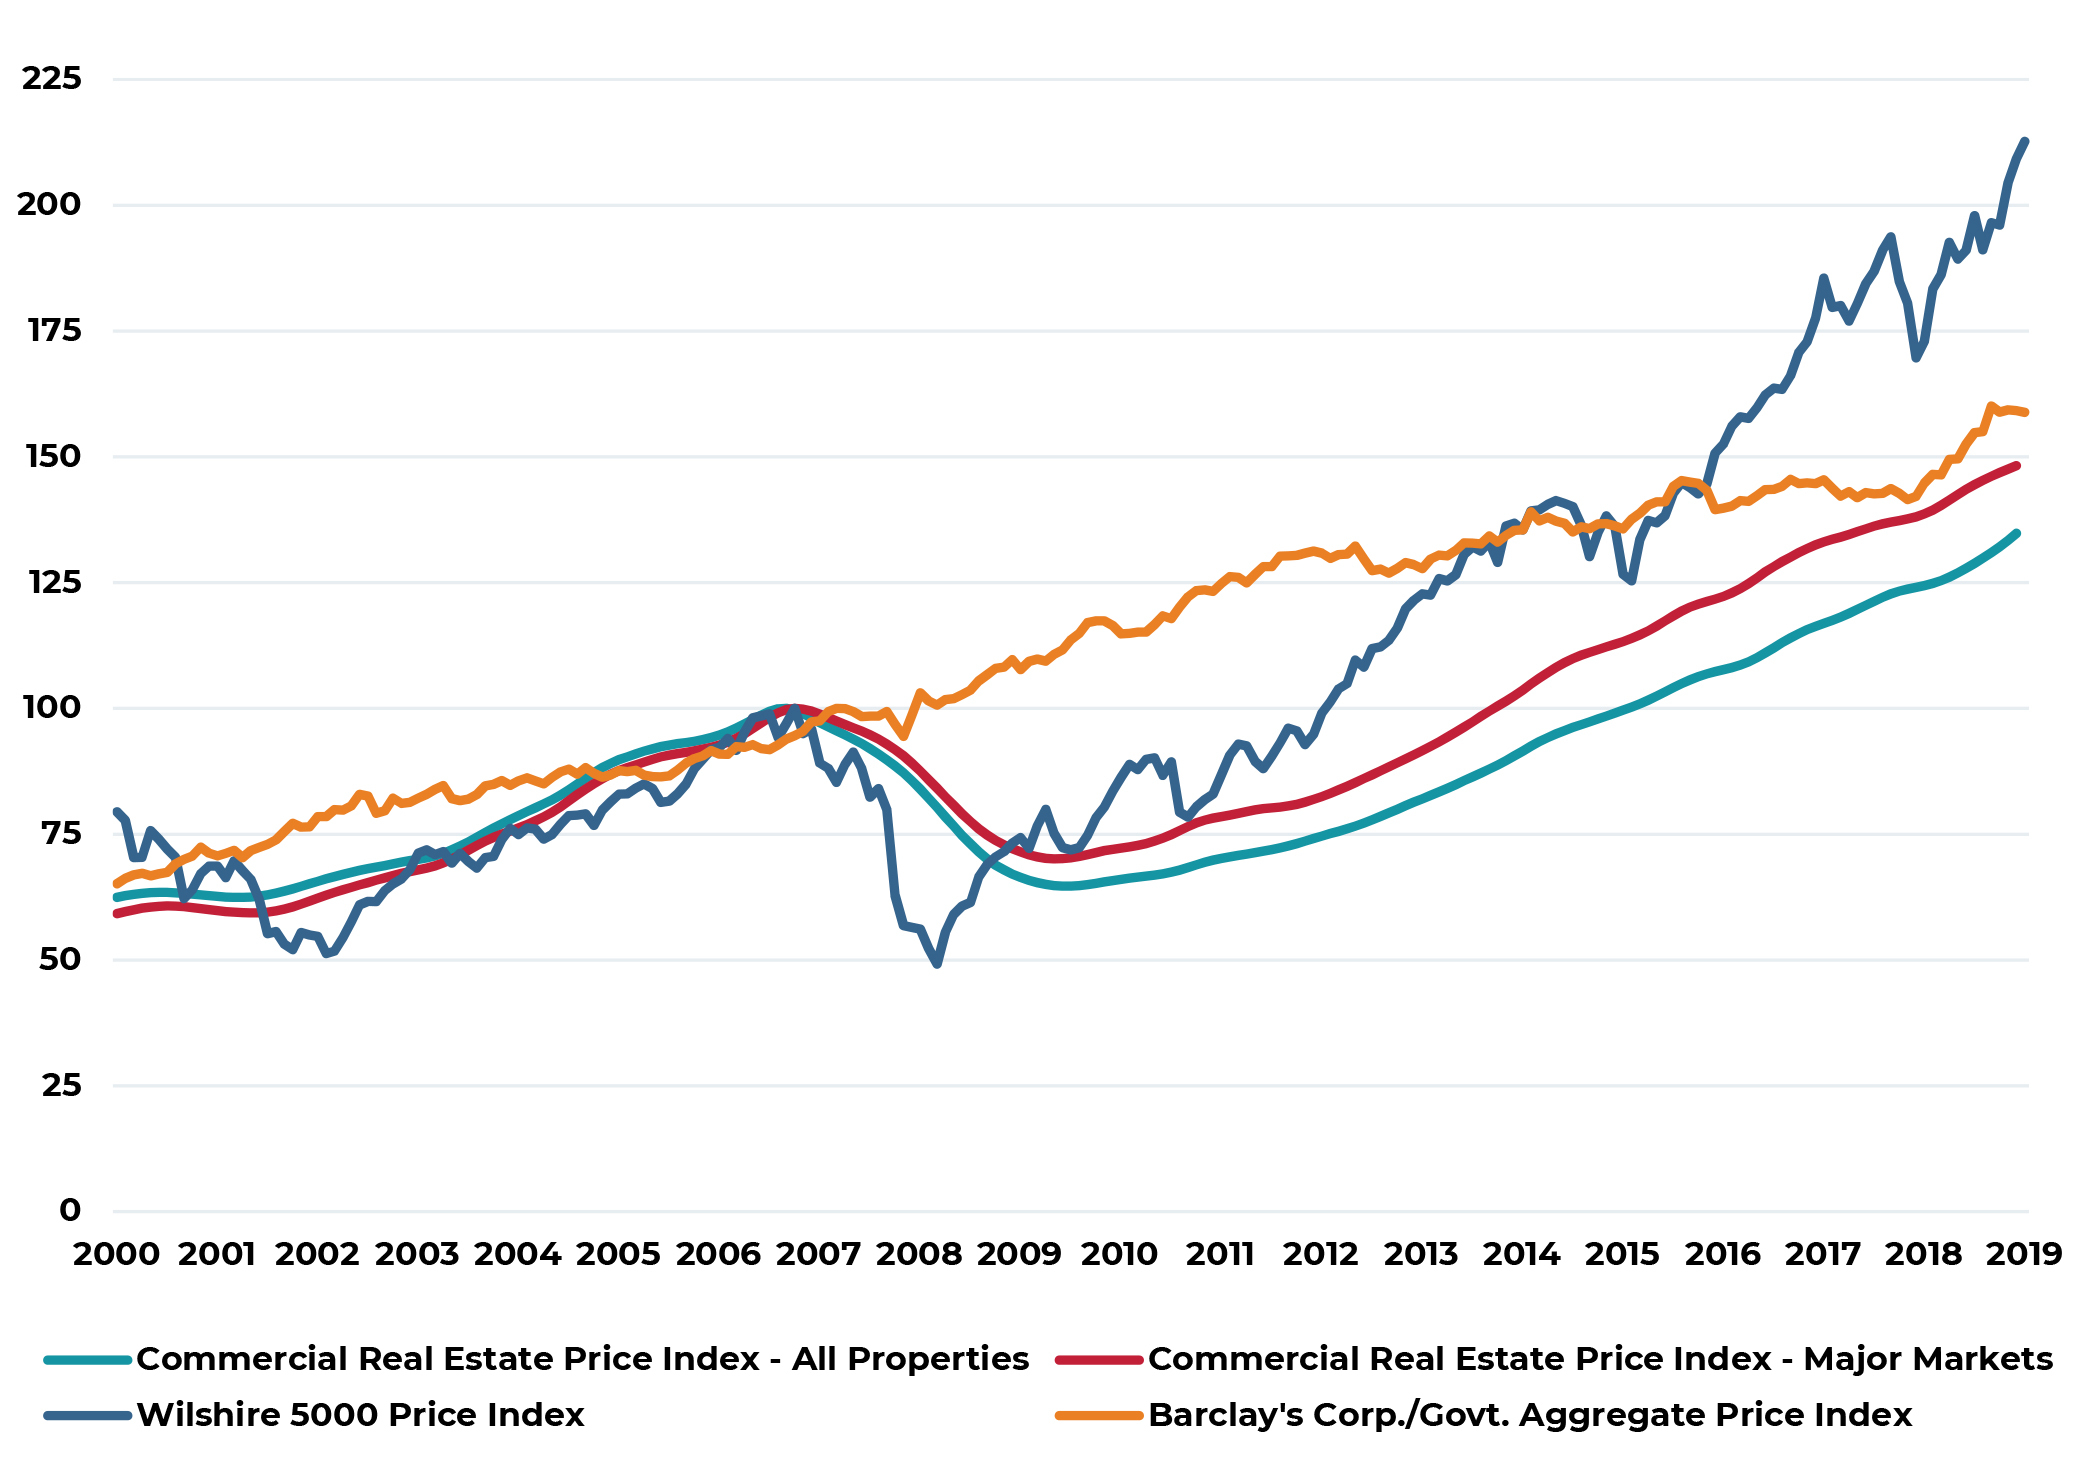
Sources: Real Capital Analytics, Wilshire, Bloomberg
Given these valuations, go forward expected returns across most asset classes will simply be lower, for a longer period of time; U.S. real estate will not be an exception. Consensus surveys of real estate investment managers confirm this with the current survey from PREA showing an expected unleveraged total return from the NCREIF Property Index of 5.6% over the next five years with most of this coming from income rather than appreciation.
Figure 14: Consensus Expected Unleveraged Total Return for NCREIF Property Index
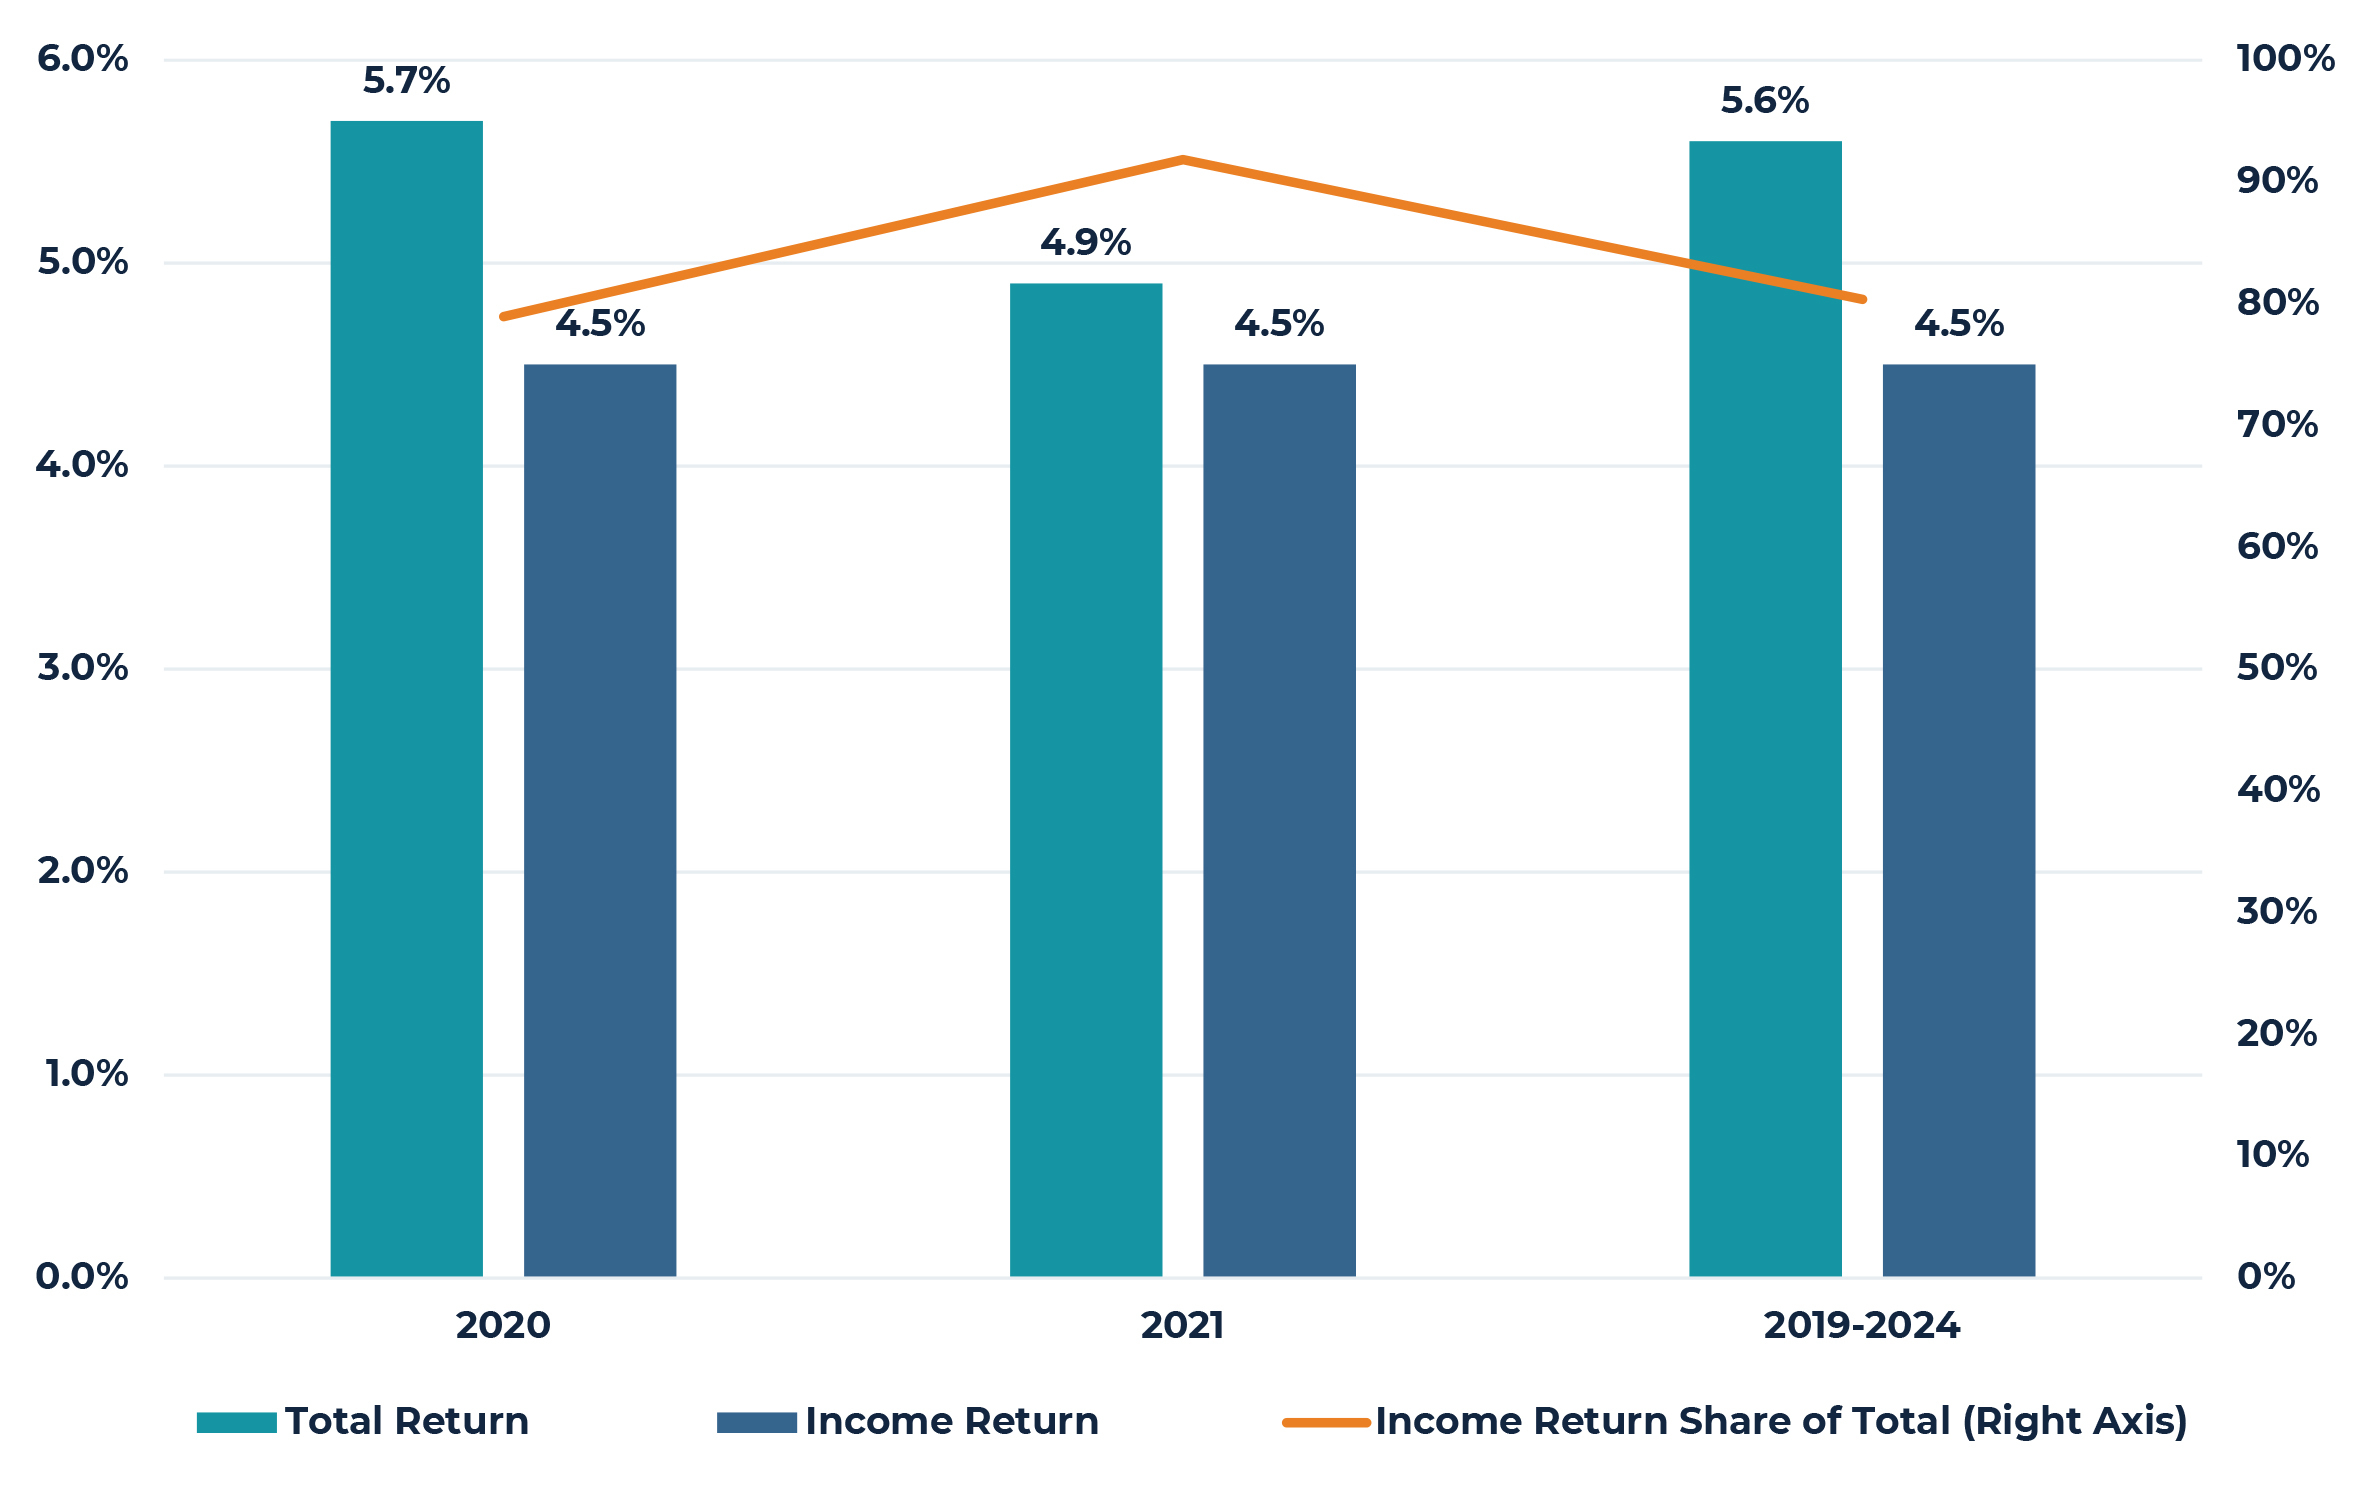
Source: PREA Quarterly Survey 2019 Q4
All investing is ultimately an exercise in relative valuation and, in this context, real estate – despite the lower expected returns described above - continues to look attractive to most investors. Indeed, recent institutional investor survey data show nearly all institutional investors maintaining or increasing allocations to real estate with a growing share of the real estate allocation going to higher risk and return strategies.5 Overall, the average institutional target allocation to real estate increased by 10 basis points to 10.5% during 2019 and is expected to grow by an additional 10 basis points in 2020. For perspective, this compares with an average real estate allocation of less than 9% as recently as 2013. At the same time, average institutional investor actual allocations remain more than 100 basis points below target and this gap continues to widen as equity market valuations continue to record new heights, thereby expanding the denominator.
Figure 15: Average Institutional Allocation to Real Estate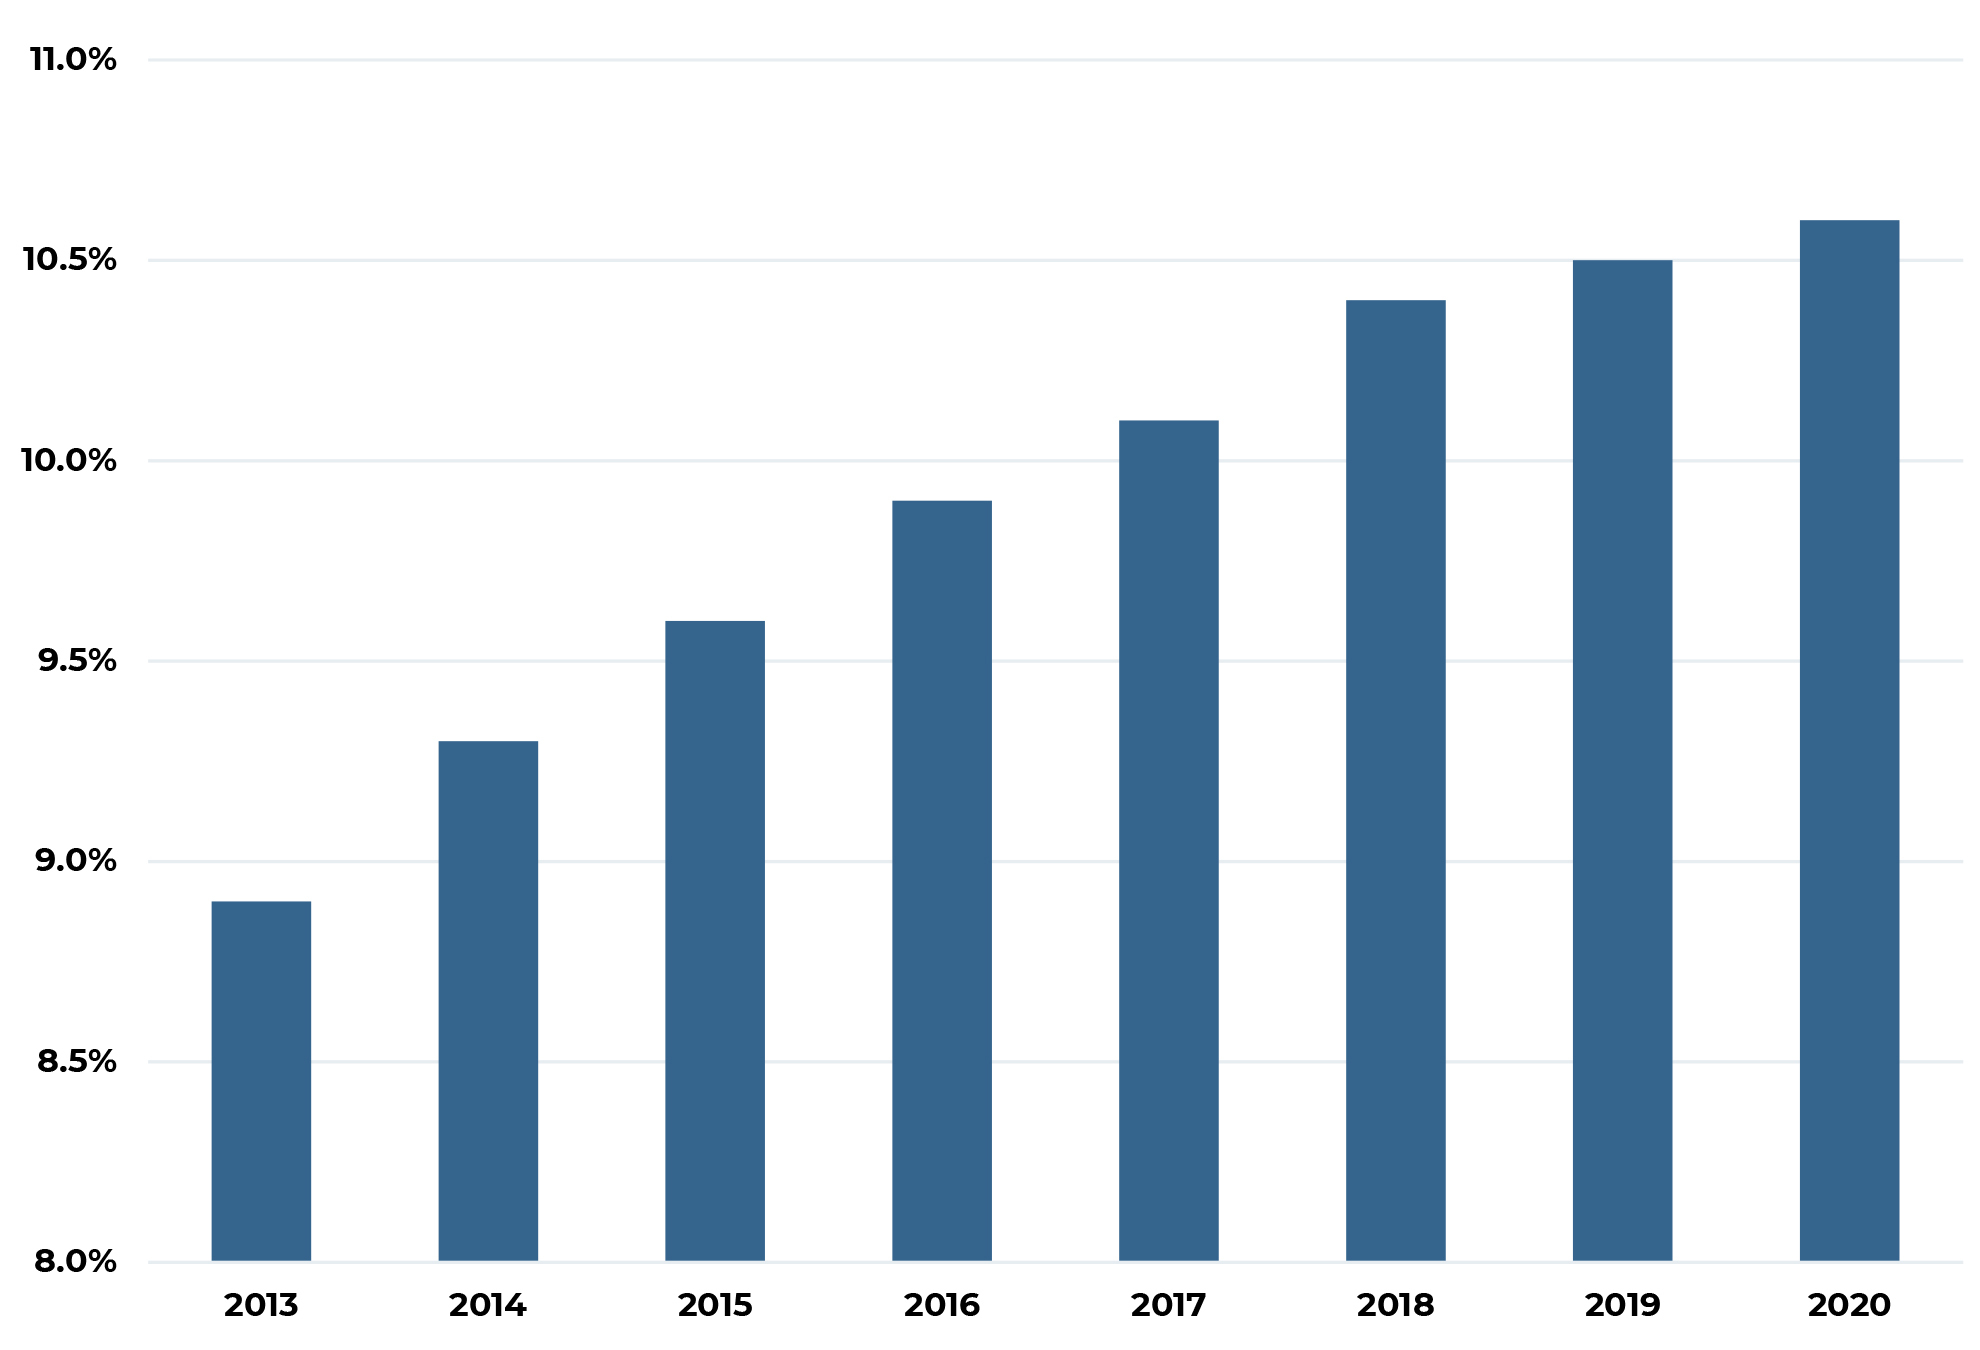
Source: Hodes Weill & Associates/Cornell Baker Program in Real Estate
The characteristics of property returns – stable cash flow and appreciation in line with inflation – are very much in demand. However, many investors, such as most public pension plans, continue to operate with a required actuarial rate of return that is simply higher than what unleveraged core real estate is likely to return over the next several years.
The need to earn higher returns combined with actual allocations well below growing target allocations has resulted in significant capital commitments and large amounts of dry powder capital in higher return seeking strategies. Globally, Prequin currently estimates more than $325 billion of committed, but not yet invested real estate capital (dry powder) compared with less than $200 billion in 2014 and only $165 billion in 2007 on the eve of the financial crisis. In North America, dry powder capital totals more than $200 billion (see Figure 16). The weight of capital is, as always, a double-edged sword, making the investment market both more competitive, but also more liquid. Not surprisingly, most of this capital has been raised in higher return seeking strategies (i.e. value-added, opportunistic and debt) which share the unique characteristics of largely being in closed-end vehicles where the investment period clock has already begun running. This capital will be invested over the next 2-3 years and as such should provide a solid foundation under much of today’s valuations.
Figure 16: North American Dry Powder Capital by Investment Strategy ($ Billions)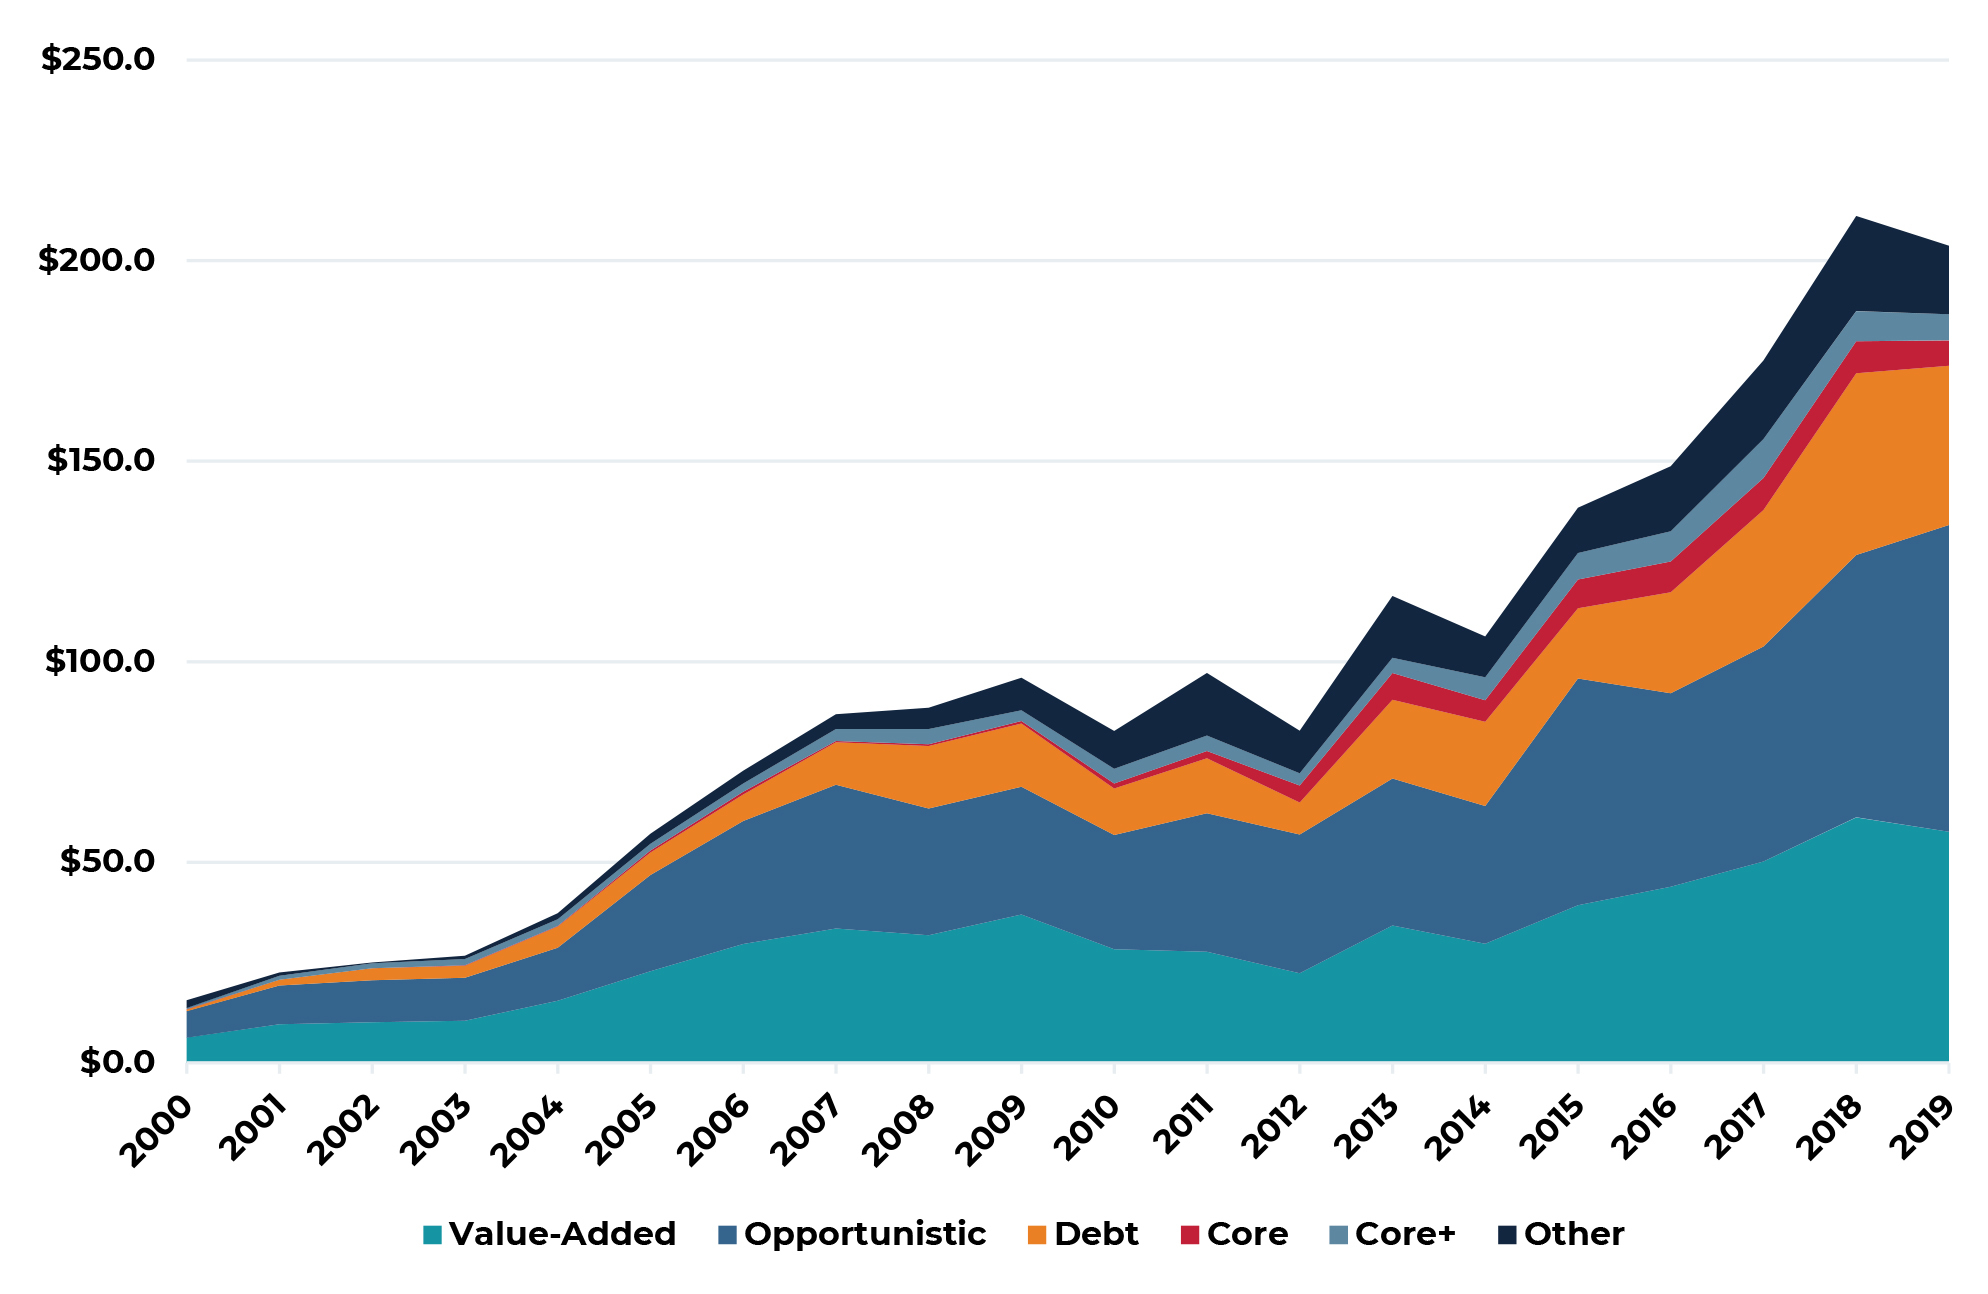
Source: Prequin
Conclusion
Despite officially being the longest period of economic growth in U.S. history, the expansion phase of the current business cycle is far shorter than the expansion phase of other long cycles such as the 1980s and 1990s. The re-synchronization of global monetary policy by the Federal Reserve combined with massive deficit driven fiscal stimulus worldwide suggests that positive, albeit moderate, growth will continue. This is particularly true as some of the more pernicious global trade issues abate. Against this backdrop, investors everywhere continue to struggle with low yields and high asset valuations. In real estate, investors are clearly increasing allocations and shifting capital to higher return seeking strategies. As a result, we now see a significant wall of capital in these strategies that must be invested over the next several years. This environment will test investment managers acumen to find appropriate opportunities as well as the resolve of capital allocators to decide when the long cycle finally becomes late cycle. We believe the tipping point is still several years away.
1 This quote is widely attributed to the physicist Niels Bohr who was quoted as having made the statement in a 1971 Bulletin of the Atomic Scientists. The phrase is also attributed to Yogi Berra and others. Most likely, the phrase was first used by Danish politician Karl Kristian Steincke in 1948.
2 60 Minutes. March 15, 2009.
3 Davis, Steven J., 2016. “An Index of Global Economic Policy Uncertainty,” Macroeconomic Review, October.
4 Price only indices. Each asset class peaked in a different month during 2007-2008 and each line is indexed to equal 100 in that month.
5 Hodes Weill & Associates/Cornell Baker Program in Real Estate. “2019 Institutional Real Estate Allocations Monitor”
The information and opinions presented in this research piece have been prepared internally and/or obtained from sources which AEW believes to be reliable; however, AEW does not guarantee the accuracy, adequacy, or completeness of such information.
