HOW TO NAVIGATE OUT OF THE STORM?
Little could we have expected that last year’s Outlook theme “calm before the storm” would have come alive in the way it has. Since early 2020, Covid-19 has unleashed a storm of news flow and market sentiment. With the pandemic showing a post-summer resurgence in cases, many European governments have recently announced the expected second round lock downs. The economic impact has already been significant and Europe is on course for a recession. Unresolved trade frictions and political uncertainties are expected to slow and prolong the recovery. But with governments and central banks softening the impact and a vaccine widely expected to become available in 1H21, the key question for the moment is: “How can real estate investors best navigate out of the storm?”
COVID-19 CASES IN EUROPE – JANUARY TO OCTOBER 2020
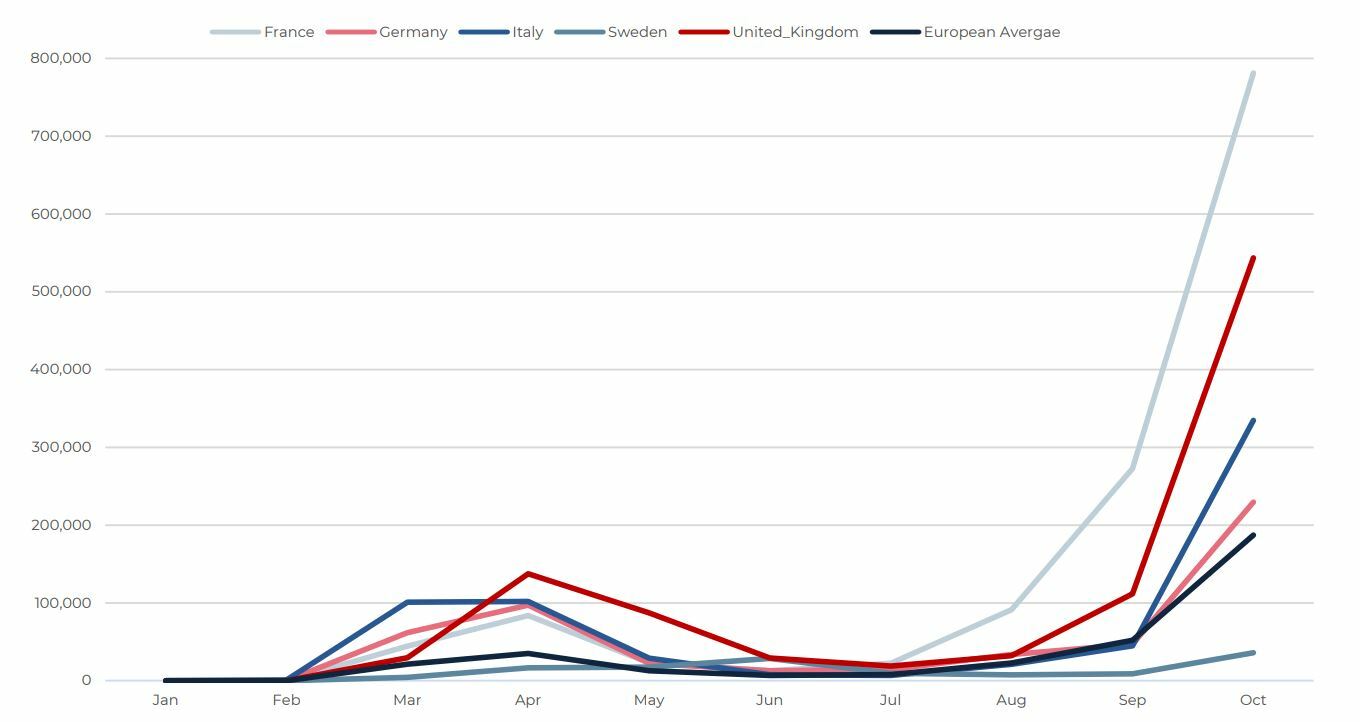
Sources: ECDC & AEW Research & Strategy
EXECUTIVE SUMMARY: RICH PICKINGS AFTER THE STORM
- Covid-19 proved to be the storm we suspected might come at the end of 2019. Worse than in the GFC, its immediate impact on economic growth was softened by strong policy responses.
- The impact from the pandemic has also locked central banks into keeping rates and government bond yields lower than previously expected for much longer. This reversal in policy expectations from last year should keep prime property yields low and capital values stable for the next five years.
- Regardless of the eventual speed of the recovery, rental growth and collections will be lower as many occupiers are likely to be slower to commit to expansion space and some might downsize or sub-let.
- Despite the negative impact on occupiers, our outlook remains positive as new supply of space is coming down. Also, our debt funding gap analysis confirms that refinancing issues will be less in the Covid-19 aftermath compared to post GFC.
- Timing is proving to be key, as 2020 should prove a year of re-pricing in both rents and yields, especially in retail. In our base case risk-adjusted return approach 90 of 103 covered markets are attractive or neutral for 2021-25, a solid improvement from 77 for 2020-24. Rich pickings, indeed.
- In the end, we highlight that investors have compelling opportunities in value-add in mispriced good secondary, light industrial and private rented residential.
- Despite the short term concerns about the pandemic, climate change adaptation and mitigation has also moved up the agenda, helped by better analytical tools.
BASE CASE 2021-25 - EXPECTED VS REQUIRED PRIME MARKET RETURNS
Sources: AEW Research & Strategy
SECTION 1: ECONOMIC BACKDROP
MODEST BASE CASE RECOVERY, BUT DOWNSIDE RISK REMAINS
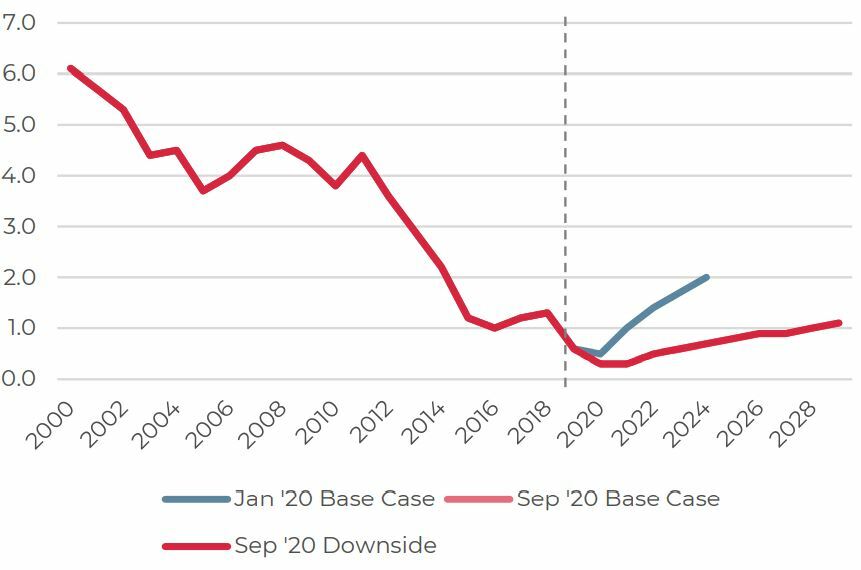
- Given the trigger of the current crisis is medical and not the traditional economic one, there is a higher degree of uncertainty as to how the recovery will develop. Therefore, we use two different GDP growth scenarios going forward while leaving the Jan-20 base case for comparison.
- In our base case, we have 2020 pa GDP growth projected at -8.3% followed by a 5.6% recovery in 2021. For the full 5-year 2020-24 period, a modest 0.9% pa GDP growth is expected across our 20 European countries, as reported by the OECD in its base case.
- The OECD downside scenario assumes a widespread and severe round of second lockdowns. This results in -0.1% pa GDP growth over the 2020-24 period, due to a -10.4% decline in 2020 and a 2.6% rebound in 2021.
- Regardless of the precise speed of the economic recovery, it is clear that growth will be modest in the base case and the risk of a downside scenario with a slower recovery remains in place.
European GDP index (% per annum)
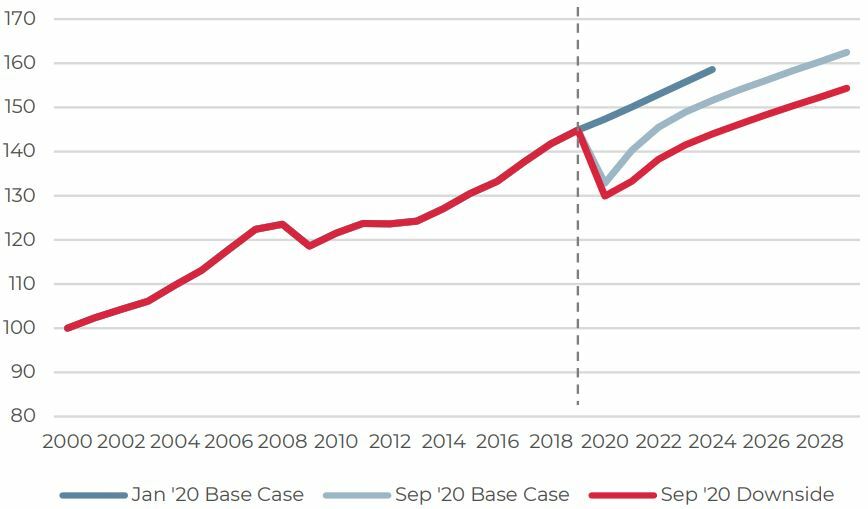
Sources: Oxford Economics, OECD and AEW Research & Strategy 2020 (September – simple growth average across 20 countries)
ITALY AND UK TO EXPECT LOWER GROWTH FOR LONGER
- As we assess the impact on the five largest European economies, Italy and the UK are expected to suffer the largest declines in both the base case and downside scenarios.
- For the UK, the impact of a potential no-deal Brexit is not included in these GDP projections. No-deal Brexit impacts are likely to be spread out over a longer period of time and not just in 2021.
- Spanish GDP projections appear strong compared to the other leading countries and do not take into account the second round of lockdowns. However, it seems reasonable to assume a strong recovery once lockdowns are lifted from its tourism-led economy.
- Please note that we use the OECD GDP scenarios for 2020-21, but revert to Oxford Economics forecasts after 2021 for our property market modelling.
GDP growth forecast 2020-24 (% PA) per country
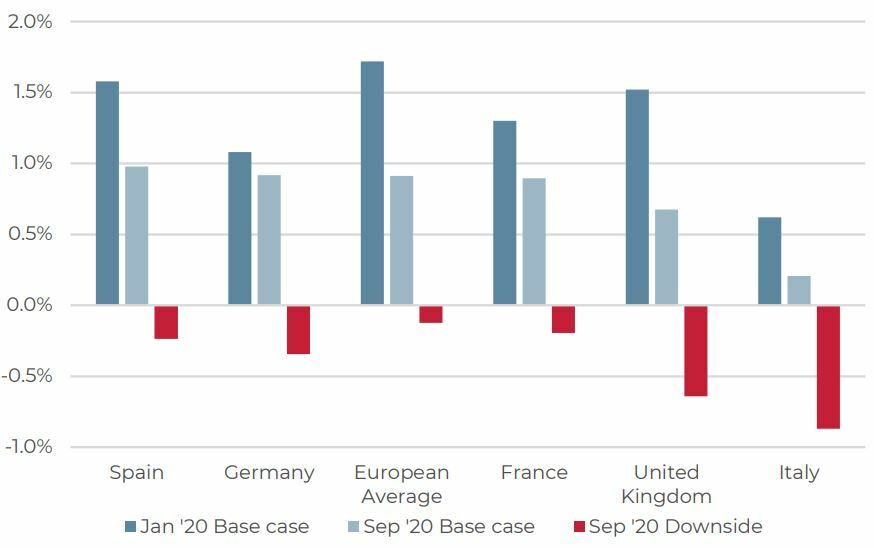
Sources: Oxford Economics, OECD and AEW Research & Strategy 2020 (September)
UNPRECEDENTED AND IMMEDIATE POLICY RESPONSES
- In response to the Covid-19 crisis, most governments have announced immediate and often unprecedented policies to limit its impact on their healthcare systems, populations and economies.
- In most cases there was little international coordination or consistency in policy responses. National governments across Europe announced more policies that involved taking on contingent liabilities, such as loan guarantees.
- Urgency was needed to limit the social impact of the virus, but the economic impact of the initial and second round of lockdowns will be significant - not just on potential growth, but also on debt levels.
- In order to avoid any direct budget impact, the EU’s new Covid-19 related Recovery & Resilience Facility will be separately funded in the capital markets as part of its unprecedented €750bn Next Generation EU (NGEU) plan.
Policy packages in response to Covid-19 (as % of GDP)
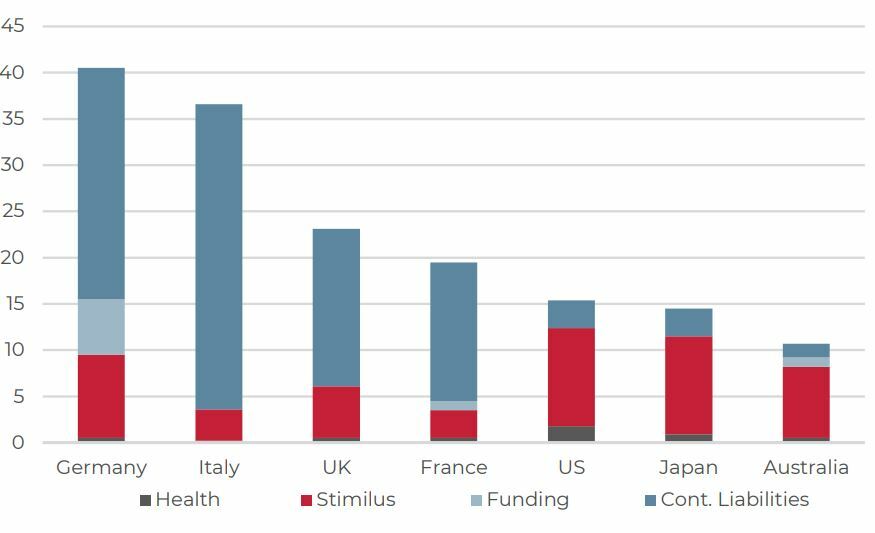
Sources: BIS and IMF, AEW Research & Strategy
CENTRAL BANK BALANCE SHEETS REACH NEW HIGHS
- Over the summer the ECB announced its €1,350bn pandemic emergency purchase programme (PEPP), a quick and decisive response to the Covid-19 crisis. At the same time, the Bank of England increased its APF facility by £645bn, with a further £150bn added in early November.
- As a result of these quantitative easing programmes, combined central banks’ assets are projected to reach new record highs of €7tn by 2022.
- In addition, the ECB is expected to continue to offer loans to banks at its lowest ever rate of -0.75% given the limited number of distress signals in the economy. The BoE has been considering cutting its base rate from +0.1% to below zero.
- Central banks might be forced to keep these accommodative unconventional monetary policies in place for some time to come due to the high and increasing levels of debt, the risk of reversing the GDP recovery and low inflation.
Central bank assets in Euros (trillion)
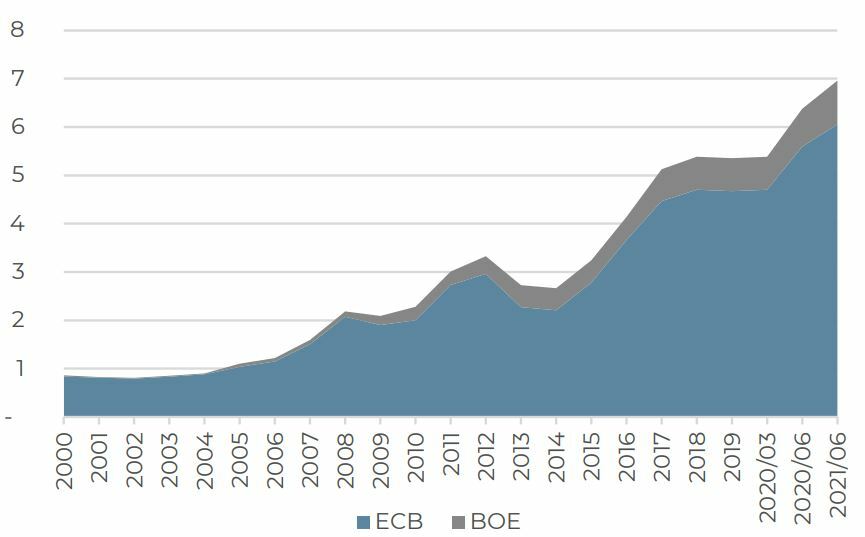
Sources: ECB, BoE, FRED, AEW Research & Strategy
MONEY SUPPLY AND INFLATION DECOUPLED
- As central banks have been easing, the money supply (M3) has increased. Traditionally, money supply and inflation have been positively correlated. With more money to spend and capacity limited in the short term, prices typically go up.
- But, given that commercial banks are increasing their reserves in anticipation of future loan losses and increased capital reserve requirements, the increased money supply is not circulating across the economy as normal.
- This lower velocity in money use has led to a de-coupling of the usual money supply and inflation. Assuming decoupling holds, central banks are offered further policy room without pushing up inflation above its target.
- Also, the ECB and BoE could follow the lead of the Fed, which changed its policy from its traditional pro-actively targeting inflation with rate increases to head off inflation before it hits. The fed is adopting a new approach that would allow it to wait to lift policy rates, until inflation has been running persistently above its target.
Eurozone m3 growth and inflation (Y-O-Y %)
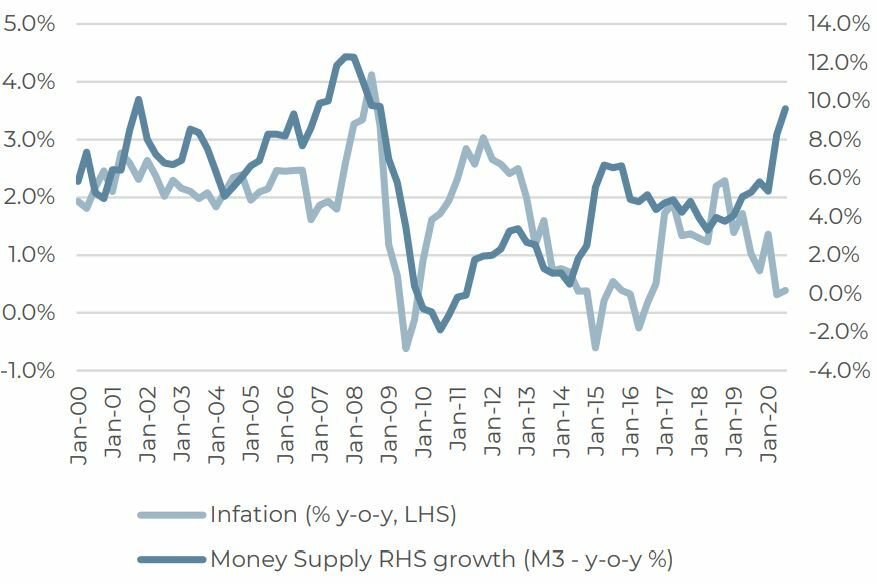
Sources: ECB, AEW Research & Strategy
UNEMPLOYMENT TO INCREASE DESPITE POLICY RESPONSES
- Most governments also announced temporary emergency policies to limit the impact of the lockdown on employment through either labour time reductions, furlough schemes or salary top-up policies.
- Despite these policies being extended into the second round of lockdowns, it is expected that unemployment levels will increase from their year-end 2019 levels.
- As the economic recovery commences in 2021, unemployment is expected to reduce. But in some countries it is expected to take up to five years for unemployment to return to their pre-Covid levels.
- This leaves central banks in a situation where more indebted governments, corporates and consumers are all more sensitive to increases in interest rates, which could more quickly endanger the economic recovery.
Unemployment rate (%)

Sources: Oxford Economics, AEW Research & Strategy
NEXT ROUND OF BANK NPL TO REACH NEW HIGH
- In the aftermath of the GFC, most European banks had large shares of non-performing loans (NPL) on their balance sheets, which were either sold at discounts or written down as required by local regulators.
- These historical solutions are illustrated by the reduction between the historical maximum and the latest NPL ratio in the chart, showing both the relative size of the original NPL problem and their resolution made to date.
- It is unsurprising that on the back of the current Covid-19 crisis, consumer and corporate credit quality will deteriorate again. As a result, NPL ratios will increase again and are expected to reach new highs in Italy, Spain, France and the Netherlands.
- These increased NPL ratios leave commercial banks across most of Europe exposed to future rate increases as well.
Non-performing loan ratio (as % of total assets)

Sources: NPL Market, AEW Research & Strategy
LOW RATES TO KEEP RECORD HIGH DEBT SUSTAINABLE
- As highlighted before, government as well as corporate and household debt as of year-end 2019 has increased in France, UK and US since 2007, with Germany one of the few exceptions.
- With Covid-19-related support policies, we expect a further increase in especially government and corporate debt in 2020-21. This leaves most major economies vulnerable to any interest rate normalisation in the long term.
- The BIS highlights the high level of non-financial corporate debt as being more vulnerable to interest rate normalisation, but commercial banks have also come back in scope as their loan books will suffer in part due to the Covid-19 related recession.
- However, with interest rates remaining at or near record low levels there is no immediate issue with the sustainability of periodic payments. Refinancing issues might be an issue later, including in real estate.
- This might be especially the case for SMEs, as the ratio of companies with interest coverage ratios below 1.0, even at todays low interest rates, is already setting new record highs.
2019 year-end debt-to-GDP ratios per sector (as % of GDP)
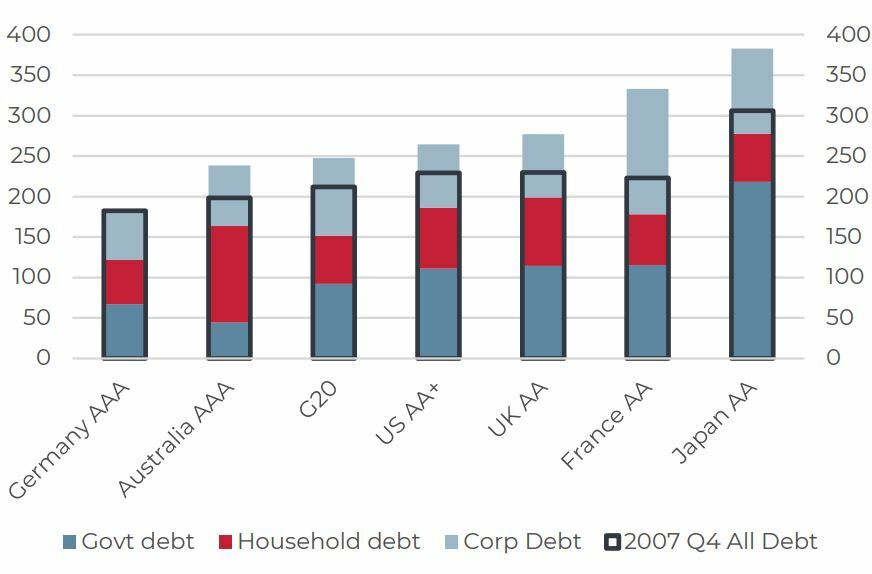
Sources: BIS, AEW Research & Strategy
FUTURE BOND YIELDS LOWER FOR MUCH LONGER
- Currently, central banks are not only facing a recession but also more indebted governments, corporates, consumers and commercial banks more sensitive to increases in interest rates.
- With less danger for increasing inflation in the short term, it leaves central banks little choice than to keep policy rates lower for longer. Quantitative easing further helps in keeping government bond yields lower for much longer as well.
- This monetary policy outlook is a key element for our property yield assumptions and our total return projections across the European markets.
- Our assumptions on future bond yields are being confirmed by the option-implied pricing in the market.
10yr Government bond yield (%, 20 country average)
Sources: Oxford Economics, OECD, Bloomberg, AEW Research & Strategy
SECTION 2: OCCUPIER & INVESTMENT MARKET
IMPAIRED RENT COLLECTIONS BEYOND 2020
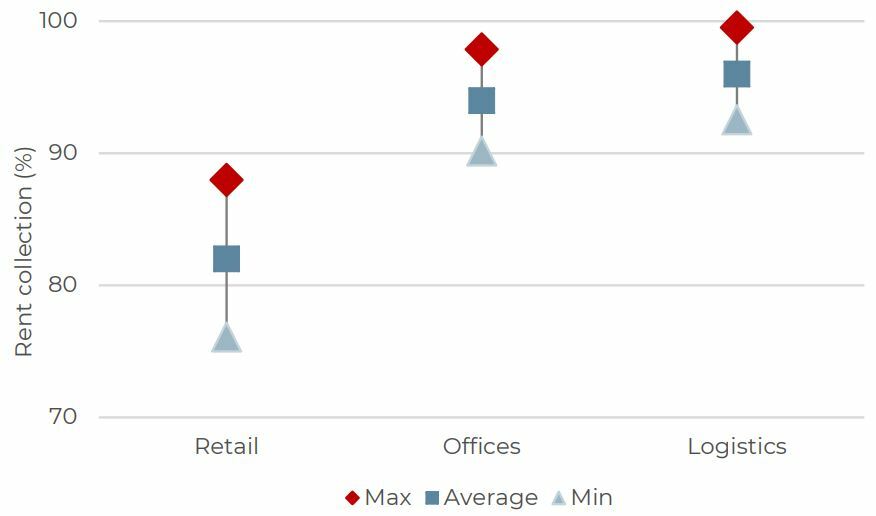
- Cash collections as a percentage of full year 2020 income are assumed at 82% for retail, 94% for offices and 96% for logistics) on a European level based on discussions with brokers, fund managers and desk-based research.
- We apply a proxy based on each country’s GDP growth changes post-Covid to estimate country-sector specific income shortfalls for 2020.
- As a result, retail is expected to have the lowest cash collection at an average of 82% with a country range of 76% to 88%. In contrast, shortfalls are much lower and range between 90% and 98% for offices and between 92.5% and 99.5% for logistics.
- Since lockdowns have been re-introduced in the autumn, we now assume for 2021 that shortfalls will be at 50% of the 2020 level in the base case and 75% of the 2020 level in the downside scenario.
2020 assumed rent collection by sector (as % of contracted)
Sources: CBRE, RCA, AEW Research & Strategy
SLOWDOWN TO AFFECT OCCUPIER DEMAND
- As lockdowns have been announced, relaxed and re-introduced, the impact on occupiers varies widely by sector.
- Many retailers have been forced to shut their shops, office occupiers have temporarily shifted to work from home (WFH) and warehouse users have seen a big increase in e-commerce sales.
- As a result of the GDP slowdown and uncertainty surrounding WFH over the long term, there has been a 34% decline in Q3 office take-up across the 24 markets covered when compared to the same period last year.
- Take-up in logistics warehousing has come down a bit as well. However, this is due to the lack of suitable space in the most desirable urban locations.
- No consistent aggregate take-up data is available for retail, but anecdotal information confirms a decline at a time of increasing retailer CVA’s, administrations and bankruptcies.
24 European office annual markets’ take-up ('000 sqm) & vacancy (%)
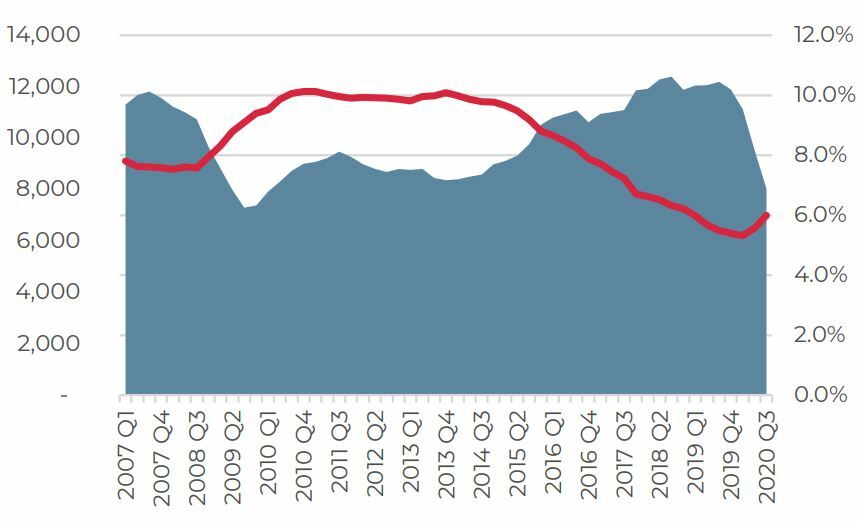
Sources: CBRE, AEW Research & Strategy
SUPPLY COMING DOWN TO MEET LOWER DEMAND
- While it is key to focus on the demand side impact, the supply side needs to be carefully monitored as well, especially as oversupply of new space has exacerbated market downturns in the past.
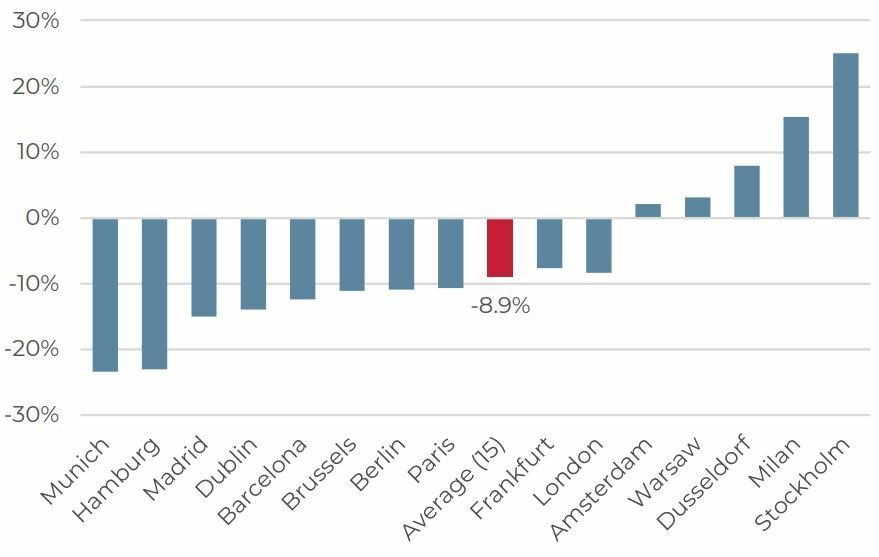
- In the chart, JLL estimates a decline of 9% in 2020-22 supply across 15 markets since the start of 2020. Initially this was a result of Covid-related delays in construction, but we suspect that developers are also responding to lower demand by postponing projects.
- Furthermore, development-focused land and redevelopment acquisitions as a share of total office acquisitions have continued their downward trend.
Change in 2020-22 office supply between Dec-19 & Jun-20
Sources: JLL, AEW Research & Strategy
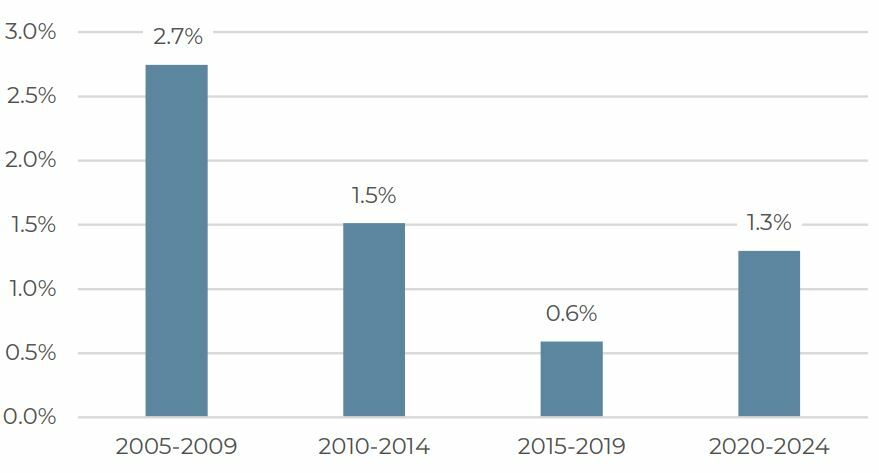
NEW OFFICE SUPPPLY LESS THAN HALF PRE-GFC LEVELS
- Based on CBRE data, the projected new office supply remains at less than half the level seen pre-GFC. As illustrated in the chart, office stock across the 24 markets will grow by 1.3% pa in 2020-24 relative to the pre-GFC period at 2.7% per annum.
- That pre-GFC increase in supply exacerbated the impact on declining office demand, leading to sharp market corrections in vacancy and rents after 2009.
- Despite the increase in 2020-24 European office stock growth compared to the previous five years, it remains modest compared to 2005-09.
- In our rent projections, this lower future supply is taken into account on an individual market level.
European average office stock growth (24 markets)
Sources: CBRE, AEW Research & Strategy
LOGISTICS AND OFFICE RENTS SHOW RESILIENCE
- Logistics and office rental growth for the 2020-24 period are more resilient to the impact of Covid-19 than high street retail and shopping centre rents. This is consistent with the varying degree of impact on occupier demand by sector.
- Many logistics service providers, wholesalers and retailers have seen a big increase in e-commerce sales since the initial lockdowns, which represents a step-up from the trend.
- Despite the uncertainty surrounding WFH over the long term, we expect office take-up to recover with economic growth when a vaccine can be introduced next year.
- Retail rents will be challenged by the increasing share of e-commerce sales. The economic impact of Covid-19 on many retailers and their ability to pay market rents might lead to an increase in % of sales rents. This structural change in leases might help achieve a more sustainable situation for tenants and landlords going forward.
Annualised prime rental growth forecast (5 yr., % 2020-2024)

Sources: CBRE, OECD, Oxford Economics, Bloomberg, AEW Research & Strategy
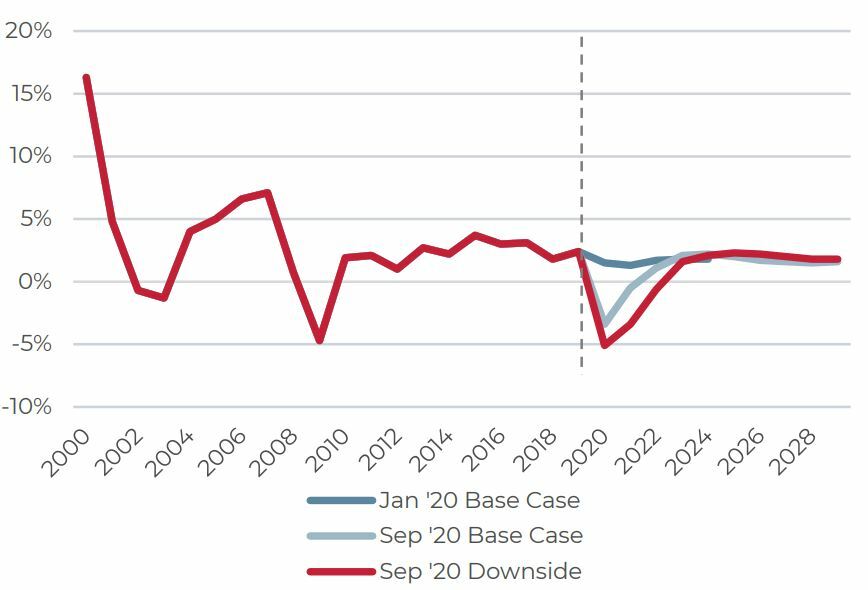
BASE CASE RENTAL IMPACT 30% LESS THAN POST GFC
- Placing the Covid-19 rental growth impact across all sectors in its historical context, we note that in our base case the .impact is only -3.4% or just over 70% of the worst annual post GFC decline of -4.7% in 2008.
- Our three year recovery to long term trend growth rates is significantly slower than in the post GFC period, which might imply that we are conservative – even in the base case scenario.
- In the downside scenario, there is a -5.1% rent impact across the sectors, in line with the post GFC impact level.
- The fact that these forecasts fit well in the historical actual ranges for our markets confirms that these are reasonable.
Average all sector prime rent growth (%)
Sources: CBRE, OECD, Oxford Economics, Bloomberg, AEW Research & Strategy
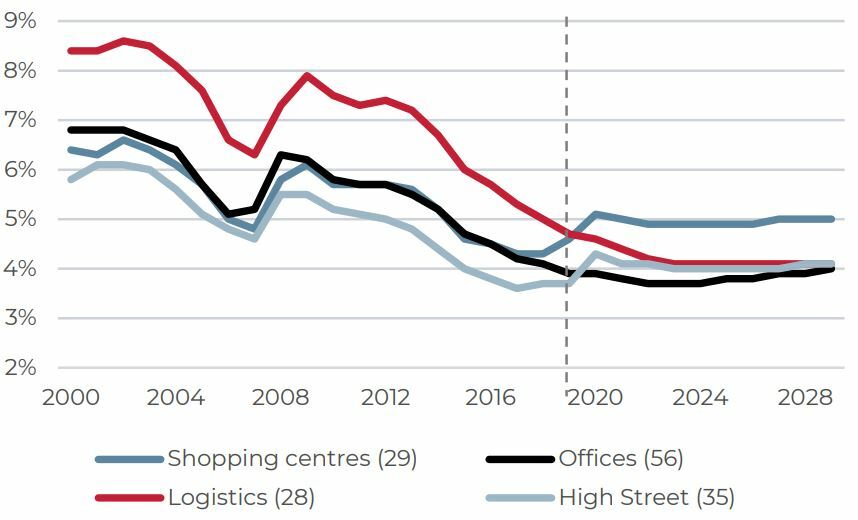
LOWER FOR LONGER PRIME PROPERTY YIELDS
- Based on the latest CBRE data, prime yields in retail have widened by 70-80 bps over the last 3-4 years, while office and logistics yields have continued to tighten by 60-70 bps over the same period.
- As government bond yields are expected to remain lower for much longer, this divergence in yield widening for retail and tightening for logistics and office is expected to stop after 2020 as repricing has been significant already.
- Please note that these projections are across a wide range of markets and pertain to the prime market segment only.
- In the end, our lower for much longer government bond yields drive our prime property yields lower as well.
Average prime yields (%) – Sep-20 base case
Sources: CBRE, OECD, Oxford economics, Bloomberg, AEW Research & Strategy
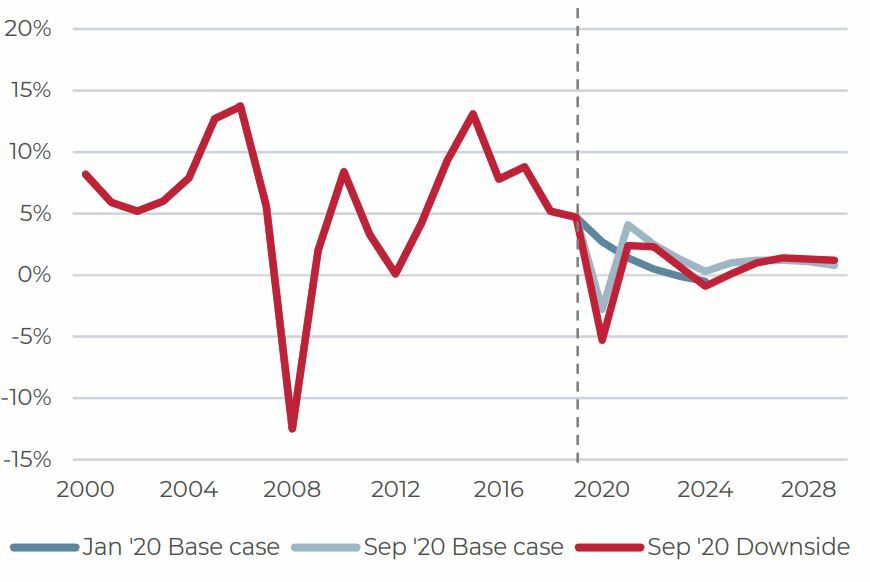
PRIME CAPITAL VALUE DECLINE AT LESS THAN 25% POST-GFC LEVEL
- After taking into account both scenarios’ market rent and yield forecasts, we have projected capital value growth for each of our market segments taking into account the new market rents as they filter into the income over time.
- When we place our Covid-19 capital value impact across all sectors in its historical context, we note that in our base case the 2020 impact is only -2.8% or just under 25% of the worst annual post GFC decline of -12.5% in 2008.
- In the downside scenario, our projections show a -5.3% prime capital value impact across all sectors, which is still less than half the post GFC adjustment.
- Based on the most recent evidence from the investment markets, there is limited price decline implying that our modeling results are reasonable and in line actual historical prime capital value ranges.
Average prime capital returns (%)
Sources: CBRE, OECD, Bloomberg, AEW Research & Strategy
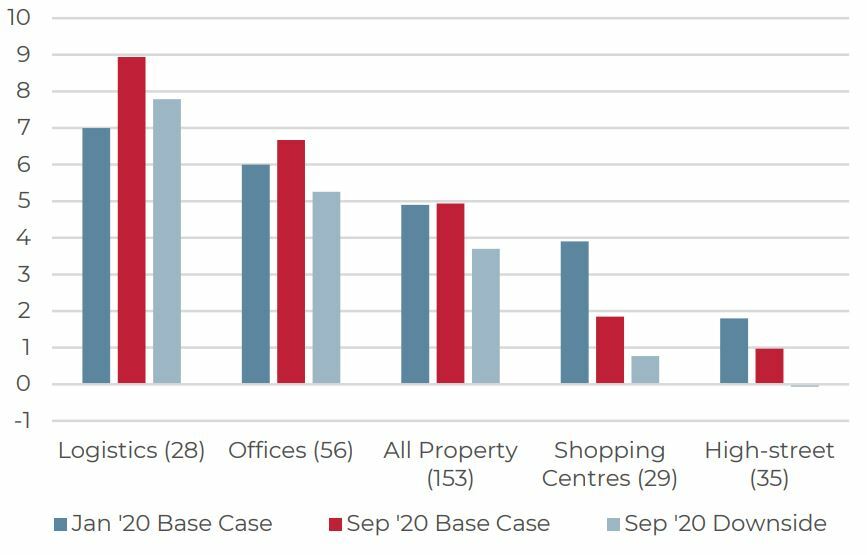
LOGISTICS & OFFICE SHOW BEST RETURNS, BUT RETAIL STAYS POSITIVE
- Logistics and office returns for the 2020-24 period prove again more resilient to the impact of Covid-19 than high street retail and shopping centre returns. This is consistent with rental growth and yield projections.
- Prime logistics markets shows 8-9% pa returns over the 2020-24 period on the back of solid rental growth and further tightening in yields in 2021-22.
- Office returns come in between 5.3% and 6.7% pa for the downside and base case, respectively. This takes into weaker rental growth but some further yield tightening before stabilisation in 2023.
- Retail returns range between 0-2% pa, with prime shopping centres doing slightly better than high street retail in both scenarios. Compared to our previous Jun-20 results this is an improvement, despite the prolonged rent shortfall assumption.
Prime total return forecast (5 yr., % 2020-2024)
Sources: CBRE, OECD, Bloomberg, AEW Research & Strategy
SECTION 3: RELATIVE VALUE VIEWS
REFINEMENTS TO RISK-ADJUSTED RETURN METHODOLOGY
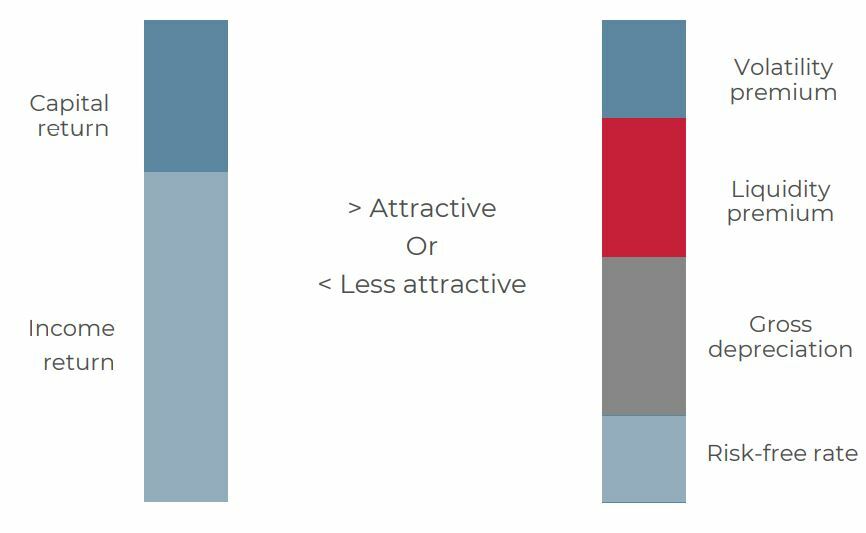
- Despite a few refinements, our risk-adjusted return approach is based on a comparison between the required rate of return and the expected rate of return over the next five years for each prime market segment.
- Methodology refinements were focused on updating each of the three risk premia (depreciation, liquidity and volatility) with the latest data. From this year, we will also be using INREV data for capital expenditure. Also, we normalized the liquidity premia against the global universe of markets and capped the risk free rate at zero.
- By comparing the expected rate of return (ERR) with the required rate of return (RRR), we classify markets accordingly as attractive, neutral or less attractive.
- Therefore, if the ERR is higher than the RRR and not in the neutral zone, we classify it as attractive market.
Expected rate of return (ERR) Required rate of return (RRR)
Sources: AEW Research & Strategy
RELATIVE VALUE IMPROVES AFTER 2020, EVEN IN RETAIL
- If we first consider the sector-level results across Europe in our base case, we note that all logistic markets remain attractive in both the 2020-24 and 2021-25 periods.
- Timing is relevant as becomes clear for offices, which already shifts from 22 attractive markets in the old 2020-24 period to 30 in the new base case, but remaining mostly unchanged in the 2021-25 period.
- But timing implications are most pronounced with retail, as we see 23 markets turning attractive in the 2021-25 period, up from only 5 in the 2020-24 period. This is mostly due to the upward yield shift in retail for 2020, which will benefit new investment from 2021 onwards.
- Please also note that the impact of our new cash shortfall and yield widening on retail are easily shown from 11 attractive markets for our old base case from Jan-20 to only 5 in our new base case.
% sector markets by attractiveness (Old vs New Base Case)

Sources: CBRE, RCA, INREV, Oxford Economics, OECD, AEW Research & Strategy
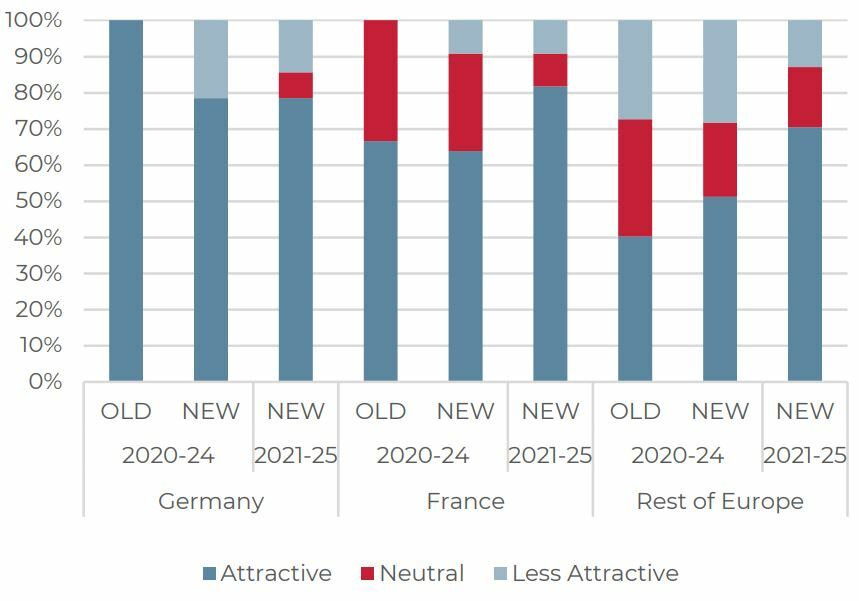
GERMANY UNCHANGED, FRANCE IMPROVES, BUT REST BENEFITS MORE
- Next, we consider the country-level results in our base case. We note that 11 of 14 German markets remain attractive in both the 2020-24 and 2021-25 periods.
- Again we assume a five-year holding period, making timing relevant. This is confirmed for the French markets, which come second in terms of share of attractive to total markets, with an increase in attractive markets from 7 of 11 in the 2020-24 to 9 of 11 in the 2021-25 period.
- However, the timing impact is more significant with other European markets, as we see a majority of 55 markets as attractive in the 2021-25 period, up from just over half in the 2020-24 period.
- The scatter plots for all markets are covered on the next pages. More detailed results are available upon request.
% country markets by attractiveness (Old vs New Base Case)
Sources: CBRE, RCA, INREV, Oxford Economics, OECD, AEW Research & Strategy
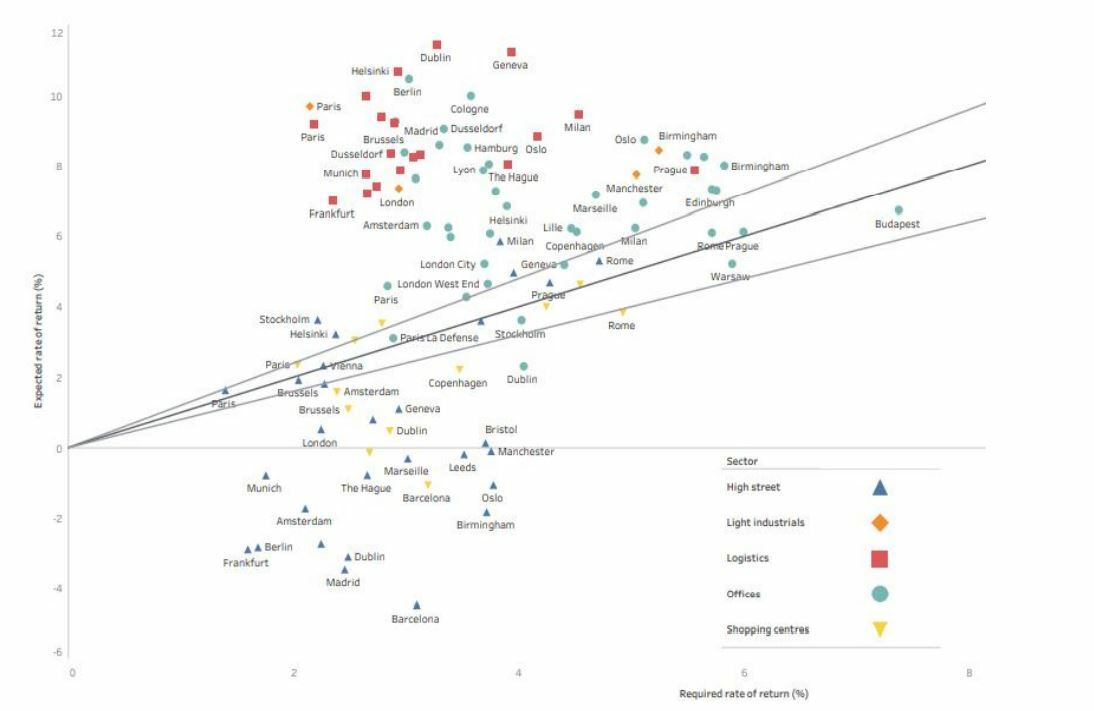
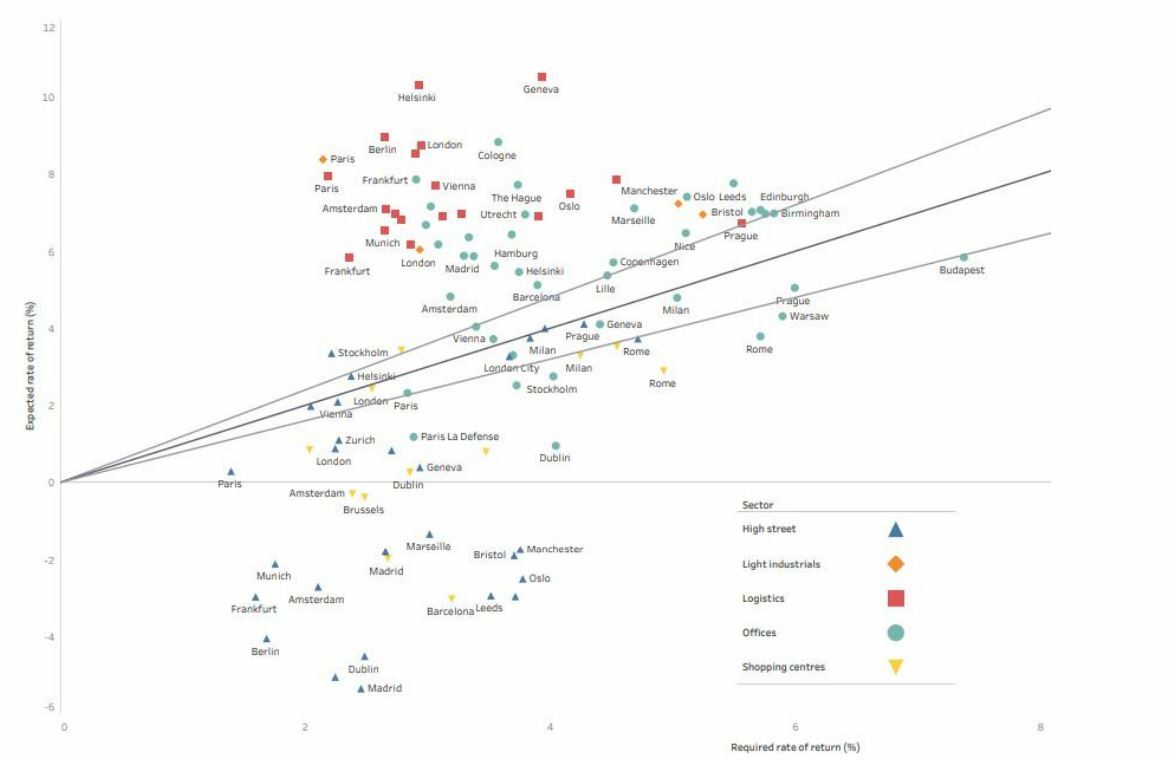
SOLID IMPROVEMENT AFTER 2020 IN BASE CASE
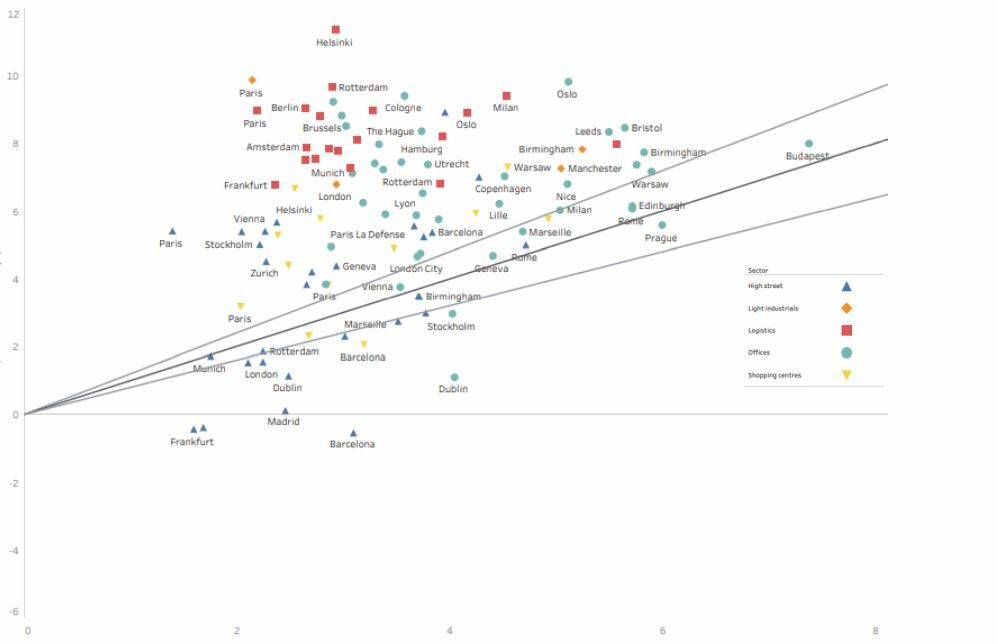
- When considering our base case results for all of our 103 markets, we focus on both the 2020-24 & 2021-25 period to highlight the aforementioned importance of timing. On the horizontal axis, we have the required rate of return and on the vertical axis we have the expected rate of return for the next five years. The grey lines indicate a range of 20% of the difference between the two, which we think is a good range where markets are not clearly over- or underpriced. In other words, markets within this middle range are labelled as neutral.
- First of all, we observe the strength of the logistics sector amplified by the strong growth in e-commerce disregarding the timing effect. Timing is much more important in the retail sector. For example Paris becomes attractive in the 2021-25 period.
- Other noteworthy markets that are expected to become more attractive in the 2021-25 period are some of the CEE office markets and Nordic retail markets that seem to benefit from repricing.
- Finally, all office markets in Germany are labelled attractive as the expected rate of return is higher than the required rate of return. This means that the office sector in Germany remains buoyant amid robust fundamentals and low vacancy rates.
Base case 2020-24 – expected vs required prime market returns
Base case 2021-25 – expected vs required prime market returns
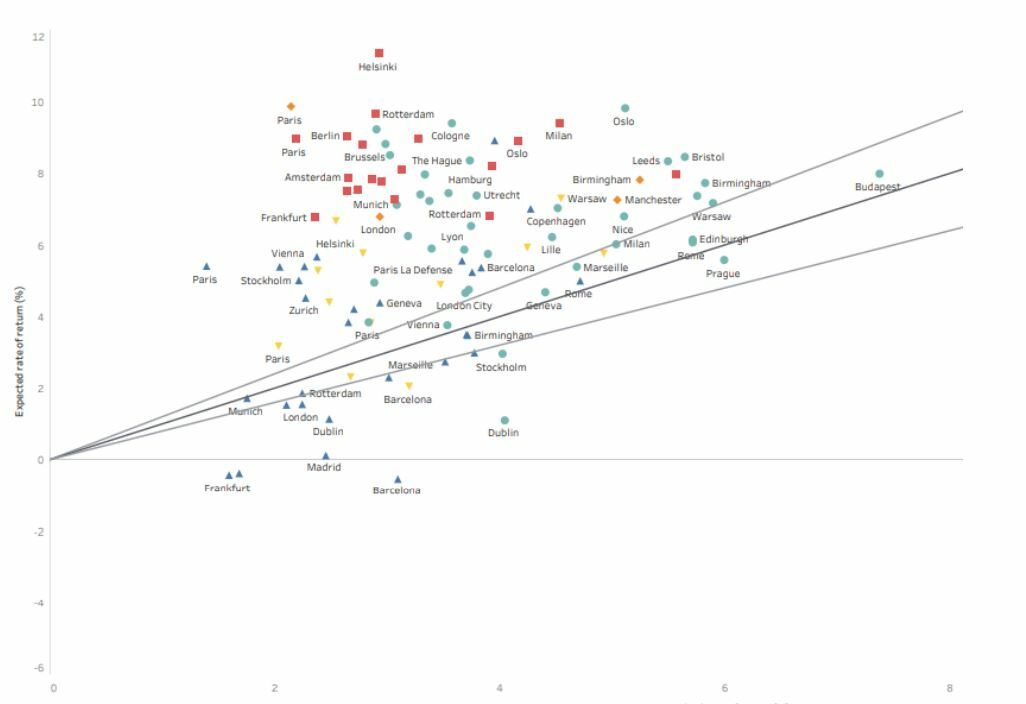
Sources: CBRE, RCA, INREV, Oxford Economics, OECD, AEW Research & Strategy
2021-25 DOWNSIDE STILL IMPLIES MOSTLY ATTRACTIVE MARKETS
- Next, we switch to our downside scenario results for our 103 markets. In this scenario, we use the double dip OECD scenario which implies a prolonged period of slower growth as a result of new restrictions and lockdowns impacting the real estate market.
- Using the same approach, we see that the switch is noticeable in the office and retail sectors in the downside scenario as for both time-frames, the number of unattractive markets increases (from 26 to 38 in the 2020-24 period and from 13 to 24 in the 2021-25 period) while the number of attractive markets shrinks.
- In the logistics sector all markets remain attractive in our downside scenario as market fundamentals are resilient and yields relatively high. However, Dublin logistics might be a market that suffers from the double-hit scenario as the market remains attractive but just outside of our neutral area.
- Despite the downside scenario, we still expect some regional office markets to outperform this as the office occupier market fundamentals (supply and debt levels) at the onset of the pandemic were strong.
Downside 2020-24 – expected vs required prime market returns
Downside 2021-25 – expected vs required prime market returns

Sources: CBRE, RCA, INREV, Oxford Economics, OECD & AEW
SECTION 4: THREATS & OPPORTUNITIES
DEBT FUNDING GAP QUANTIFIES REFINANCING RISK
- To quantify the impact on the real estate market of excess leverage and capital value declines we estimate the Debt Funding Gap (DFG), as illustrated in the chart by the following four steps using an exaggerated UK retail loan example:
−The original acquisition of a sample property at €200mn in 2016 with a loan at 75% LTV.
− COVID-19 related downside adjustment of the retail asset’s value of 37.5% over the next four years.
− Refinancing of the new asset value at the bank’s lower LTV of 60%.
− DFG is €75min - difference between €150mn original debt and new refinancing of €75mn.
- Investors and lenders need to bridge this re-financing gap to rebalance their positions. In this respect, the lender can take write-downs or sell their loan position at a discount. Also, the investor can top up their equity to protect their initial investment against lender enforcement.
- Please refer to our report “COVID-19 triggers re-financing issues” (Sep-20).
Step-by-step estimation of the Debt Funding Gap

Sources: AEW Research & Strategy
GERMANY MORE RESILIENT, WITH RETAIL DRIVING DFG IN UK
- In absolute terms, the German DFG at €54bn is larger than the UK’s €33bn DFG. But, Germany’s DFG at 10.5% of outstanding loans is below the UK’s 16.6% since the German lending market is much bigger than the UK.
- The difference between the UK and German DFGs can also be partially explained by the fact that the German market is expected to be more COVID-19 resilient resulting in lower capital value declines than in the UK.
- The UK DFG is predominantly sector specific with retail estimated to be around 45% of the total. Therefore, sectors such as logistics and residential are expected to be more resilient and only contribute a small portion of the DFG.
- The UK DFG over the next four years is expected to be the largest in 2022.
Debt Funding Gap in €bn & % of loans outstanding
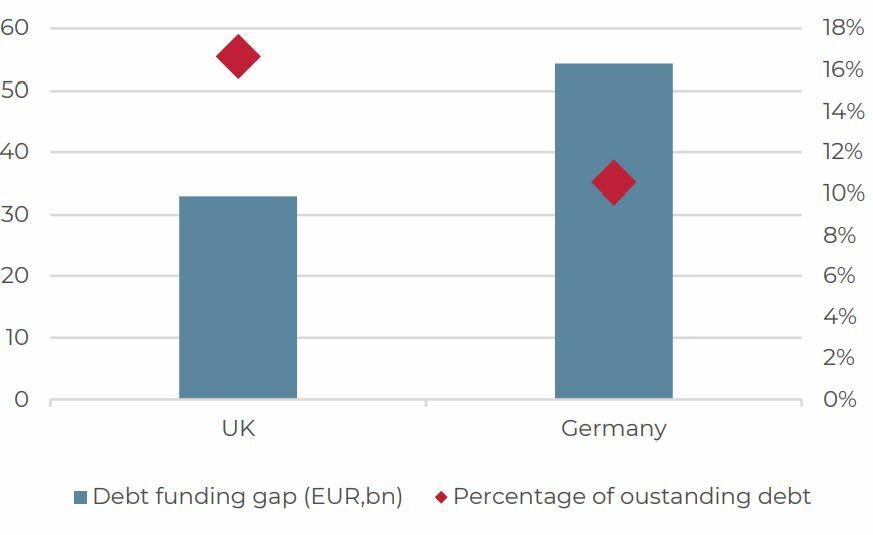
Sources: IREBS, Cass Business School, CBRE & AEW
COVID-19 PUSHES REFINANCING ISSUES TO NEAR HALF GFC LEVELS
- The 2020-23 UK DFG at 17% of outstanding loans is about half the level witnessed during the aftermath of the Global Financial crisis.
- The reasons for the lower DFG in 2020-2023 are stricter bank regulations and more conservative acquisition LTVs combined with less severe capital value declines compared to the post GFC period.
- In the 8 years following the GFC, the UK DFG was bridged by a combination of bank losses from discounted sales of non-performing loan portfolios (NPL) and loan write-downs as well as implied equity top ups from investors.
- If we assume a similar negotiated approach with lenders and investors bridging the upcoming COVID-19 DFG, €39bn will be needed from investors in the UK and Germany over the next 8 years (2020-27).
- German and UK banks have the highest capital ratios in Europe and are better positioned to take losses, which might benefit debt-funded investors.
- Finally, initial estimates show that overall NPL ratios for German banks are not exceeding previous maximum levels, possibly further benefitting investors.
Actual and bridging of the debt funding gap in Euros bn
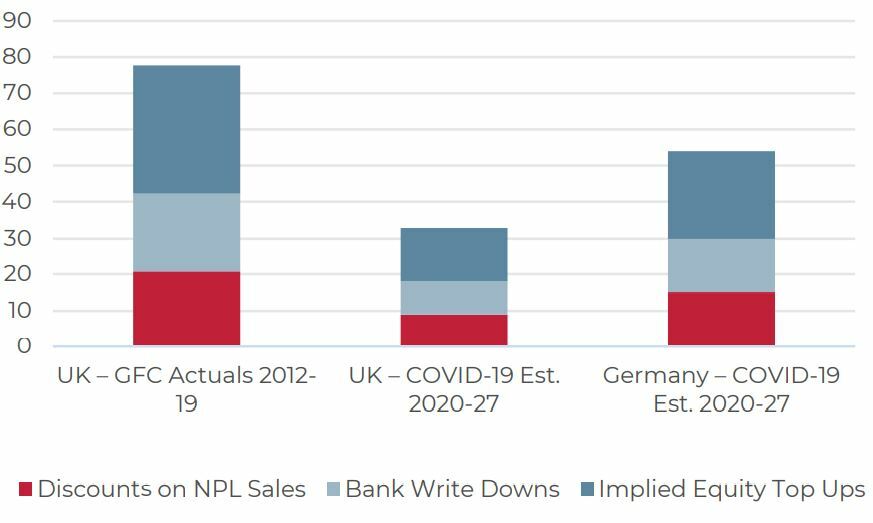
Sources: Cass, IPF and IREBS AEW Research & Strategy
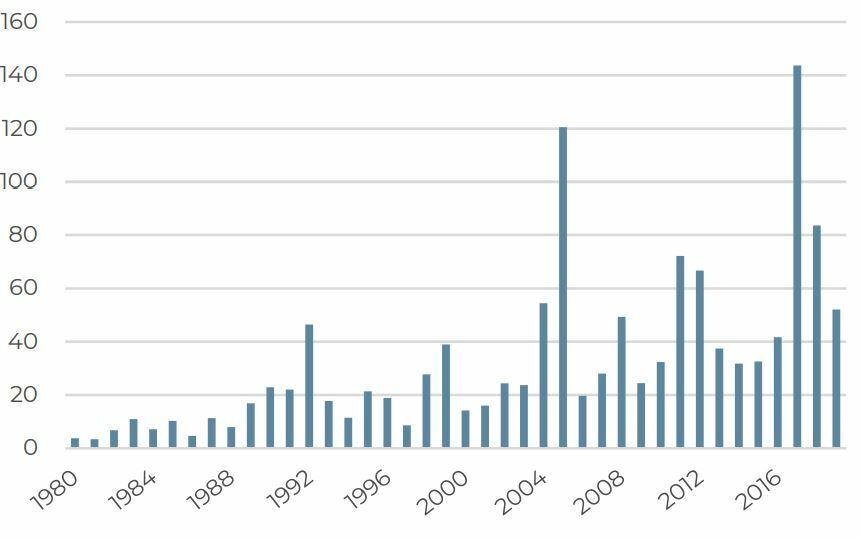
CLAIMS FROM CATASTROPHE LOSSES SHOW UPWARD TREND
- Climate change risks have increased as illustrated by growing insured natural catastrophe losses over the past 40 years.
- Based on growing public support and political initiatives, global agreements, EU directives and national laws will likely require investors to adapt to climate change risks.
- Real estate contributes nearly 36% of green-house gas (GHG) emissions and will become a bigger focus. Therefore we will have to adapt to both direct physical risk of climate related catastrophes as well as the indirect transitional risk associated with energy and GHG reduction regulatory requirements.
- Building and fund-level certifications have not been designed to fully deal with these risks.
- However, there are innovative new tools available to manage climate related risks.
- Please refer to our report “Managing & pricing climate risk” (Feb-20).
Insured Losses from Natural Catastrophes Worldwide (US$ Billion, in 2019 values)
Sources: MunichRE, AEW Research & Strategy
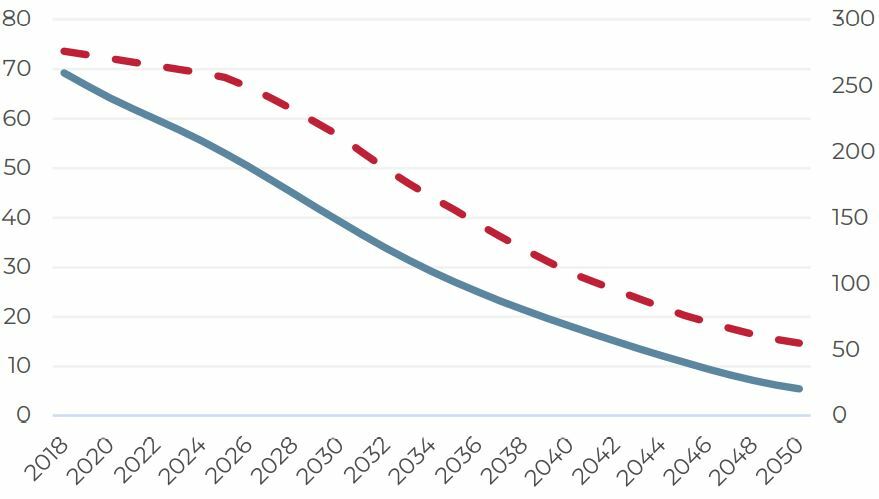
FROM ENERGY INTENSITY ‘INPUT’ TO GHG INTENSITY ‘OUTPUT’
- The logical next step is for policy to align itself to climate change by moving on from energy use intensity as an input towards GHG intensity as an actual carbon output.
- To illustrate the difference, we show the UK energy reduction as well as GHG pathway by using the Carbon Risk Real Estate Monitor (CRREM) data.
- There is a similar trend between the two, however it is not a like-for-like correlation as the GHG or de-carbonisation pathway is much steeper in the beginning.
- Existing grid de-carbonisation can drive the GHG pathway despite a lower reduction in energy use.
Decarbonisation (kgCO2e/m²) & energy reduction (kWhh/m²) pathways
Sources: CRREM, AEW Research & Strategy
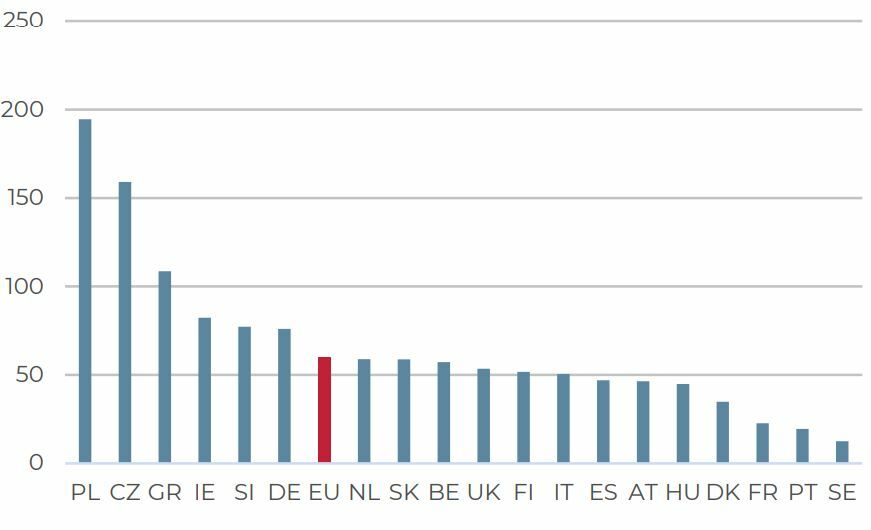
GHG INTENSITY REDUCTIONS TO 2050 VARY WIDELY ACROSS EU
- The Paris Accord specifies a global carbon budget for the total amount of GHG to be emitted until 2050 to not exceed 2.0 degrees Celsius global warming through to 2100 (784 giga-tons of carbon emissions).
- A specific carbon budget for the European commercial real estate sector is the basis for the reduction in GHG for each EU country.
- This chart shows the wide geographical dispersion in required GHG intensity reduction by 2050 around the 60 kgCO2 emission per square meter per annum European average.
- France, Denmark, Sweden and Austria benefit significantly from their high nuclear and renewable energy mix, as their required reduction is low, however, governments in Germany and a number of CEE countries have much more to do in this respect.
- Please note that it might not always be clear where the legal responsibility rests between landlords, tenants, national regulators and/or local governments to reduce the properties’ GHG intensity.
GHG Intensity reductions needed by country (KgCO2e/m2)
Sources: CRREM, AEW Research & Strategy
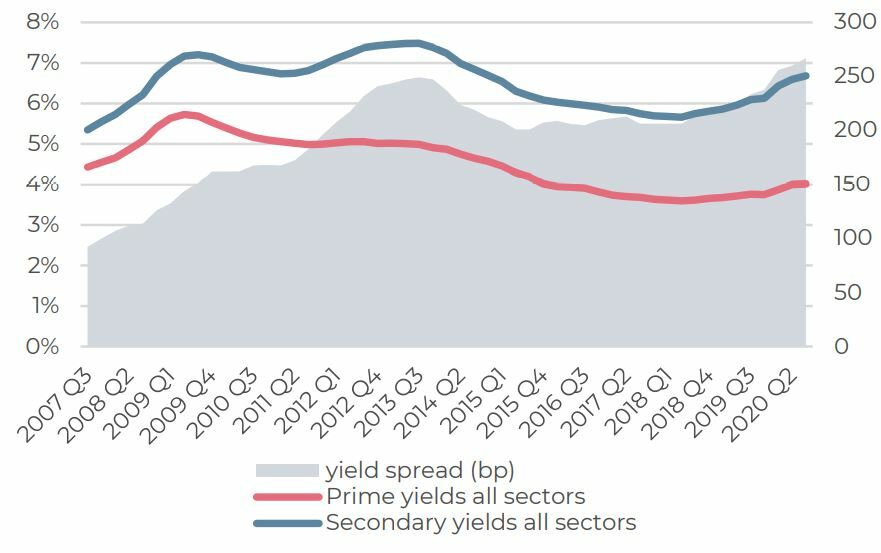
OPPORTUNITY: VALUE-ADD IN MISPRICED GOOD SECONDARY
- Q3 2020 showed a near 270bp spread between core and non-core property yields, its highest level since 2007.
- With many traditional investors focused on potential downside risks from the impact from the Covid-19 crisis, interest for any new acquisitions is expected to remain limited to the low-risk core segment of the market.
- Investors with a higher risk tolerance might focus their available capital on NPL portfolio sales from banks and the recycling of the collateral assets backing these loans leaving non-core assets with few natural buyers.
- Based on our stabilised lower for longer prime property yield forecasts, we would expect the excess spread for non-core to break its own record levels for some time to come.
Europe (inc. UK) core vs. non-core property yields
Sources: CBRE, AEW Research & Strategy
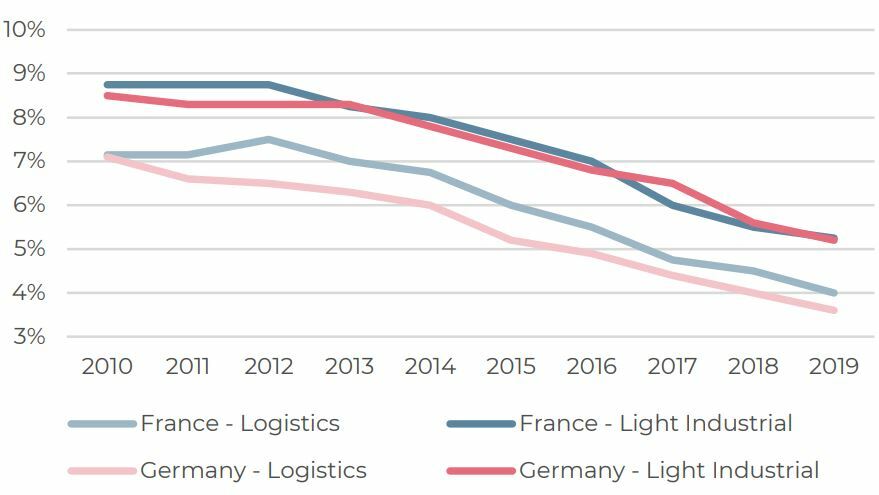
OPPORTUNITY : LIGHT INDUSTRIAL’S EXCESS YIELDS OVER LOGISTICS
- Some investors have struggled to access logistics deals as prime yields have tightened since 2009. Logistics yields are below shopping centre yields already and projected to break through high street levels by 2023.
- But, both traditional and urban light industrial offers an alternative from prime logistics with a similar industrial, logistics and transport tenant exposure.
- Typically, light industrial has a larger number of smaller tenants compared to logistics. Combined with lower tenant credit quality, this requires a more pro-active asset management approach.
- As a result, light industrial has been consistently delivering excess yield over prime logistics across the French and German markets. Based on year-end 2019 data, these excess yields still stands at 125-160 bps.
Logistics & light industrial yields for France and Germany
Sources: CBRE, BNP PRE, AEW Research & Strategy
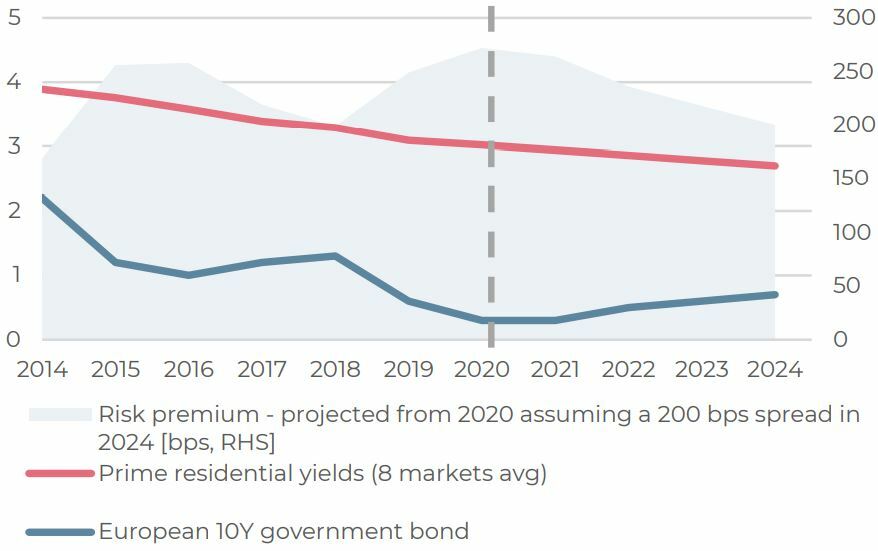
OPPORTUNITY: PRIVATE RENTED RESIDENTIAL REFLECT LOW RISK
- Demand is expected to consistently outpace supply in Europe’s private rental residential markets. Resulting high occupancies, limited void periods and solid rent growth translate into stable, low risk income streams to investors.
- Residential investment market volumes have increased fivefold since 2008 and the sector now represents 25% of the overall market. Low interest rates will continue to push house price growth going forward offering investors capital appreciation.
- Residential is also proving resilient in the context of Covid-19 despite the potential negative impact from rising unemployment. Rent collection rates have been close to 100%, based on the most recent data from European REITs.
- European prime residential yields are 3.25% on average. With the current 250bps risk premium over government bonds expected to remain above 200 bps over the next five years, it offers investors attractive returns.
Prime European residential yields & risk premium over 10y Government bond yields
Sources: CBRE, Bloomberg, Green Street, AEW Research & Strategy
READ THE FULL REPORT
WATCH THE WEBCAST
The information and opinions presented in this research piece have been prepared internally and/or obtained from sources which AEW believes to be reliable; however, AEW does not guarantee the accuracy, adequacy, or completeness of such information.
