Investment Strategy
Evidence for a recovery is underway in Asia Pacific, but the path toward normalization is expected to be intermittently interrupted as COVID-19 case flare-ups surface across various markets in the region, leading to localized mitigation responses. Current economic projections have been downgraded since April 2020, but expectations are for the second half of 2020 to be better than the first.
Over the past months, landlords across many markets have gained a better understanding of how various forms of tenant incentives or rental discounts will impact near-term cash flows and returns. As a result, investors are actively seeking discounts to price for the short-term deterioration in income. Vendors, however, appear to have strong holding power in today’s environment compared to the last financial crisis - current property owners have lower leverage and have largely structured deals to prudently allow for downside. As a result, bid-ask spreads continue to widen, and few deals have reached conclusion in H1 2020. Outside of retail and hospitality assets, we do not expect to see any wave of deep discounts or distressed sales in the major gateway markets of Asia Pacific.
There continues to be a weight of capital in the region. Private funds have about $84 billion of dry powder to invest, and fund closings continue as 2020 progresses. In H1 2020, about $11.6 billion have been raised for Asia Pacific real estate strategies, on track to reach the target $25 billion by year-end. A still-strong fundraising environment indicates investors remain optimistic about the long-term performance of real estate relative to other asset classes. A key difference seen in recent surveys, however, is a stronger gravitation to lower risk strategies.
Structural macro themes in the region are still ongoing and the pandemic has accelerated some of these trends. Digitization and growth in e-commerce are benefiting data centers and logistics assets but are causing further headwinds in retail properties. Meanwhile, increasing importance of the health and wellness of employees has demanded higher standards of building quality and resilience in the office sector. While there are some concerns that work from home trends could meaningfully impact the demand for office space going forward, we are unlikely to see these trends prevail in the region due to a mix of cultural factors, space constraints in urban homes, and the potential de-densification of the workplace.
AEW targets investments across a range of sectors and regions. In the office sector, location and building quality will be key value drivers for buyers. Business parks that house industries such as technology-related firms, research & development, and media-related businesses are anticipated to benefit from the online consumption shift. Deals assessed today require a deeper analysis of tenant creditworthiness, as well as an evaluation of the repayment of any income delayed due COVID-19 rent relief measures mandated by some local governments. In the coming months, there could also be opportunities to acquire retail assets at deep discounts – these could be interesting from a repositioning or conversion perspective.
Economy
Global growth forecasts for 2020 have been downgraded to a 4.9% contraction as the COVID-19 pandemic continues to affect lives and economies around the world. Forecasts today versus April 2020 account for a larger contraction in H1 2020 and a slower than expected recovery in H2 2020. Regionally, Asia Pacific is slightly ahead, with the expectation of a 0.8% contraction for the year, while the U.S. and Euro Area are expected to see declines of 8.0% and 10.9%, respectively. The International Monetary Authority (IMF) expects global growth to recover by 5.4% in 2021, returning to pre-COVID output levels. There is a lot of uncertainty regarding the outlook, with much dependent on the successful containment of the virus, as well as the development and accessibility of a vaccine. Downsides to the current forecasts include further fallout from the pandemic and escalating geopolitical tension between major world economies.
Most major markets in Asia Pacific spent part of Q2 either in lockdown or with strict social distancing measures in place. As a result, GDP further contracted in the quarter, followed by increases in unemployment. The only exception to this was China, which reported better-than-expected growth (up 3.2% year-on-year), giving confidence to an ongoing recovery. The expansion in China was led by improvements in industrial production (4.4% year-on-year) and fixed asset investment (5.6% year-on-year). Encouragingly, by the end of Q2, most other Asian developed economies had reopened non-essential production or services and relaxed social distancing restrictions. The initial reaction was positive, as pent-up demand supported a pick-up in consumption in the weeks following. However, complicating this recovery path is a recent resurgence of cases seen in parts of Australia, Hong Kong, Tokyo and Seoul. While these spikes have unwound some of the progress made, we expect this to be temporary and for regional growth to be better in H2 2020.
As mentioned in the previous edition of this report, government support packages within the region have been generous, ranging from 7% to up to 40% of GDP (including a mix of direct spending and financial measures). These have further increased between May and July with more measures being announced. In South Korea, Singapore and parts of Australia, a distinct pivot from support to growth has been observed, with fiscal investment contributing to fast expanding industries such as 5G, digital services and medical services. Various governments are also making efforts in retraining or rehiring workers. For example, in Singapore, a National Jobs Council has been formed to support about 100,000 persons through new jobs, traineeships or skills upgrading, while in China, State-Owned Enterprises (SOEs) have been directed to increase headcounts with places specifically observed for new graduates. Besides fiscal support, loose and accommodative monetary policy has played a major role in supporting businesses and households through this period. Year-to-date there have been multiple rate cuts across the board in the major Asia Pacific economies, and some central banks have embarked on their own version of quantitative easing.
Compared to Q1, Asia Pacific currencies performed much better, with most either appreciating or remaining relatively stable relative to the USD. In Q2, the AUD was up the most (+12.6) while the others, SGD (+2.0%), KRW (+1.3%) and CNY (+0.2%) saw only marginal increases. With a comparatively better recovery trajectory for the region (barring any major changes) we expect the Asia Pacific currencies to continue to appreciate relative to the USD for the remainder of the year.
MACROECONOMIC INDICATORS
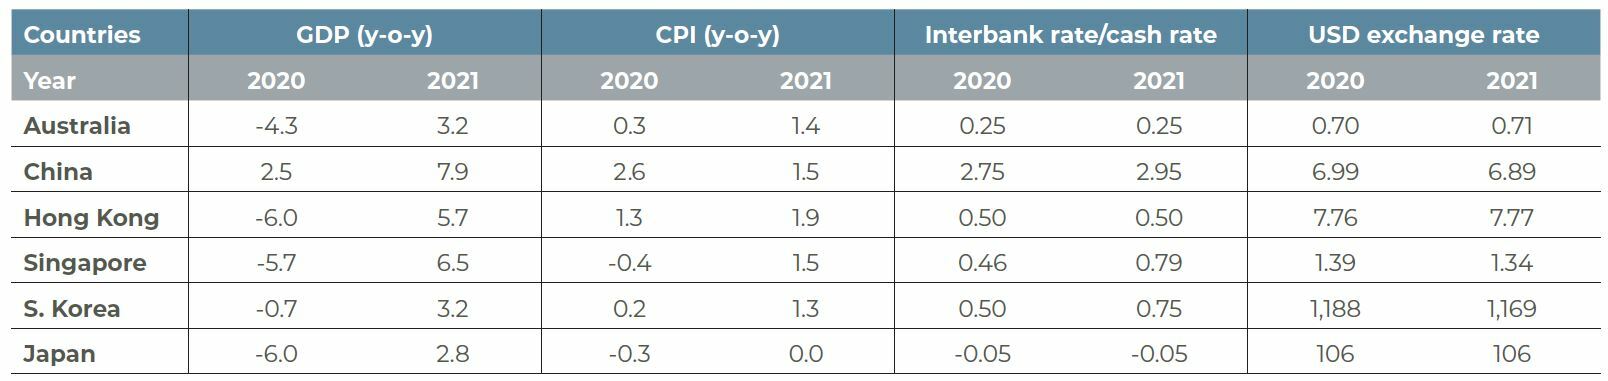
Source: Oxford Economics, 27 July 2020
Tokyo
Multifamily remains defensive, office demand starts to weaken in Q2
MULTIFAMILY: RENTAL GROWTH PAUSES IN Q2
The multifamily sector in Japan is recognized for its income stability and defensive nature. In Q2, with rents at an all-time high, landlords saw a slight pull back as leasing activity was broadly halted between April and May 2020. Occupancy fell slightly during this period but remains high at above 96%. A reassuring statistic during this period was a continued inflow of young residents into Tokyo in search of education or better employment opportunities. Thus, there is reason to believe that there could be the emergence of some pent-up demand by Q3.
Because of its defensive and stable nature, the sector has attracted a lot of capital since the start of the year. Transaction activity in the sector has reached USD4.8 billion in July 2020, up by about 70%, compared to the same period last year.
OFFICE: DEMAND REDUCED, MORE RENT RELIEF IN GRADE B
While office markets were relatively unaffected in Q1, a slowdown in leasing activity became apparent in Q2. Leases signed in the quarter mostly concluded with landlords offering more incentives such as extensions of rent-free periods, which has resulted in a slight reduction of effective rents. Generally, landlords of Grade A minus and B buildings were more flexible in rental negotiations because of their vulnerable occupier base. Meanwhile, rents in Grade A offices were relatively stable in the quarter.
HEALTHY MARKET BALANCE, CONCERNS ON SHADOW SPACE
New supply will peak in 2020 with 10 million square feet being added to stock. This had been previously well pre-committed (>90%) and was not expected to be a major concern. In Q2 however, reports of cancellations of the pre-committed space has incited concerns on potential shadow space. There is also growing uncertainty about the future leasing of office space with several companies (e.g. Hitachi and Fujitsu) announcing reductions in future office space requirements. We expect this trend to be more common with small- to medium-sized, technology-related firms which could result in submarkets like Shibuya and Shiodome seeing vacancies rising faster than the rest of Tokyo.
On balance however, Tokyo’s office market appears well placed to manage the current economic downturn. Vacancy rates are extremely low (>2% in Grade A) and rents about 35% below the previous peak of the 2008 Global Financial Crisis. Further, limited supply in 2021 to 2022 would be helpful in rebalancing markets in the short-term. Effective rents are expected to decline by 5% in 2020, before economic recovery and low supply support a pick-up between 2021 and 2022.
TOKYO MULTIFAMILY OCCUPANCY AND RENTS
2007 TO 2020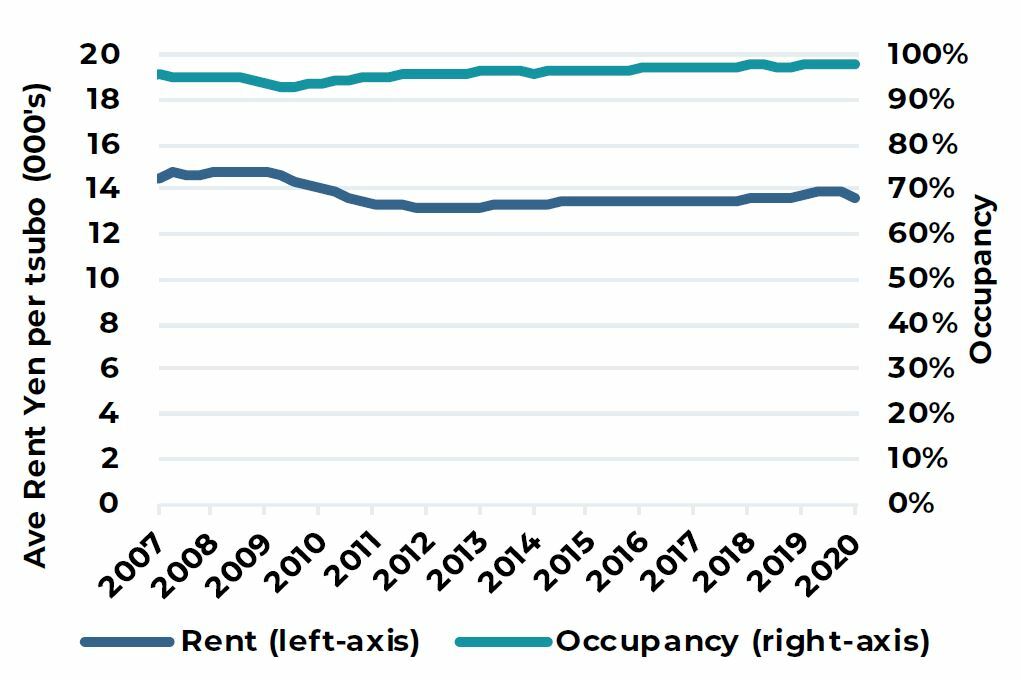
C5W PRIME EFFECTIVE RENTS
2014 TO 2020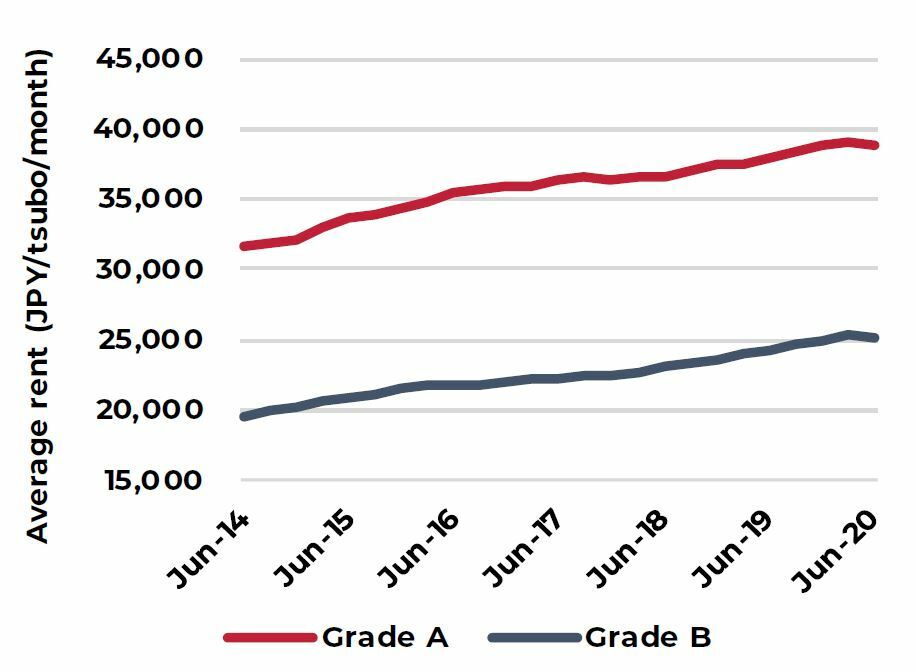
TOKYO OFFICE GRADE A NEW SUPPLY
2019 TO 2023F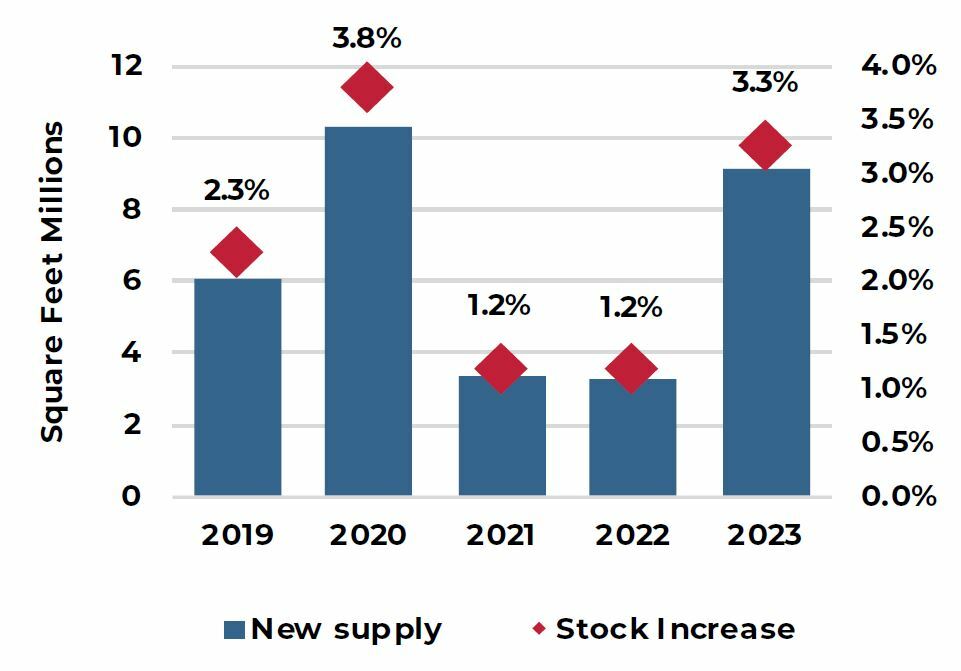
Sources: ARES, CBRE and PMA, as of June 2020
Seoul
Office market sees limited impact due to COVID-19 crisis
LIMITED IMPACT TO-DATE FOR SEOUL OFFICE MARKETS
South Korea managed to contain the spread of the virus without a hard lockdown and as a result, telecommuting for businesses was not enforced at a national level. Leasing activity has continued into Q2; however, with the global economy marred in recession, cautionary sentiment remains high. Leasing volumes in H1 2020 were down 40% compared to the same period last year. To-date, AEW understands that there have been no widespread offerings of rebates or increased incentives by office landlords.
CBD: PRIME ASSETS TO HOLD UP BETTER
Leasing figures for H1 continued to be positive. In fact, the largest lease signed in the quarter was in the CBD for about 70,000 square feet. Due to two major completions within the CBD in the quarter, vacancy rates increased to 15.5%, however landlords remain in a healthy position. Incentive levels have been marginally reduced to 3.7 months, from an average of 4 months in 2019. While things have held up well to-date, there is expectation of some weakness to set in over the coming months as industries hard-hit by the COVID-19 disruption start to cut costs. As these industries are typical tenants of Grade B buildings, we expect prime assets to hold up better in this environment. Current forecasts suggest Grade A rents will be stable in 2020, before the economic recovery in 2021 supports rental growth momentum again.
YEOUIDO: SUPPY-LED RENTAL WEAKNESS TILL 2021
The completion of the ParcOne in H2 will result in a supply-led rental correction in Yeouido. Current pre-commitment levels are minimal (NH securities, the buyer for Tower 2, will be occupying about 35% of the space for its headquarters). It would take several years for the market to rebalance, like when International Finance Center Seoul completed. Rental weakness is expected to remain for the next two years, with effective rents declining by a total of 5% to 6% between 2020 and 2021.
GANGNAM: LANDLORD FAVOURABLE CONDITIONS PERSIST
Limited vacancy and expansion of firms in the Information, Technology and Communication (ITC) industry is expected to continue amidst this period and keep leasing markets in favor of landlords. Brokers on-the-ground have indicated some firms are already enquiring about leasing space in 2021’s supply. Given the still-healthy demand, rents are expected to hold in 2020 for several buildings, with only a handful (those with higher vacancies) experiencing a mild contraction in rents.
OFFICE VACANCY RATE BY SUBMARKET
2013 TO 2022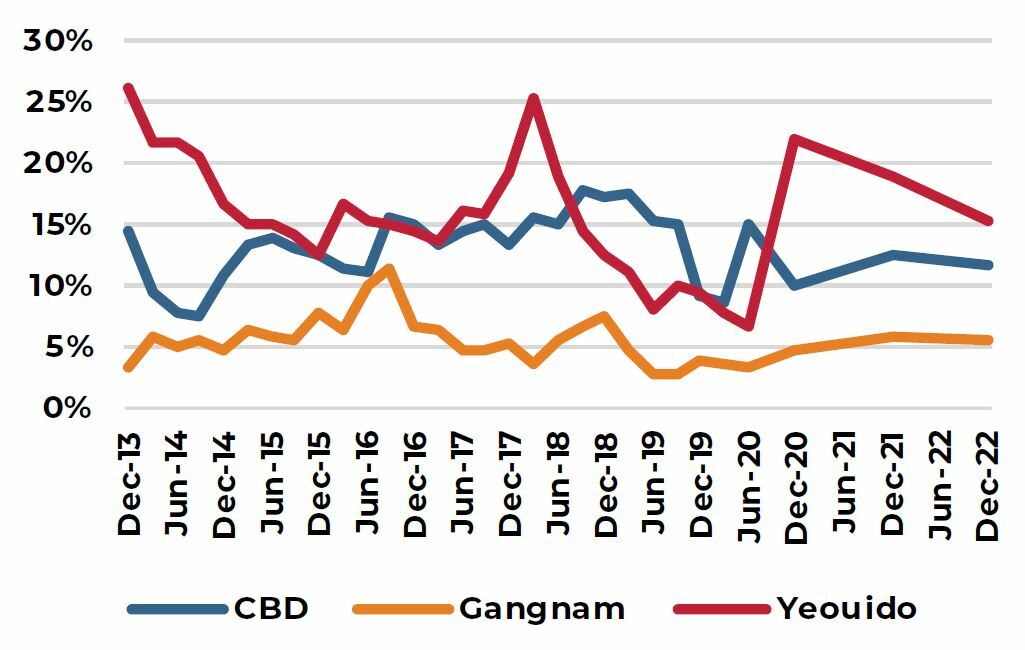
SUPPLY OUTLOOK BY SUBMARKET
2020 TO 2024F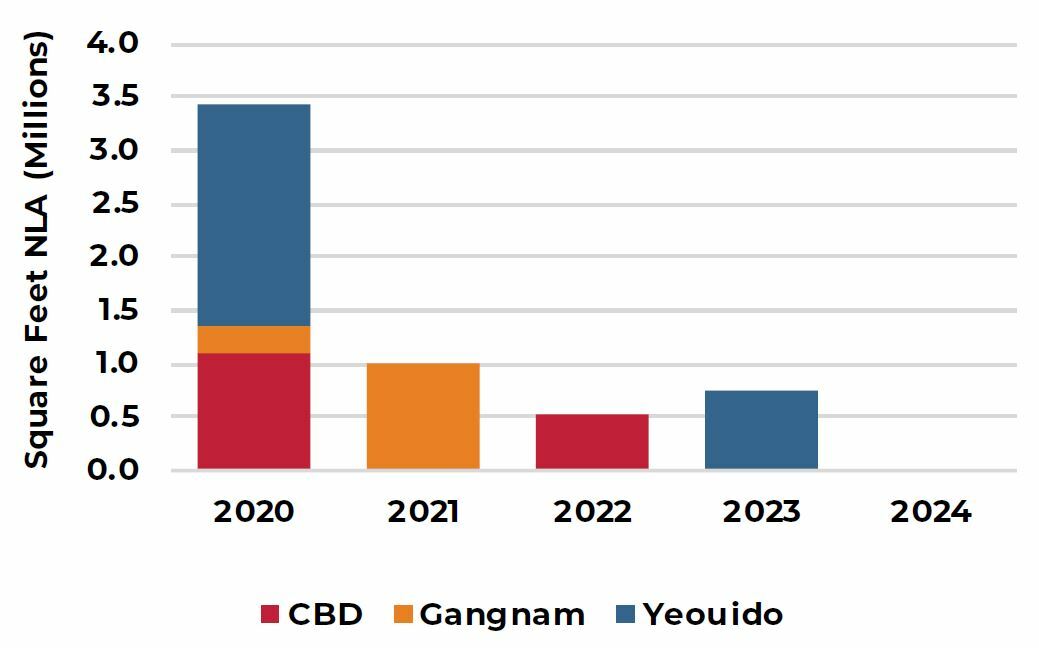
OFFICE RENTAL OUTLOOK
Q4 2019 = 100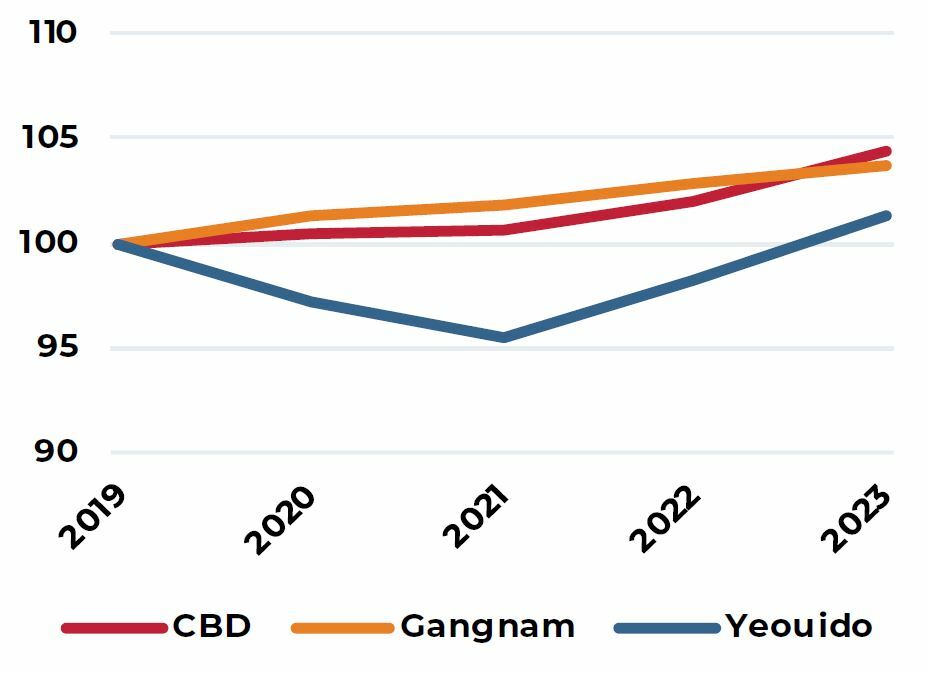
Sources: JLL, as of June 2020
China
Office rental market to remain weak for remainder of 2020, expect earliest recovery in H1 2021
CLOSE TO NORMAL CONDITIONS, LEASING ACTIVITY IMPROVES
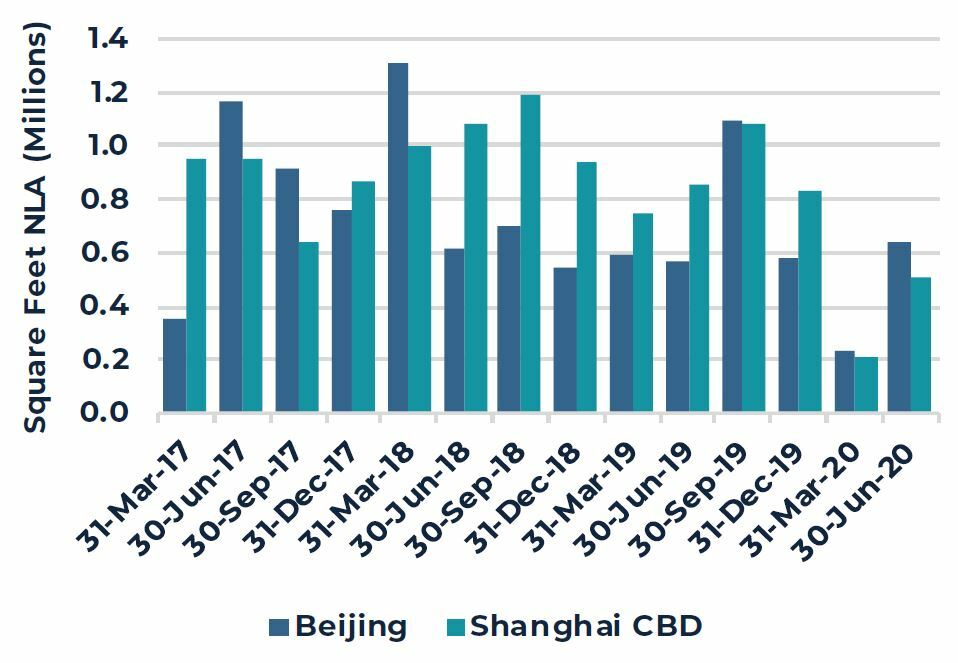
Major cities in China were operating at close to normal conditions for the majority of Q2. Conditions in Shanghai have been slightly ahead of Beijing where about 95% of the workforce is back in the city again. In the quarter, leasing activity improved significantly, up 1.5 times from volumes last quarter and only 20% below Q2 2019 volumes. Landlords have generally been accommodating to requests for rental discounts or rebates as tenants try to manage costs. We expect the leasing market to be incentive-driven for the remainder of the year, especially as new supply in some markets increases the competition between landlords.
SHANGHAI
CBD: COST CUTS ENCOURAGES DECENTRALIZATION
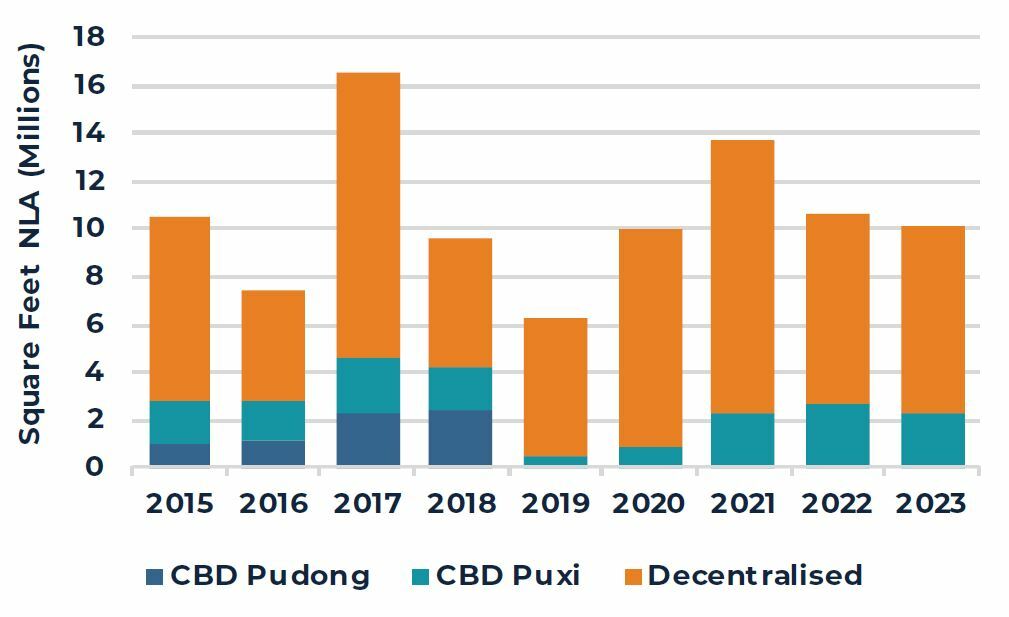
Decentralization trends continued into Q2, as most leasing deals were driven by cost saving measures. Net absorption in the CBD was down 20,600 square feet as more firms relocated to markets outside the CBD offering rental discounts of between 30% to 50%.
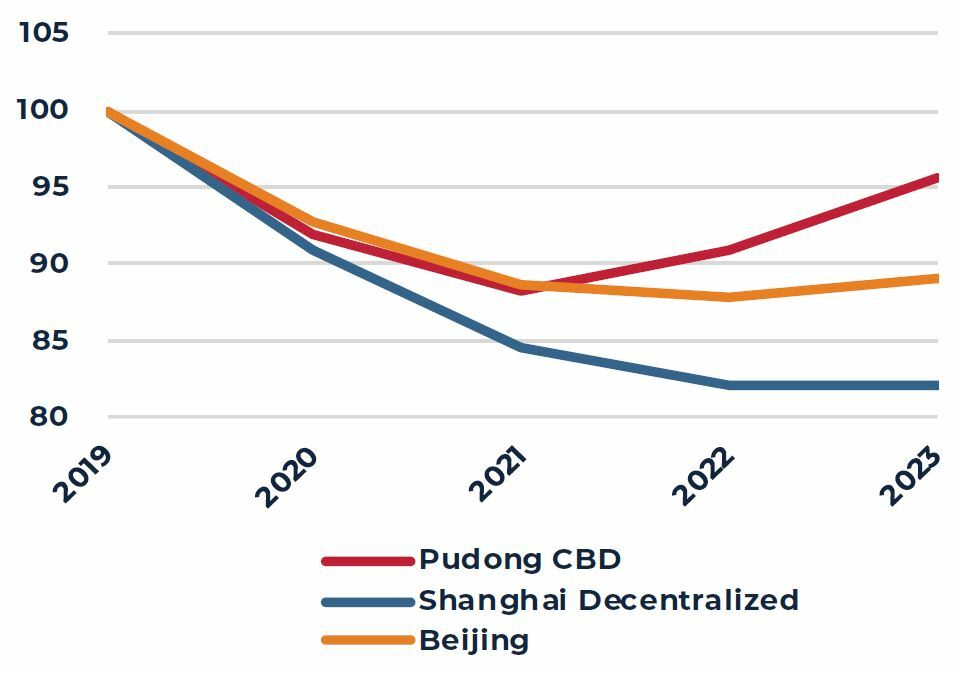
Rents in the CBD declined a further 2.6% in the quarter as landlords pushed discounts or more incentives to maintain occupancy. Nevertheless, there are firms with higher rental affordability such as financial and professional services that are expected to remain resilient. As leasing conditions make a return to normal, we expect rents in the CBD to stabilize earlier due limited new supply in the near-term. Rents in the CBD should bottom in the next 12 months before returning to steady growth.
BEIJING
PIPELINE POSTPONED; MARKET COULD RECOVER BY EARLY 2021
Vacancy rates increased in the quarter due to new supply. As of Q2, they were close to 30% in the emerging submarkets, but remained manageable within the core markets at just 10%.
Compared to a more international market like Shanghai, AEW believes that Beijing’s office market should be less vulnerable in the current crisis. The office market is State-Owned Enterprise (SOE) driven and these companies are expected to be more stable and less prone to job cuts. Further, short-term supply concerns have somewhat subsided as there has been confirmation that about 30% of the projects in the pipeline will be postponed. This will result in a more even spread of supply over the next three years ending 2022. If the containment of the virus remains positive in the next few months, we expect office rents in Beijing to recover as early as H1 2021.
GROSS LEASING VOLUME, SHANGHAI & BEIJING
Q1 2017 TO Q2 2020
SHANGHAI NEW SUPPLY
2015 TO 2023F
OFFICE RENTAL OUTLOOK
Q4 2019=100
Sources: JLL, as of June 2020
Hong Kong
Commercial market downcycle further amplified by COVID-19
FURTHER PULL BACK IN DEMAND DUE TO DOWNSIZING
Up until July, Hong Kong had success in containing the spread of the virus with no lockdown and offices remaining largely open. Still, leasing volumes continue to be depressed, following on from the low levels recorded in 2019. In Q2, cases of firms downsizing increased, resulting in a return of 1.4 million square feet of vacant space. Overall vacancy rates have increased to 7.6%. In Central, vacancy rates are now 5%; while this remains low relative to other Asia Pacific markets, it is the highest level the submarket has recorded since 2009.
RENTAL DECLINES ACCELERATE IN Q2
Landlords remain focused on portfolio occupancy, with rental relief being granted widely. Some landlords are offering “blend and extend” type deals, allowing tenants to extend leases at a lower rate, paying a lower blended rent today as relief. Rents in H1 have declined by an average of 13%, with the largest declines to-date seen in the core markets, Central (-18%) and Tsim Sha Tsui (-10%), while decentralized markets have declined by up to 8%.
Decentralization trends are still ongoing in Hong Kong, but momentum has been challenged as tenants are forced to weigh the option of relocation and capex costs versus a renewal in today’s environment. Nevertheless, the rental gaps between core and decentralized markets have narrowed in recent months.
The expectation is for the leasing market to continue to be weak for the remainder of year, with further contraction of space expected. By end 2020, rents in Central are expected to have declined by up to 30%, while in the decentralized markets, a softer reduction of up to 20%.
RETAIL AND TOURISM CONTINUE TO STRUGGLE
With travel largely curtailed and consumption sentiment at multi-year lows, the retail sector has been hit hard. Tourist-dependent retail such as high street and prime malls are challenged, but community retail in residential neighborhoods have been relatively stable. In Q2, more flagship retail space was returned to the market as worsening sales prompted closure of several luxury and international brands. While there were some leases signed in the quarter, they were mostly signed for a shorter lease periods (typically 12 months) and deeply discounted rents of up to 50%.
Store closures and layoffs are expected to continue through the year, despite major government relief packages. Rents in high street are expected to decline by up to 40% in 2020, bringing rental values back to levels last seen in 2004, while prime retail rents correct by up to 25%.
HONG KONG OFFICE DEMAND
H1 2020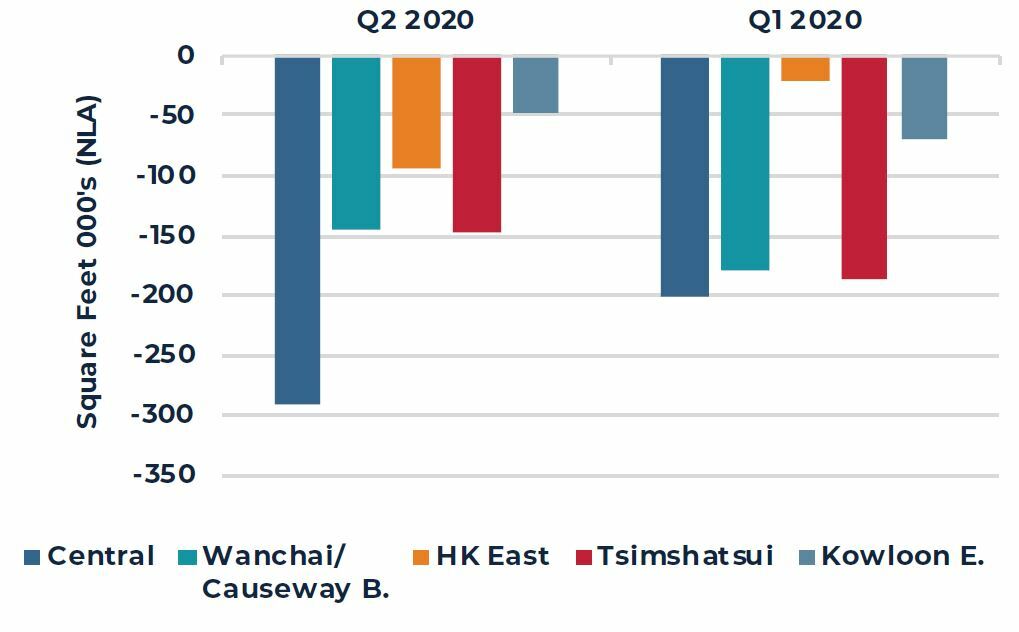
OFFICE VACANCY AND RENTAL CHANGE
Q2 2020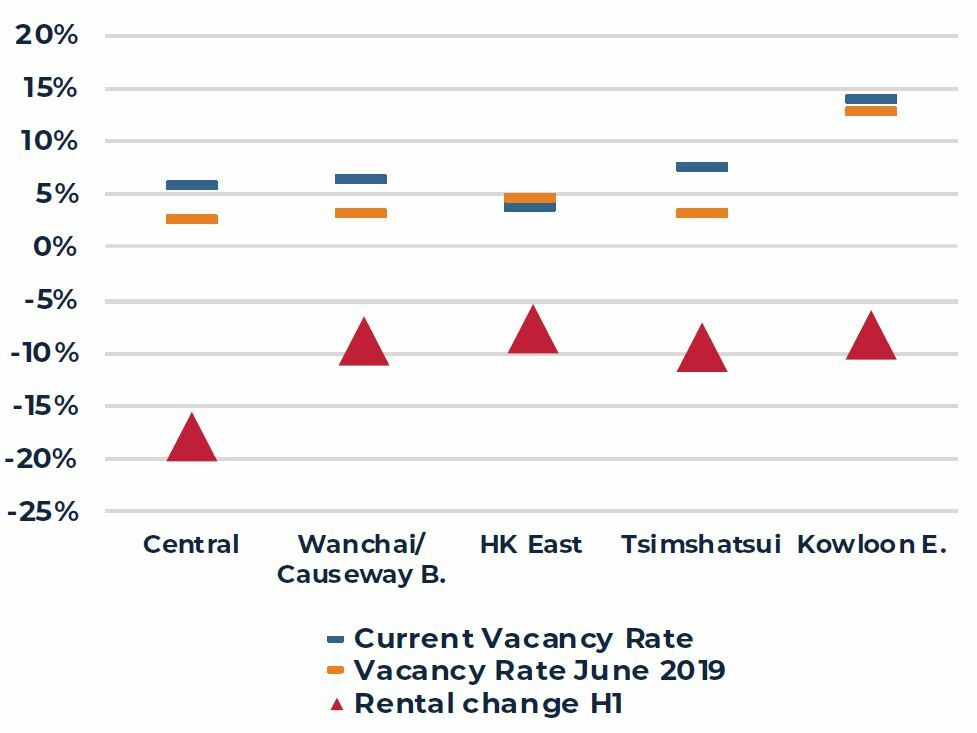
COMMERCIAL RENTAL OUTLOOK
Q4 2019= 100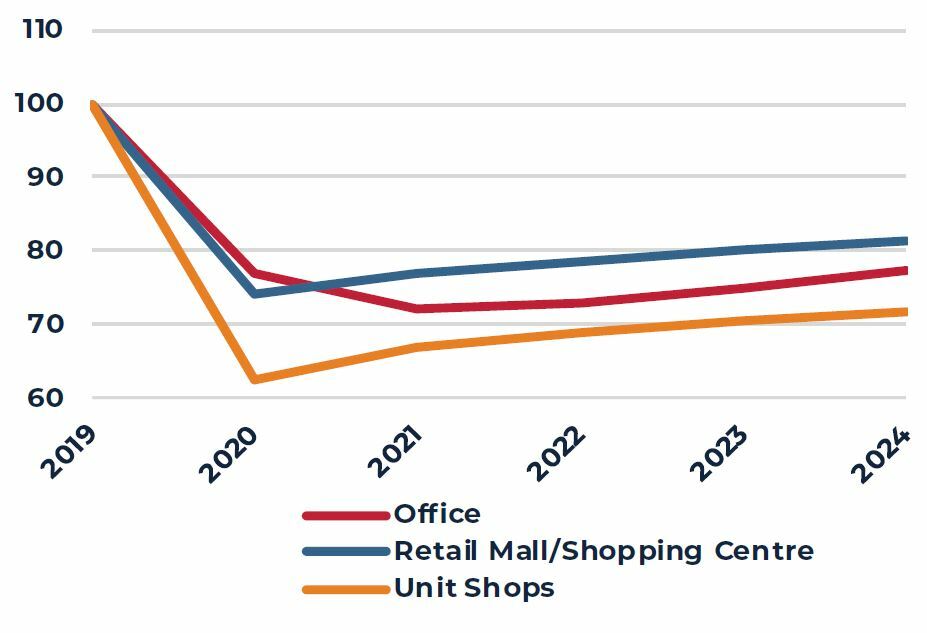
Sources: JLL, as of June 2020
Singapore
Office demand-supply fundamentals shift and slow retail recovery
LEASING ENQUIRIES REMAINED LOW IN Q2
Leasing enquiries were low in the quarter as in-person property viewings were disallowed up to 19 June 20201. Anecdotally, there was a pick-up in activity at the end of June, but concluded leasing deals in Q2 were limited. Businesses are still operating with much caution and are generally postponing decision making until more comfort on the containment of the pandemic is reached. AEW understands that some tenants are at the early stages of planning for changes in workplace strategies, such as a (core-flex) or (core-decentralized), but not definite trend is observable yet.
LEASING MARKETS WEAKEN, RENTAL DECLINE TO ACCELERATE
Leasing weakness mounted in Q2 and landlords became amenable to rental negotiations. Some cost-conscious firms downsized space commitments resulting in an increase in shadow space, adding pressure to overall vacancies and rents. Rents in Q2 fell by 3.2%, after a relatively stable picture in Q1. Due to government-directed support for SMEs, landlords with larger exposure to SME type tenants are seeing larger declines in rents. The expectation is for the rental decline to extend up to 2021, registering a full cyclical correction of between 15% and 20%.
RECOVERY BY LATE 2021 AS DEMAND STABILIZES
Despite the short-term weakness, medium-term fundamentals in Singapore office are still attractive. Due to planned withdrawals, forecasted net increase in stock up to 2024 is 2% p.a., lower than the historical average of 4%, providing support to rental growth. Should demand conditions stabilize by 2021, we expect rents to return to growth, up by 5% to 7% p.a. between 2022 and 2024.
STRUCTURAL WEAKNESS IN RETAIL TO REMAIN PAST COVID-19
Retail shops and dine-in options in restaurants remained closed for the majority of Q2. Despite rental support from the government, the period saw increased vacancies as several business closed ancillary retail stores, or wholly exited the market. On June 19, 2020, malls and restaurants could reopen, but at reduced capacity. Encouragingly, in the first couple weeks of reopening, landlords reported footfall at 80% of pre-COVID levels and healthy sales. However, the sustainability of the spending is questionable as overall consumption sentiment remains week. We expect malls in the city fringe to see larger rental declines of up to 15% versus suburban malls (about 10%) due to spending support from the residential catchment. Post COVID-19, we expect retail rents to stabilize, but it could take years before rents recover to pre-crisis levels.
CBD OFFICE GROSS LEASING VOLUME
Q1 2017 TO Q2 2020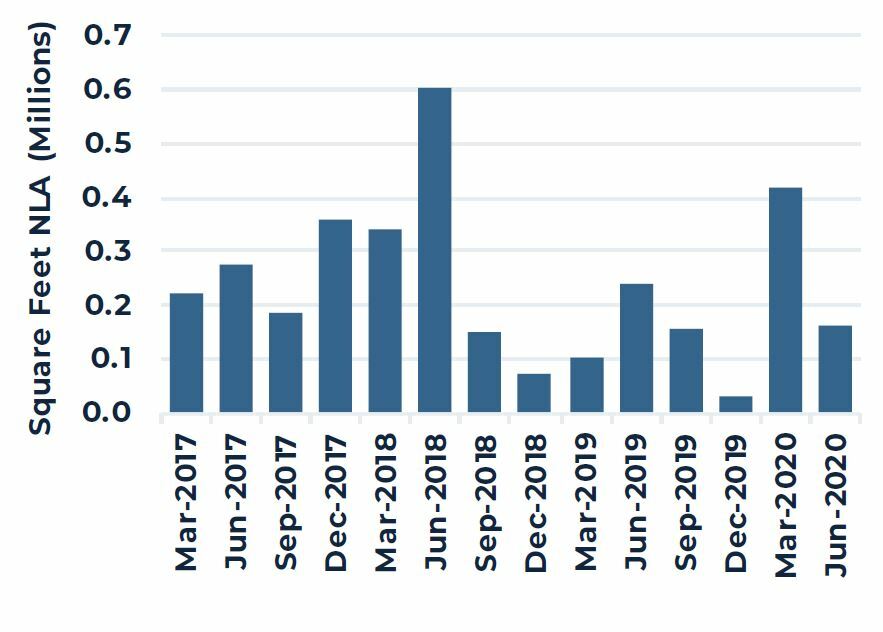
CBD OFFICE NET SUPPLY, DEMAND & RENTS
2017 TO 2023F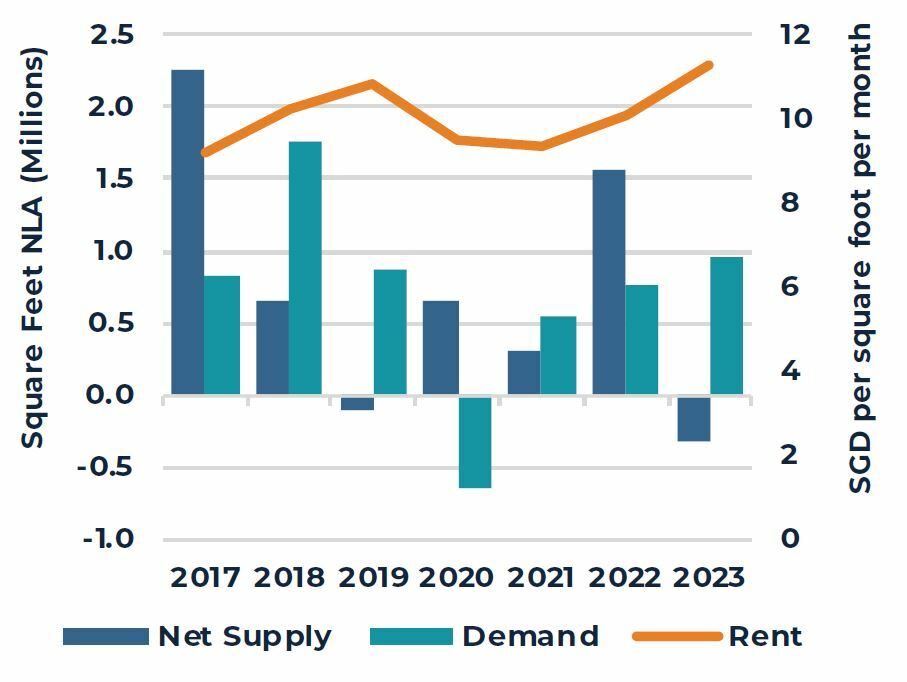
COMMERCIAL RENTAL OUTLOOK
Q4 2019= 100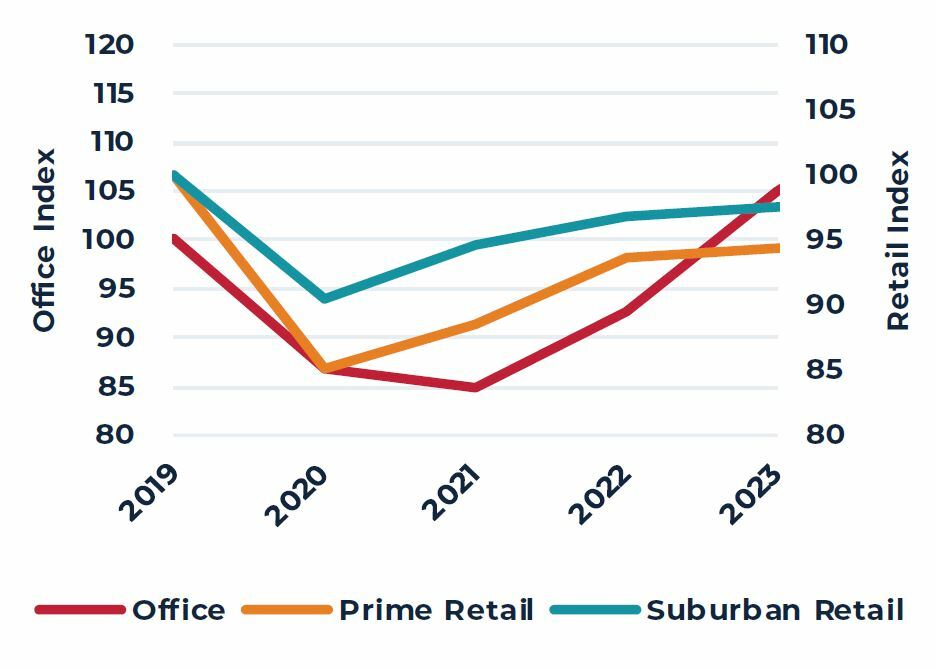
Sources: JLL, as of June 2020
Australia
Office demand to fall significantly in 2020, landlords increase incentives to support occupancy
SLOW RETURN TO WORK
Australia had initial success in reopening its economy, with various states relaxing lockdown measures by mid-May. Although Sydney and Melbourne saw conditions normalizing by early June, a second wave of cases in VIC in mid-June and emergence of virus hotspots in NSW has unwound some progress. Overall, demand contracted across the two major CBDs, as several businesses surrendered space to cut costs. The bulk of leasing activity was through renewals with very limited expansion activity. Landlords are generally giving larger incentives upfront to keep tenants and maintain occupancy. Lingering weakness in business activity and mounting unemployment concerns has resulted in short-term rent forecasts being revised down in both markets.
SYDNEY: INCENTIVES INCREASING FASTER THAN EXPECTED
In the CBD, overall demand contracted by 1.4 million square feet in H1 and vacancy rates rose to 7.7%. Downward rental pressure will be strong in the near-term with an ample supply outlook (6% increase in stock up to 2022) and depressed demand conditions. The short-term outlook in the CBD has turned more negative in Q2 with incentives potentially rising to 30% by the end of 2020, in-line with levels last saw in 2015.
In the Sydney metro markets, we expect the rental contraction to be shorter-lived and more moderate. In fact, some markets like Paramatta and Macquarie Park were bright spots for leasing activity in H1. Incentives in the metro markets are expected to increase in 2020, but a more resilient occupier base and limited supply profile in some areas could provide support to rents beyond 2020. In the longer-term, we believe the metro markets stand to benefit from de-densification of workplace ratios and a take-up of hub and spoke model.
MELBOURNE CBD: RECOVERY TO BE DELAYED
Negative net absorption of 544,000 square feet was recorded year-to-date in Melbourne CBD, led by smaller firms downsizing. Vacancy pressures were also experienced from an increase in new completions. While the completed projects were previously well committed, AEW understands some of these spaces are now being offered for sublease. Year to-date, incentives have increased by 2.5 percentage-points. Brokers on the ground have commented that landlords of Grade B buildings are typically more willing to offer lower rents or incentives to maintain occupancy. Rents were initially expected to recover by 2021, but this is likely to be delayed due to the secondary outbreak, which will impede the reopening of the state and have an adverse effect on business sentiment.
NET RENT & INCENTIVES OUTLOOK
2019 T0 2021F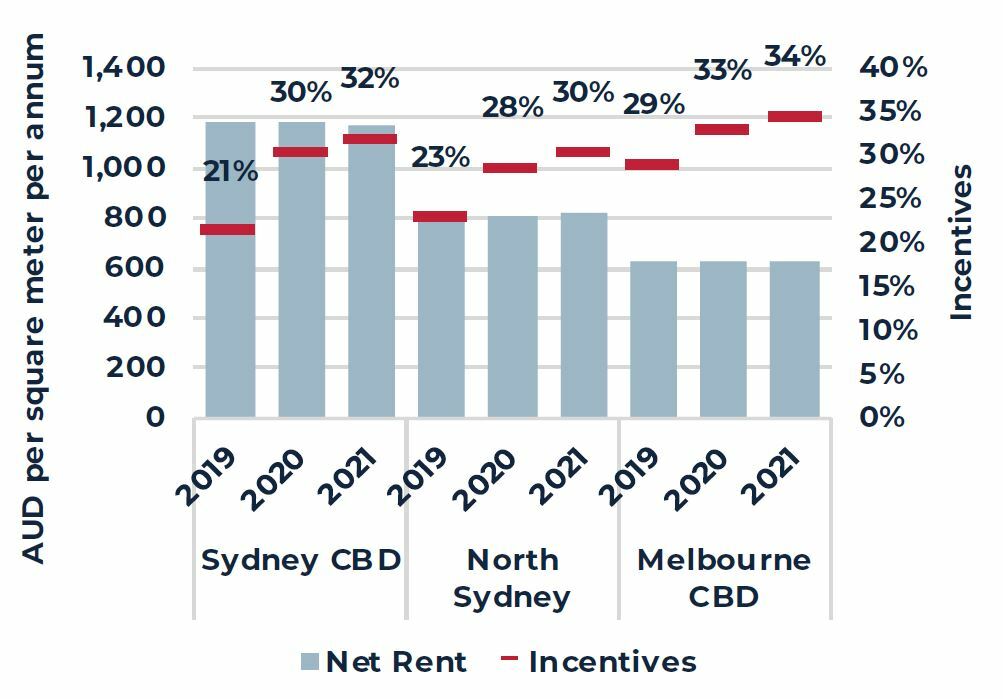
SYDNEY CBD & METRO NET EFFECTIVE RENT
2014 TO 2023F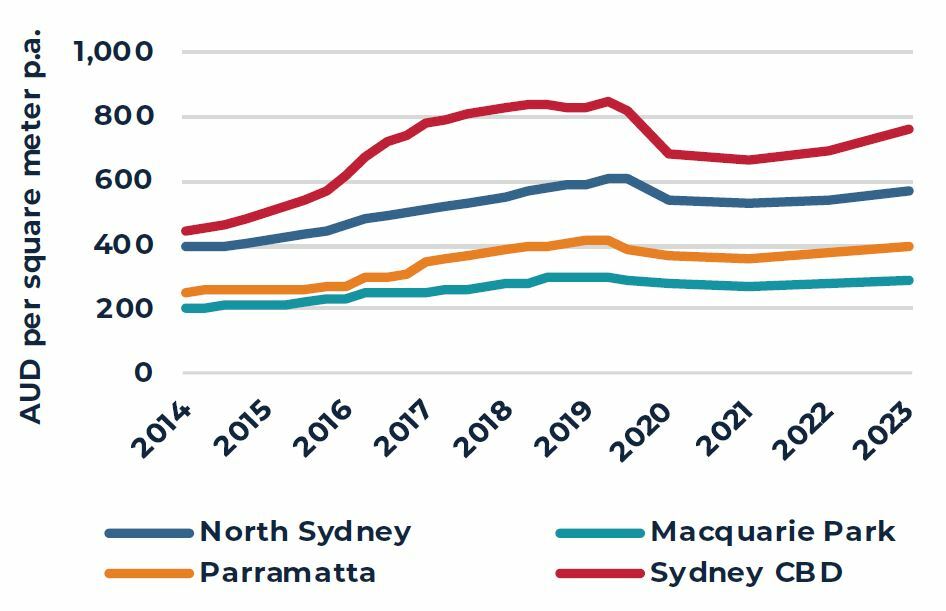
OFFICE RENTAL OUTLOOK
Q4 2019=100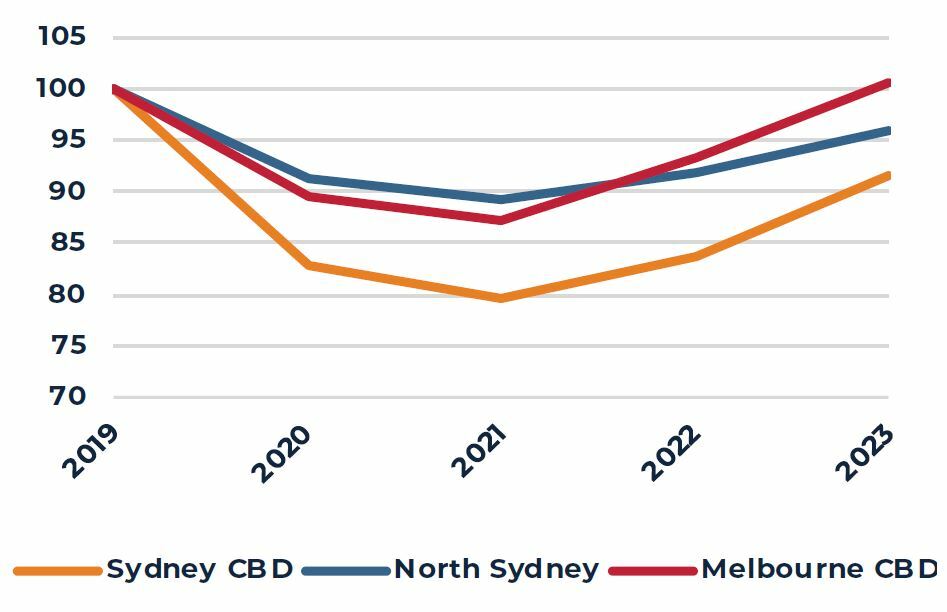
Sources: JLL, and AEW Research as of June 2020
Capital Markets
TRANSACTION MARKETS REMAIN DEFLATED
Transaction volume remained thin in the second quarter of Q2. Year-to-date as of June 30, overall income-producing deal volume in the major gateway cities in Asia Pacific amounted to $40 billion, down 50% compared to the same period last year. Current volumes are in line with levels seen in 2016. Markets that saw larger hits to overall deal activity were Singapore and Hong Kong, down more than 70% year-on-year. On the other hand, markets with good domestic liquidity like Seoul, Tokyo and Osaka performed better.
Investor appetite remains strong, but widespread travel restrictions and safe distancing measures continue to hamper site visits, while uncertainty regarding the rental outlook has complicated or slowed down the deal evaluation process. As of end June 2020, deals still pending, and yet to close, were tracking about $11.4 billion, representing a 10-year high.
DEFENSIVE ASSET CLASSES GETTING GOOD TRACTION
In these uncertain times, asset classes that are deemed more resilient and defensive include multi-family and certain industrial sectors (logistics, data centers and cold storage) and as such, have attracted more capital and seen less steep fall in investment volumes. Some deals in these sectors continue to be bid-up aggressively and have transacted at competitive pricing. For example, Allianz purchased an 11-asset, multi-family portfolio in Tokyo and AXA purchased a residential tower in Nagoya at NOI yields between 3% and 3.5%. In the logistics sectors, large deals included a portfolio of stabilized assets in China by a JP Morgan - New Ease China joint venture, as well as the ALDI distribution centers in Australia by the Allianz and Charter Hall.
PRICING CORRECTION IN SOME MARKETS, NO DISTRESS YET
Outside of retail and hospitality, there has been little sign of distress. Generally, investors are better positioned today than they were during the Global Financial Crisis - leverage levels are moderate and investment in past years was prudent.
In the office market, based on deals concluded in H1, pricing adjustments were observed for only a subset of transactions, but are not widespread. For Hong Kong, discounts of up to 20% have been observed in small strata-type sales sold by private owners, while in Beijing, one asset, ZhongHong Tower was sold at a 30% discount via an online auction. Outside of this, transactions have occurred, mostly by long-term investors, at full pricing. These included several owner-occupier transactions within Shanghai by Haitong Securities and Bank of Shanghai as well as a 50% interest in AXA Tower by Alibaba in Singapore.
CUMULATIVE TRANSACTION ACTIVITY 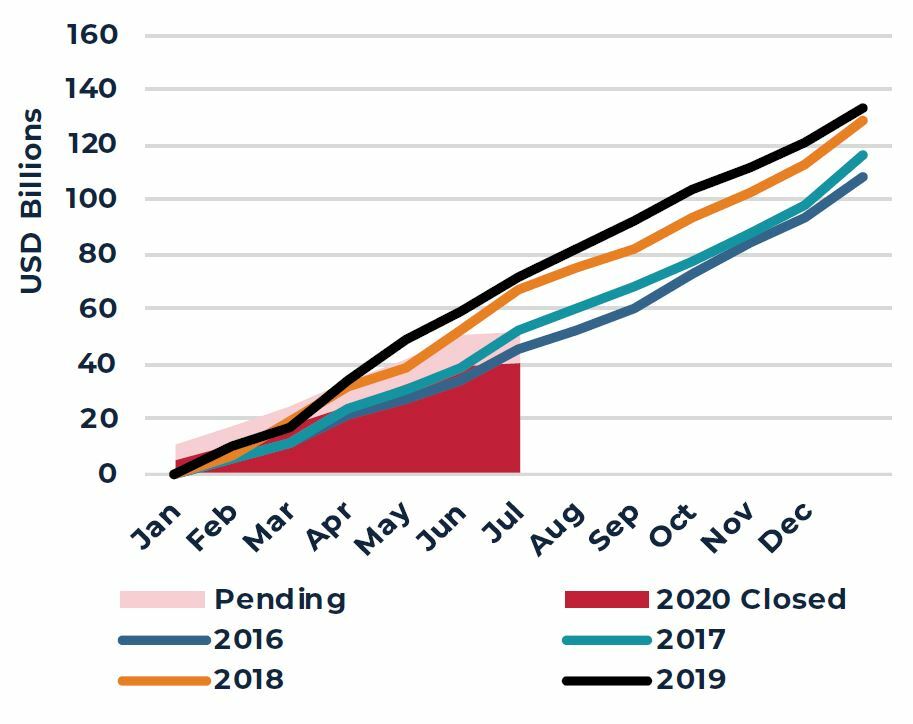
TRANSACTION VOLUME BY SECTOR
H1 2020 VS H1 2019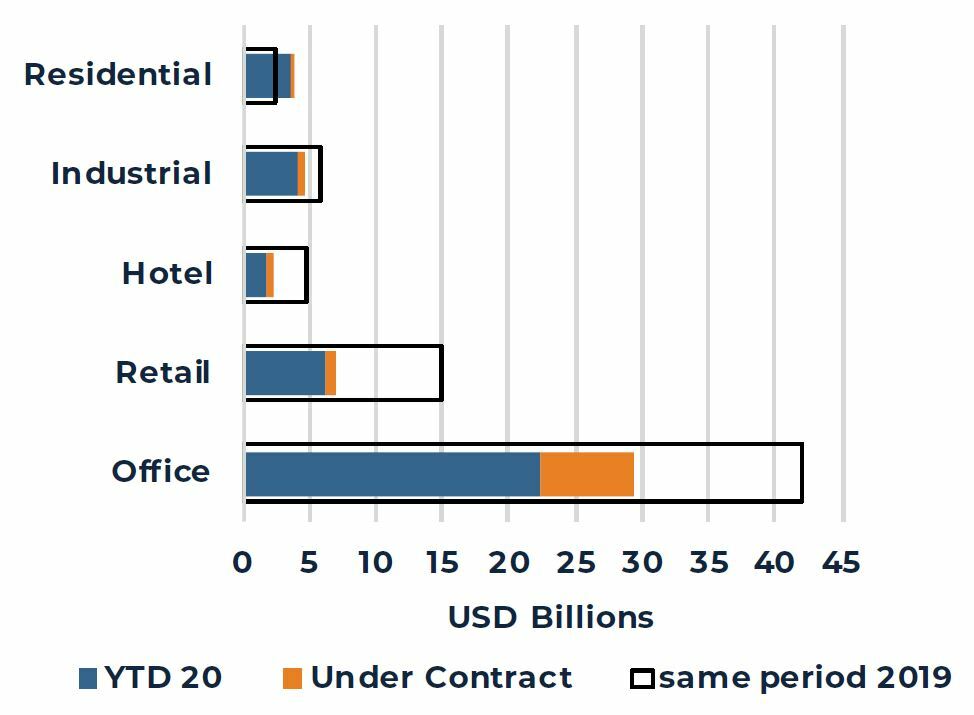
Source: RCA, as of Q2 2020
Note: Transaction volumes in charts above include only income producing assets in the following markets: Beijing, Brisbane, Hong Kong, Melbourne, Osaka, Seoul, Shanghai, Singapore, Sydney and Tokyo
1 Restrictions were eased on 19 June 2020, when Singapore moved into Phase 2 of its re-opening plan
This material is intended for information purposes only and does not constitute investment advice or a recommendation. The information and opinions contained in the material have been compiled or arrived at based upon information obtained from sources believed to be reliable, but we do not guarantee its accuracy, completeness or fairness. Opinions expressed reflect prevailing market conditions and are subject to change. Neither this material, nor any of its contents, may be used for any purpose without the consent and knowledge of AEW.