Investment Strategy
With challenging headline economic conditions prevailing for several quarters, there has been a downward revision in the demand outlook for real estate. Office looks to be best positioned across the traditional real estate sectors, but the forecast for office rental growth has nonetheless been revised down. Despite occupancy conditions that will require more asset management focus, investors are likely to look past any short-term difficulties and continue to bid up opportunities as they come to market. Office transaction volumes year-to-date suggest there continues to be very good liquidity for income-producing assets, and the sector is providing an attractive absolute return as well as a strong spread over debt financing costs and ten-year sovereign bond yields.
Economic growth forecasts are being revised down across the board, due to lower trade volume growth as well as an unfavorable Information Communication and Telecom (ICT) cycle. These external factors are now impacting domestic manufacturing sectors, generating a drag on overall growth. Additionally, low business sentiment is likely delaying some investment decisions, which includes expenditure on property fit-out, a requirement for relocation and or expansion. That said, middle-class households in the region’s leading cities, remain well positioned, with income growth and good balance sheets. To-date labor markets are healthy with low unemployment rates and positive hiring intentions.
Allocations to real estate will stay high, and with bond yields falling this year, the sector’s income return continues to be attractive. The AEW relative value index shows that direct property has become more attractive over the past six months, when compared to the bond and equity markets. The weight of capital searching for investment opportunities is expected to remain high.
The Asia Pacific region’s office markets are well positioned to weather this period of challenging demand-side conditions. Most are operating with vacancy rates well below long-term trend levels, allowing room for a rise in vacant space before any necessary rental adjustment. Net demand levels will likely subside in the short-term with some occupiers preferring to renew leases rather than spend on new fit out. During this period, landlords will focus on retaining tenants and defending occupancy rates.
New office completions are forecast to dip this year, offsetting, at least in part, the demand pull back. Across the major mature cities in Asia Pacific, supply is expected to be about 35% less than 2018. Mid-year rental forecasts have been revised down, with Shanghai and Beijing leading. In this environment, AEW Research believes that only moderate risks should be taken. Buying either selective vacancy or short WALE opportunities is one way to contain risks in an environment of heightened external risks.
The retail sector continues to be steady in most markets. NOI from existing malls should be stable with flat rents and occupancy. There will be opportunities to add value to aging stock in some markets and small- to mid-sized Australian malls are being repriced with higher yields. Cash-on-cash yields from these assets now look compelling.
The regional property markets are entering a slightly weaker set of fundamentals than they enjoyed over the past several years. This period of slower growth is being led by demand-side caution, due in large part to the slower topline economic growth and uncertainty in global conditions. That said, the investment market will be lifted by lower interest rates and banks continue to lend to the sector. Accretive debt will likely offset some of the income growth that has been revised down. AEW believes there continues to be opportunity to outperform by selecting a controlled set of risks at the project level.
Economy
The International Monetary Fund (IMF) projects global growth of 3.2% in 2019 and 3.5% 2020. Both yearly projections represent a downgrade of 0.1 percentage-point from the outlook in April as economic data releases to-date have come in weaker than expected. In Asia Pacific, the economic picture is still sound with average growth of 6.2% in 2019 for emerging and developing economies, outpacing the U.S. (2.6%) and euro area (1.3%). For the major Asia Pacific regional economies, growth is set to come in between 2.0% to 2.5% for the next two years.
While the foundations of healthy performance remain in place (low interest rates and inflation, positive hiring conditions and low unemployment), most regional gateway economies have been weighed down by the escalating tariffs, causing significant disruptions to the trade and technology supply chains. More recently, Japan’s restrictions on semiconductor-related exports to South Korea have further added to the tensions in the region. July 2019 marks one year since tariffs were first raised on Chinese goods by the U.S. To date, a 25% tariff has been placed on $250 billion of Chinese goods, with another 10% to be imposed on $300 billion of Chinese imports by the end of the year. Negotiations between the two countries have been volatile and the situation remains unpredictable.
Trade figures year-to-date have been impacted. In China, both exports and imports were down 1.3% and 7.3% respectively year-on-year in June 2019. At the same time, markets like Hong Kong, Japan, Singapore and South Korea posted negative export growth in June. While these figures are magnified from last year’s high base, the directional change reflects the slowdown in external demand and the cyclical downturn in the ICT sector. Further, the Purchasing Managers Index (PMI) fell below the expansionary 50 reading across the board in June, implying a difficult near-term outlook in the manufacturing and related-service sectors.
Domestic markets across the region remain relatively healthy although consumption sentiment has dampened in recent months. Policies rolled out earlier in 2019 such as increased infrastructure spend, support for private business and employment, are expected to become more visible in H2 2019. Meanwhile, central banks across most economies have turned to monetary easing to support economic growth. Since the last edition of this report, the benchmark rates in both Australia and South Korea have been cut (now at 1.0% and 1.5% respectively), while in Singapore the Monetary Authority of Singapore (MAS) is likely to move toward an easing stance by the next meeting in Oct 2019. The Bank of Japan (BoJ) has left rates unchanged, but they remain extremely low at negative 0.1%. In China, the People’s Bank of China (PBOC) is expected to issue more reserve requirement ratio (RRR) cuts in H2, but this will be measured as the government keeps an eye on macro-leverage. The widespread cuts in interest rates have resulted in the downward shift of the bond yield from the start of the year and the subsequent widening of the property yield spread across markets.
Most currencies in the Asia Pacific region have depreciated against the USD dollar in 2019. The KRW and the AUD are down 9.4% and 4.1% from the start of the year while the CNY passed the 7.0 mark for the first time since 2008, bringing the year-to-date depreciation to 2.5%. The SGD on the other hand has been relatively stable with a smaller 1.6% depreciation year-to-date. The JPY is the only currency that has appreciated against the dollar, up 3.4% year-to-date.
MACROECONOMIC INDICATORS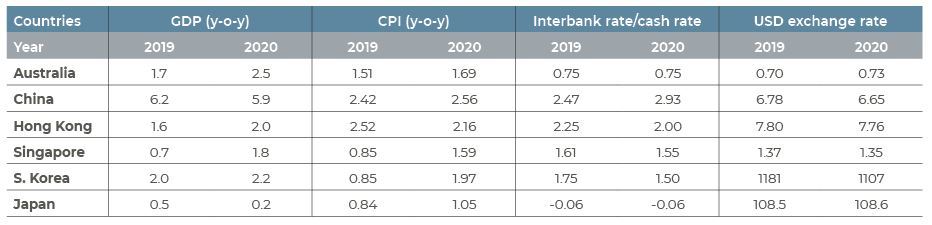
Source: Oxford Economics, 30 July 2019
Tokyo
Favorable fundamentals for multifamily, growing caution in office leasing
MULTI-FAMILY IS DEFENSIVE, RENTS IN C5W TO OUTPERFORM
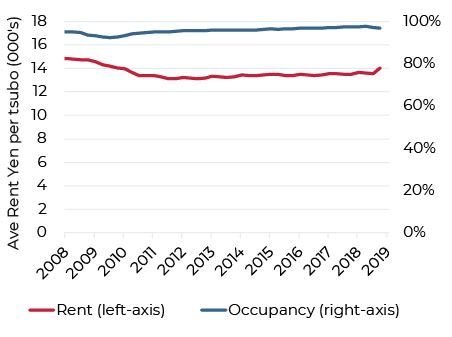
Global economic uncertainty has weighed on Japan’s economy, but the multifamily rental sector remains defensive, due to strong fundamentals. Urban population growth in the Tokyo metropolitan region is strong and sustained by steady inter-city migration and immigration. As young, working adults drive urban migration flows, smaller, centrally located apartments are more popular and generally command a rental premium. With moderate supply and vacancy rates tight, the residential market has seen uninterrupted rental growth for the past year. In Q2 2019, average asking rents in the Central 5 Wards (C5W) and 23 Wards (23W) were up 7.3% and 6.5% year-on-year respectively. Average rents in C5W are about 19% higher than 23W, and this premium could rise as demand for centrally located apartments grows over time.
PRICE GROWTH TO CONTINUE, DEMAND IN RESALE GROWS
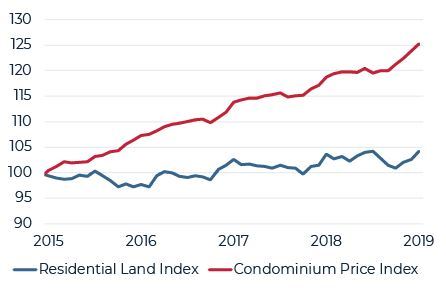
Residential price growth in recent years has been supported by low interest rates and moderate supply. At the same time developers for new-builds are incurring higher land and construction costs, which has filtered through to stronger pricing. Despite a slowdown in take-up rates, developers are typically cash rich and have little motivation to reduce prices.
Average prices in 23W have increased by 3.4% year-on-year and affordability is being strained in some cases with estimates of the price-to-income ratio above 13x. AEW understands that demand in the resale market (priced at a 35% discount to new sales) is becoming more popular and could grow in the near-term.
LOW VACANCY ENVIRONMENT IN THE SHORT-TERM
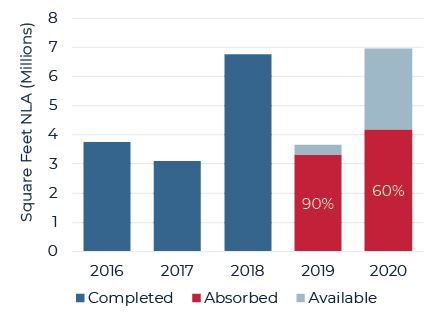
Low vacancy rates (less than 1% since 2018) in Tokyo Grade A office have supported rental growth, but the uncertain business environment and large supply poses challenges ahead. New construction in the office market will reach 10.6 million square feet in the next two-year (2019 to 2020) period. Pre-leasing to-date has been active with 90% and 60% of 2019 and 2020’s construction already pre-committed in advance. However, the bulk of these leases were signed by tenants relocating from existing buildings. There is concern on the quantity of the backfill space and take-up will be largely dependent on the health of the economy and business expansion conditions. Rental growth is expected to continue, up 1% to 2% in 2019, but is likely to reverse in 2020 when the bulk of new supply hits.
MULTIFAMILY OCCUPANCY AND RENTS 2008 – 2019
RESIDENTIAL PRICE INDEX - Q1 2015 = 100
TOKYO OFFICE GRADE A SUPPLY - 2016 – 2020F
Sources: ARES, Land Institute of Japan, CBRE, as of
June 2019
Seoul
Diverging trends between office submarkets to persist
CBD: RENTAL GROWTH RESTRAINED IN THE NEAR-TERM
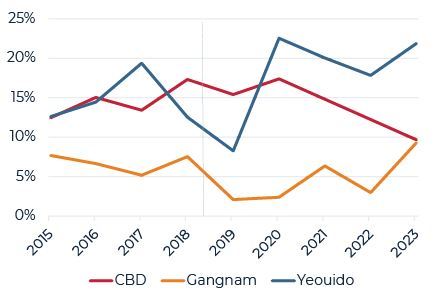
In Q2 2019, take-up was a positive 292,000 square feet due to the expansion and relocation of some local conglomerates. Vacancy levels remain high at 15.5%, above the long-term average of 13.0%. Leasing in new-build Grade A has been slow, adding significantly to the district’s overall vacancy. By end-June, the Grade A market saw tenants’ rent-free period reach a peak of 4.4 months while effective rents were down 2.9% since the start of the year.
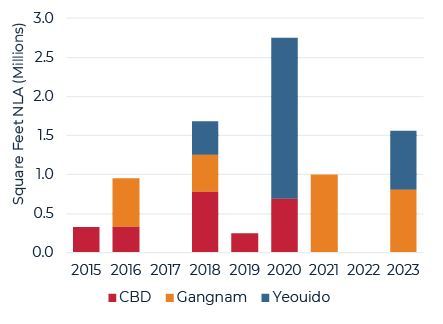
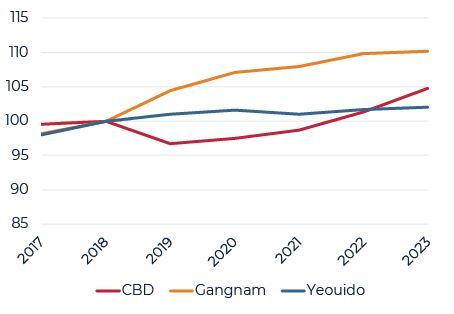
The cautionary business sentiment is expected to be reflected in demand going forward. While pipeline Grade A supply is limited, new Grade B projects to be delivered over the 2020 to 2021 period will also increase leasing competition. Rents are expected to hold flat or decrease marginally in the near-term.
YBD: LEASING EXPECTED TO SLOW, LARGE SUPPLY LOOMS
In Yeouido Business District (YBD), demand has been held up mostly by finance-related firms expanding or upgrading to International Finance Center (IFC) and FKI Tower. Vacancy rates have declined consistently since March 2018 and have reached a new low of 8.2%, a level last seen only in 2012. Demand however is expected to slow going forward as upgrader and relocation activity from financial-related firms are at the tail-end. Furthermore, IFC is nearly full, with availability only on the upper floors, limiting the options for potential tenants. The pending completion of ParcOne (2.1 million square feet) in 2020 is also putting pressure on the rental market. Rental growth has been revised down since last quarter to 0.5% to 1.0% per annum for the next two-year (2019 to 2020) period.
GBD: LANDLORD FAVORABLE CONDITIONS PERSIST
Landlord favorable conditions continue to exist in the Gangnam Business District (GBD). Limited vacancy and strong occupier demand from tenants in the ITC industry have pushed vacancy rates down faster than expected to 2.8%. While latent demand remains strong, the lack of available options will limit the take-up of space going-forward. Brokers on the ground have indicated that some firms are already enquiring about leasing space in 2021’s supply – the revamped Renaissance Hotel Development Site by KKR. Given the robust demand, rental growth is expected to continue in the near-term, up by 6% to 7% over the next two-year period.
OFFICE VACANCY RATE BY SUBMARKET - 2015-2023F
GRADE A SUPPLY OUTLOOK BY SUBMARKET - 2014-2023F
OFFICE RENTAL OUTLOOK - Q4 2018 = 100
Sources: JLL, as of June 2019
China
Short-term demand weakness in Shanghai and Beijing
SHANGHAI
PUDONG CBD: SHORT-TERM WEAKNESS, FAVOURABLE OUTLOOK
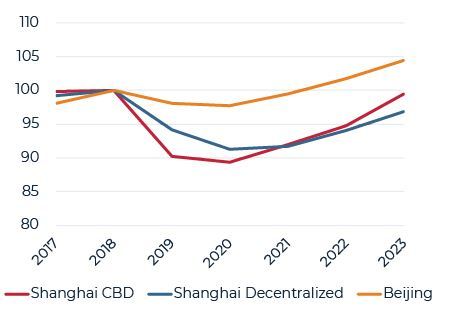
Pudong CBD has no new supply expected in the next five-year period ending 2023. However, current occupational demand has been challenged by several factors including the U.S./China trade tensions, the government’s deleveraging campaign and the growing stock available in the decentralized markets, such as Qiantan. These competing locations offer high-spec office space at deep rental discounts to central Lujiazui rents. AEW understands that vacancies in Pudong’s CBD are mainly concentrated in the new-builds, and for large spaces exceeding 50,000 square feet, landlords have already started to lower rents.
PUXI CBD: DIVERSE DEMAND SUPPORTS LEASING
Demand in Puxi CBD is varied across sectors and industries, unlike Pudong, which has the bulk of the tenant-base from the finance industry. Moderate demand year-to-date has resulted in vacancy rates declining to 9.1% as of end-June 2019. Overall rents in Puxi have been flat in the first half of 2019, with rental weakness observed in peripheral CBD markets versus the core CBD areas. The peripheral CBD markets like Hongkou and Xuhui are high-supply areas and are also more vulnerable to the leasing competition from decentralized markets. Going forward, we expect more divergence in performance between submarkets in Puxi, with core CBD markets outperforming due to limited supply.
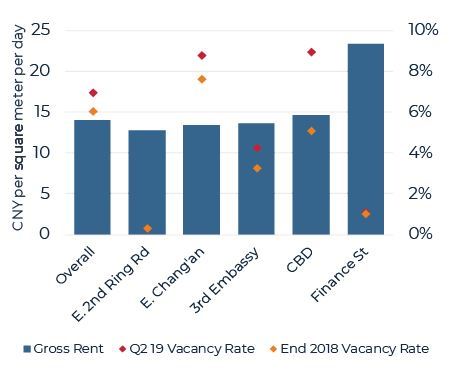
BEIJING
DOMESTIC-ORIENTATED SUBMARKETS SHOW STABILITY
Landlord favorable conditions persist in Beijing’s low vacancy, Grade A office market. The occupier profile is heavily weighted towards domestic firms (65% of total stock) which are still expanding. In contrast, there have been cases of foreign firms surrendering space, in submarkets like East Chang An and Third Embassy. In the CBD submarket, vacancy rates rose as new projects completed in Q2 2019. Meanwhile Finance Street and East 2nd Ring Road which are dominated by State-Owned enterprises (SOE’s) are expected to be less affected by the global uncertainty. More so, AEW understands that the government will be providing rental subsidies of up to 50% for tenants in fintech and finance industries, which could help support leasing activity in H2.
PUDONG CBD SUPPLY & VACANCY - 2016-2023F
BEIJING OFFICE VACANCY & RENT - Q2 2019
OFFICE RENTAL OUTLOOK - Q4 2018=100
Sources: JLL, as of June 2019
Hong Kong
External factors impact the commercial markets
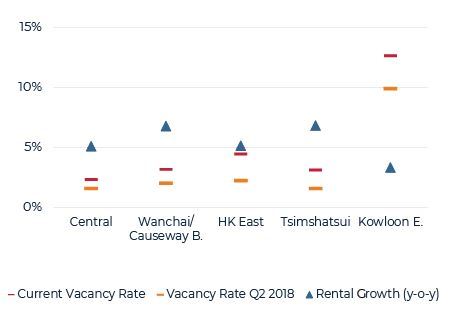
LEASING SLOWDOWN IN CORE MARKETS, VACANCY REMAINS LOW
Impacted by the on-going U.S./China trade disputes, leasing from mainland Chinese firms tapered significantly in H1 2019 while co-working operators exhibited mixed plans. In Central and Wanchai/Causeway Bay, demand was negative for two consecutive quarters and vacancies were up 1% from a year ago. Some landlords responded to this shift by lowering rents or providing more incentives to retain tenants. This is from a very landlord-favorable base with extremely low vacancy rates and average rental growth of 5% to 7% in the past year.
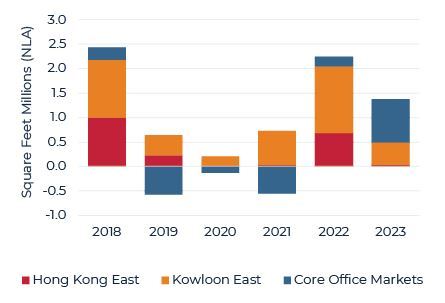
DECENTRALIZATION TRENDS PERSIST
Decentralization trends persist as cost management remains a priority. The bulk of take-up in the first half of 2019 was due to tenants moving into the recently completed projects in Hong Kong East and Kowloon East where about 886,000 square feet of Grade A office space completed in H1 2019. These include banking & finance, legal and insurance firms. This trend is expected to continue in the second half of the year.
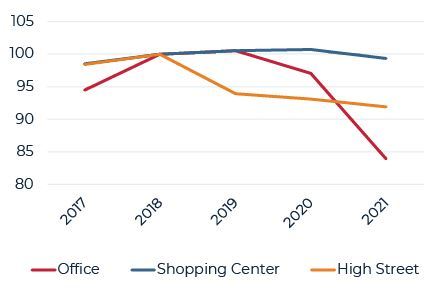
RENTAL ADJUSTMENT IN CORE, DECENTRALIZED MARKETS HOLD
Rental pressures from a leasing slowdown and decentralization was evident in Q2 and reflected in the downward revision in rental growth for 2019, especially in core submarkets. Meanwhile, rents in decentralized markets of Hong Kong East and Kowloon East are expected to hold or increase marginally due to sustained demand in the midst of moderate supply. As a result, the rental gap between the core and decentralized markets could narrow slightly in the near-term.
EXTERNAL FACTORS IMPACT RETAIL MARKETS IN Q2
On a seasonally-adjusted basis, retail sales volume fell about 3.1% in H1 2019 versus the same period last year. The local consumer is healthy, but the changing spending patterns of mainland tourists, which account for a substantial share of Hong Kong retail sales, brought down the headline figures. Second half 2019 retail sales numbers are expected to be pulled down further as mainland tourism flows will continue to be affected by the political tension between Hong Kong and China.
Instead, shopping centers or malls supporting local communities in densely populated residential districts are expected to be resilient during this time. Shopping mall rents are expected to grow marginally by 1% to 2% in the next one-and-a-half-year period ending 2020.
VACANCY RATE & RENTAL GROWTH - Q2 2019
OFFICE DEMAND OUTLOOK BY SUBMARKET - 2018-2023F
COMMERCIAL RENTAL OUTLOOK - Q4 2018= 100
Sources: JLL, as of June 2019
Singapore
Office rental growth continues, limited retail supply beyond 2019
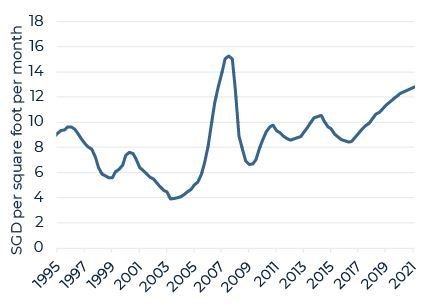
CBD OFFICE RENTAL GROWTH CONTINUES
Landlord-favorable conditions persist, as vacancies declined 2.1 percentage-points from the start of the year to 5.1% in Q2. In the quarter, lease renewal rates were high due to limited available space options. The market has entered the ninth quarter of its upward rental cycle, bringing growth from the last trough to 28%. Assuming a standard three-year lease tenure, AEW Research estimates that on average, leases are being signed at 20% to 25% premium to expiry.
CAUTIOUS LEASING IN Q2, LIMITED OPTIONS SUPPORT TAKE-UP
While leasing enquires from companies within the financial, technology and business services sectors remained healthy, firms are proceeding with caution, with many taking extended periods to review their space options and requirements. In Q2, there were also several large firms that surrendered a portion of their space back to landlords. Many of these are good quality and well-located office buildings. Historically this type of space is usually leased prior to physical vacancy, but in the current climate it may dampen near-term optimism.
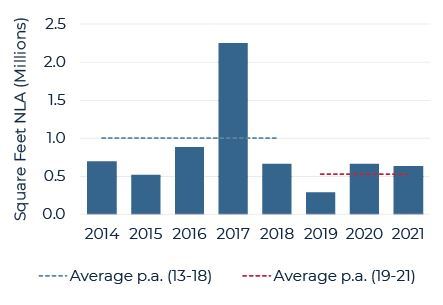
FAVOURABLE RENTAL OUTLOOK
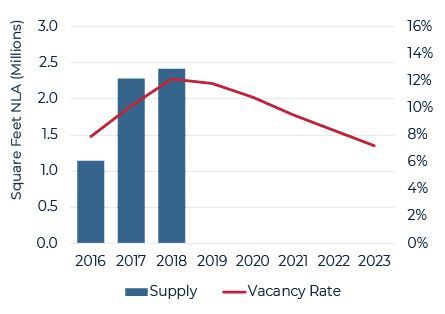
Supply in the office sector is expected to remain tight with no new completions expected in the remainder of the year. The limited supply going forward, and prospect of stock withdrawals due to the CBD incentive scheme, should keep vacancies limited in the near- term. Rental growth is expected to grow by up to 12% year-on-year in 2019, before slowing in 2020 to 8% to 9%. However, this outlook may be revised lower should the economic slowdown persist.
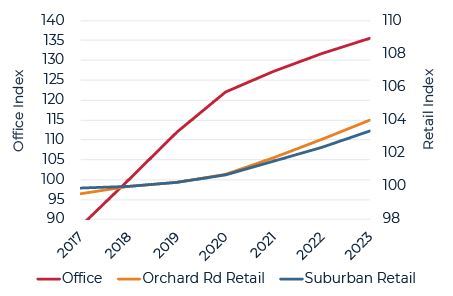
RETAIL RENTAL GROWTH CHALLENGED
After a mild recovery in the past four quarters, the retail sector showed weakness again in Q2, reflecting the slowdown in the domestic and external sectors. Leasing enquiries in the quarter were limited. There was also increased incidences of tenant turnover in malls, especially linked to the food and beverage industry.
Newly completed malls, Funan and Jewel@Changi have included new-to-market brands and concepts, adding vibrancy to the overall landscape. However, the changing tenant profile to include large-form, activity-based retailers that are usually more rent-sensitive has generally kept the rental recovery mild. With the exception of Paya Lebar Quarter Mall (to be opened in H2 2019) no major new supply expected in the near-term should allow rents to remain stable or grow marginally.
CBD OFFICE GROSS RENTS - 1995-2021F
CBD OFFICE SUPPLY - 2014-2021F
COMMERCIAL RENTAL OUTLOOK - Q4 2018= 100
Sources: JLL, as of June 2019
Australia
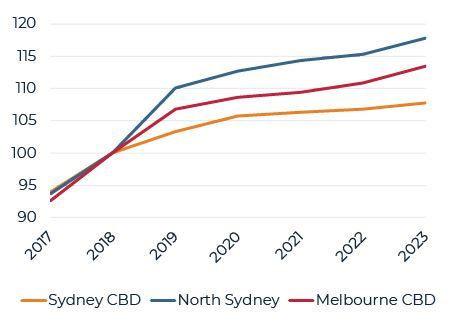
Rental growth in North Sydney to outpace Sydney and Melbourne CBDs
SYDNEY
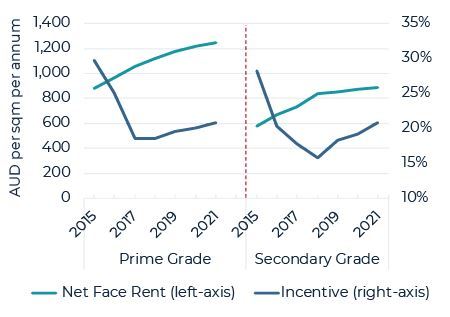
CBD RENTAL GROWTH CONTINUES AT A SLOWER RATE
In Q2, tenant demand weakened in the CBD with overall net absorption coming in at negative 230,000 square feet. The CBD, however, is well positioned to manage the weaker take-up with a low vacancy rate (4.1% as of Q2 2019) and healthy pre-commitments (45% pre-com rate in upcoming supply up to 2020). Additionally, Sydney’s CBD stock is currently at its lowest point since 2016 due to stock withdrawals.
Landlords continued to increase face rents in Q2, accompanied by a marginal increase in incentives, resulting in slower effective rental growth. Markets should remain landlord favorable in 2019, but rental growth is expected to slow over the next 12-months in tandem with the delivery of new supply.
TECH FIRMS SHOW INTEREST IN SYDNEY METRO MARKETS
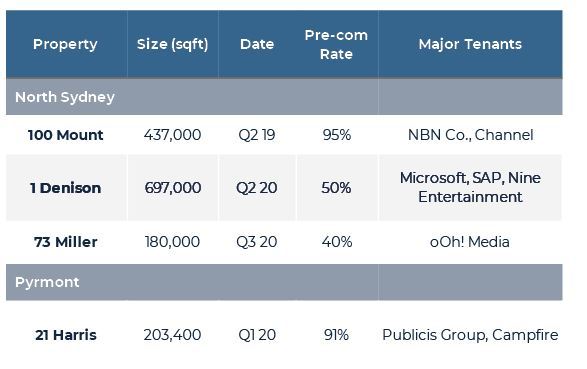
Larger firms, typically in the technology sector are increasingly looking to the metro markets outside the CBD to manage costs and meet their space requirements. North Sydney and Pyrmont, in particular, have been beneficiaries of this, where rents have increased by 5% to 10% in the past 12 months.
Because existing space is limited in these markets, pre-leasing in upcoming developments has been active, with large firms like Microsoft and Publicis committing to projects in North Sydney and Pyrmont respectively. In Q2, 100 Mount had achieved a 95% pre-lease rate upon completion. With strong demand and low vacancy rates to continue, effective rents in North Sydney are expected to grow by up to 10% year-on-year in 2019, outpacing the CBD.
MELBOURNE
FAVOURABLE OUTLOOK IN MELBOURNE CBD
Melbourne CBD is currently going through its supply cycle, but high pre-commitment rates and recent existing stock withdrawals in Q2 are keeping vacancy rates low. The CBD’s vacancy rate was 3.8% in Q2, the lowest across all Australian capital city CBDs. Pre-leasing in upcoming projects is the focal point for tenants, and as of end June, about 83% of supply under construction was pre-committed.
While the volume of the upcoming backfill could increase leasing competition in the near-to medium-term, more stock withdrawals are anticipated in the coming months (especially in assets where anchor tenants have moved into upcoming developments), which will keep vacancy rates low. Effective rental growth is expected to continue, up 6% to 8% in 2019 and a further 1.5% to 2.5% in 2020.
SYDNEY CBD FACE RENT AND INCENTIVES - 2015 – 2021F
NEW SUPPLY: NORTH SYDNEY & PYRMONT
Features major upcoming projects
OFFICE RENTAL OUTLOOK - Q4 2018=100
Sources: JLL, as of June 2019, local media reports, Suntec REIT Investor Update
Capital Markets
TRANSACTION MARKETS REMAIN ACTIVE
Although the U.S./China trade conflict and global economic uncertainty has increased cautionary sentiment, the low cost of debt across the major Asia Pacific gateway markets has kept investment appetite robust in 2019. The average yield spread has risen about 60 basis points from a year ago to 307 basis points across the major Asian gateway markets making private property increasingly attractive.
On a rolling 12-month basis as of end June, transaction volumes across major Asia Pacific gateway markets (excluding pending deals) were down about 9%, but this is from a high base one year ago. Markets that have seen a substantial increase in activity over this period include Singapore, Seoul, Beijing and Osaka while in contrast, Hong Kong and Tokyo have seen a retreat in activity. For Hong Kong in particular, investment appetite has weakened mostly in the office sector, where the occupier outlook is challenging.
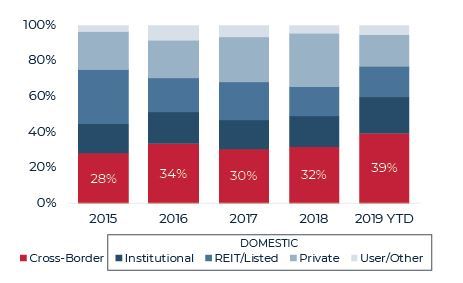
CROSS-BORDER CAPITAL REMAINS ACTIVE
Across the major Asia Pacific markets, cross border capital remains active, responsible for close to 40% of transactions year-to-date. This proportion varies across the individual markets with the highest share in Singapore due to strong fundamentals and the conclusion of several large deals.
Of note, in Beijing and Shanghai, cross-border share of office investments increased substantially in H1 2019, up to 64% from the 51% share in 2018. AEW understands that domestic investors in mainland China have become less active which has reduced competition for foreigners and allowed them to increase their exposure. However, with leasing risk becoming a growing concern in China, we could see a slowdown in capital flows in H2 2019.
CONTINUED ACTIVITY INTO SECOND HALF 2019
Investment appetite elsewhere is expected to continue in H2 2019, given the weight of capital looking to be placed and the attractive yield still available in the sector.
Recently reported commercial deals (but not factored into H1 2019 transaction volumes) include: the sale of Telstra Centre in Melbourne CBD; 71 Robinson and DUO in Singapore; Northpoint Tower in North Sydney; and NH Investment and Securities Building in Seoul. Buyers of these deals include both a mix of domestic and foreign capital. Beyond this there are also several other large deals across markets that are at advanced negotiation stages and expected to close in the coming months.
CUMULATIVE TRANSACTION ACTIVITY - 2016-YTD 2019
![]()
BUYER BREAKDOWN - 2015-YTD 2019
MAJOR TRANSACTIONS YTD 2019
![]()
Announced in July 2019
Sources: RCA
Note: Transaction volumes in charts above include only income producing assets in the following markets: Beijing, Brisbane, Hong Kong, Melbourne, Osaka, Seoul, Shanghai, Singapore, Sydney and Tokyo
The information and opinions presented in this research piece have been prepared internally and/or obtained from sources which AEW believes to be reliable; however, AEW does not guarantee the accuracy, adequacy, or completeness of such information.