Investment Strategy
In an investment world with trillions of dollars of bonds at zero (or less) yield, interest rate curves shifting down and a high level of geopolitical uncertainty, real estate continues to attract capital. Rising allocations to the asset class are driven by its comparatively high income return, solid fundamentals and an expectation of capital value escalation. To some the sector is seen as defensive and offers diversification in a mixed asset portfolio. That said, in an environment with lower headline economic growth, near-term underwriting assumptions for new investments, especially on rental growth, are being challenged.
Generally, AEW continues to prefer the office sector across the Asia Pacific region. In leading gateway cities, the sector is well positioned for a period of lower than normal occupier demand, with vacancy rates typically well below long-term averages. Rental growth expectations are being revised down, reflecting the more subdued economic environment businesses find themselves operating in. Current forecasts do not anticipate a significant contraction of demand, so longer lease up of new completions will be the main contributor to any vacancy rate increases.
Investors looking to deploy capital on a low risk, long-hold basis may find opportunities in suburban markets, especially in Australia, where rents are at a discount to the CBD and yields higher. In other locations, office assets with a high amount of vacancy can be considered riskier than they were 12-months ago. Markets like Hong Kong are anticipating a rental correction, possibly presenting an entry opportunity in the medium-term.
In addition to the office sector, some Australian retail assets are being repriced. If this trend continues, at some point in the future, these assets will trade at yields that are highly compelling for international, income-seeking investors.
AEW continues to believe investors will remain active in the Asia Pacific region, albeit with some shifts in allocation away from pockets of uncertainty. Prices and valuations should continue to be supported at current levels in most instances, despite a leasing and rental slowdown.
WEIGHTED AVERAGE TARGET ALLOCATION TO REAL ESTATE
2013 TO 2020F
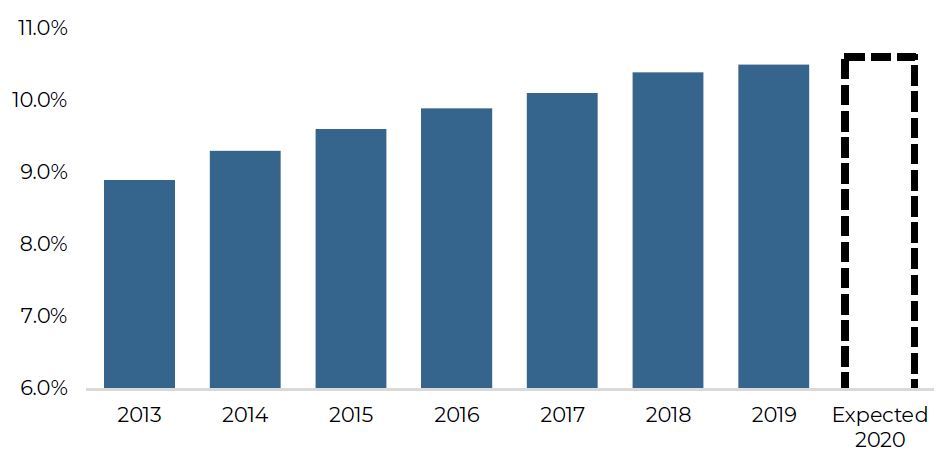
Source: Hodes Weill & Associates
Note: Represents the target allocations of instutitional investors
Economy
International Monetary Fund (IMF)’s global growth forecast in October 2019 reflects a downward revision from their July 2019 update – down 0.2 percentage-points to 3% in 2019, and another 0.1 percentage-point in 2020 to 3.4%. The growth downgrades were consistent across regions as rising trade barriers and geopolitics continue to challenge growth.
The preliminary proposed trade-deal between China and the United States (U.S.) announced on October 11, 2019 is a promising development, but at present, there is a lack of assurance on a full deal being reached. To-date, tariffs have been placed on $550 billion of Chinese goods and on $185 billion on U.S. goods, negatively affecting trade volumes and business sentiment globally. IMF estimates that trade-tensions will cumulatively reduce global growth by 0.8% by 2020. Looking ahead, the U.S. and euro area are expected to expand by 2.1% and 1.2% respectively in 2020, while Asia Pacific will print 4.2% growth in 2020.
For the major Asia Pacific economies (Australia, China, Hong Kong, Japan, Singapore and South Korea), external momentum continued to slow into the third quarter of the year. Import-export growth was either minimal or negative in Q3 and soft indicators such as the Purchasing Managers’ Index (PMI) and business confidence indicate further weakness to come. However, some markets noted bright spots; in China, industrial value-added, fixed asset investment and retail sales picked up in the quarter while in Japan, real exports (after adjusting for prices) increased in Q3 after previous months of contraction. These indicators, although positive, are being read with caution as much uncertainty still exists, and risks are skewed to the downside.
Outside of the U.S.-China trade tensions, the continued social unrest in Hong Kong and the trade related dispute between Japan and South Korea are further weighing on growth. Hong Kong has seen severe contractions in tourism and retail sales year-to-date in 2019, both of which are large contributors to the city’s output. The city now stands at risk of a recession in 2019, with already two quarters of negative growth in Q2 and Q3. Meanwhile in South Korea and Japan, the strained relations has begun to affect businesses across multiple industries such electronics, tourism and luxury consumer goods.
While there has been some flow through weakness from the external sector to domestic manufacturing, the services sector is holding up well. Employment growth is up in some markets and private consumption growth generally positive. This has been aided by highly supportive fiscal and monetary policy. Most governments have announced forward-looking budgets with increased expenditure on infrastructure as well as support schemes for private businesses and households. At the same time, interest rates have been further cut in Australia and Korea while in Singapore, the Monetary Authority of Singapore (MAS) took its first step in October 2019 to loosen monetary policy. One exception to this is the People’s Bank of China (PBOC), which is avoiding an overly loose monetary policy as it may push up already high debt levels in the country.
Asia (ex-Japan) currency weakness against the USD continued into Q3 but has begun to improve in the early weeks of October, recovering some losses made earlier in the 2019. Year-to-date the KRW is down the most (6.3%), followed by the CNY (3.1%), AUD (3.0%) and SGD (0.2%). The JPY on the other hand has been one of the most stable currencies in 2019; year-to-date, it is up 1.0% against the USD.
MACROECONOMIC INDICATORS
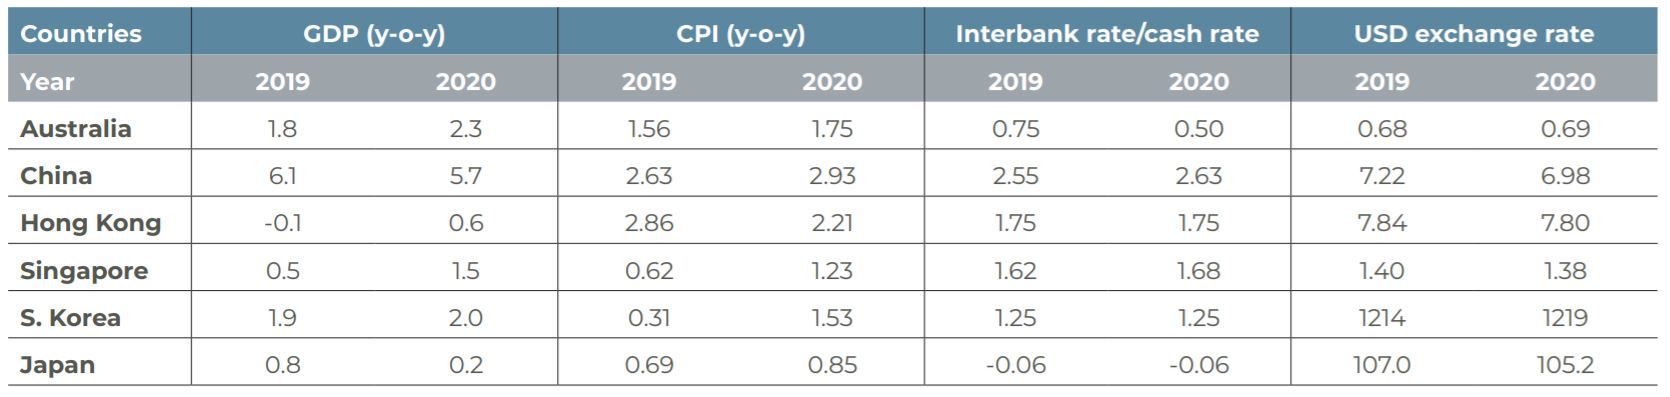
Source: Oxford Economics, 22 October 2019
Tokyo
Favorable fundamentals for multifamily, growing caution in office leasing
MULTI-FAMILY IS DEFENSIVE, TIGHT LEASING MARKET
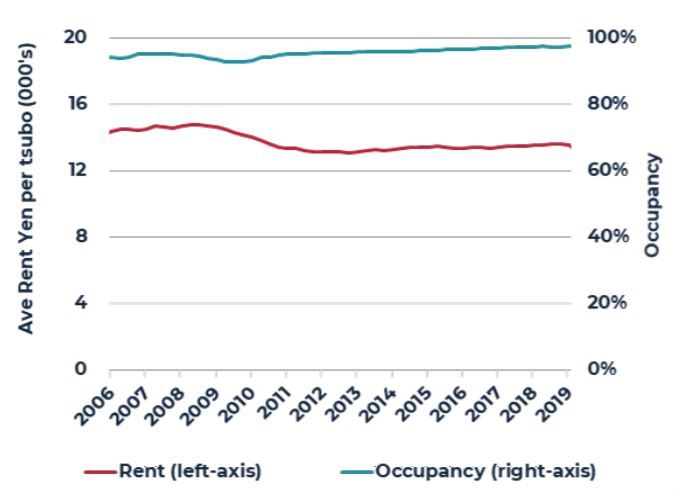
Global economic uncertainty has weighed on Japan’s economy, but the multifamily rental sector remains defensive, due to supportive fundamentals. Urban population growth in the Tokyo metropolitan region has been sustained by steady intra-city migration and immigration, especially by the younger demographic for work and study purposes. As of Q3 2019, average asking rents in the Central 5 Wards (C5W) and 23 Wards (23W) were up 4.9% and 6.9% year-on-year respectively. For the 23W, this was the fastest rate of year-on-year increase since 2007, reflecting the current tight leasing market.
SUSTAINED OFFICE DEMAND, VACANY REMAINS LOW
Office demand year-to date has held up well, but there are nascent signs of leasing weakness. Comments from brokers on the ground indicate more caution by existing occupiers in expanding and leasing new space. In addition, more expensive office space in less popular areas like Marunouchi/Otemachi are having issues filling vacancies.
Although still extremely low, all-grade vacancy rates in the C5W increased in the quarter to 0.6%. Occupancy remains most tight in Grade B, where the current vacancy rate is 0.4% whereas Grade A is only slightly higher at 0.7%.
5-YEAR SUPPLY MANAGEABLE, GRADE B RENTS MORE STABLE
Tokyo’s supply cycle is accelerating with close to 10 million square feet completing in the next two-year period ending September 2021. To-date, about 80% of new supply in 2020 is already pre-leased. The bulk of these commitments are relocation demand from existing Grade A or Grade A minus buildings.
Estimates suggest that the annual new supply increase for the next three years is 4% p.a., higher than the past 10-year historical average. However, the volume of new supply is manageable as demolitions will reduce net supply increase to around 2% p.a. Going forward, vacancy rates are expected to rise in tandem with new supply, and landlords are anticipated to reduce asking rents as leasing competition increases. Grade A rents should be subject to more weakness going forward given the volume of new supply, while Grade B rents are expected to be more stable.
MULTIFAMILY OCCUPANCY AND RENTS
2006 – 2019
C5W OFFICE GRADE A & B VACANCY RATES
2010 TO 2019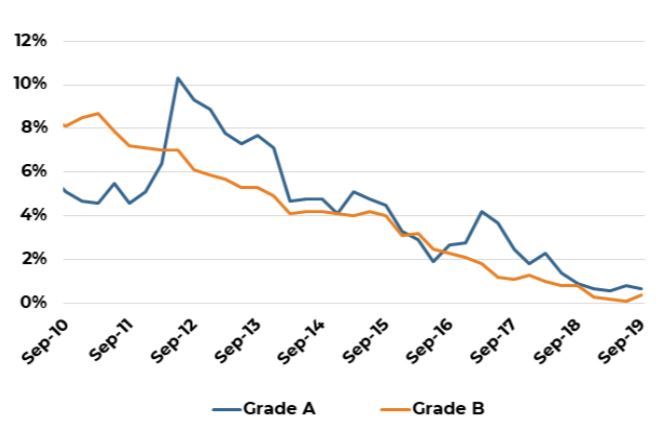
TOKYO OFFICE GRADE A NET SUPPLY
2016 TO SEP-2021F
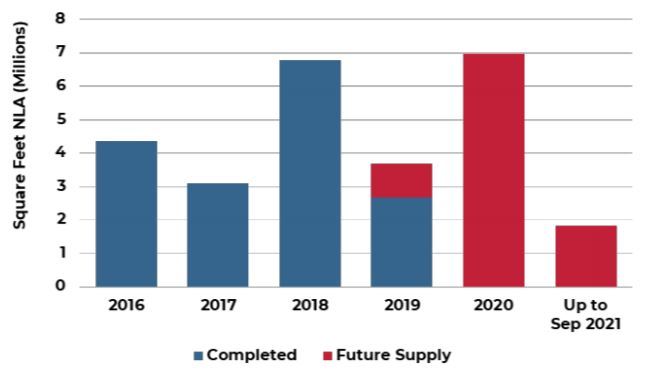
Sources: ARES and CBRE, as of September 2019
Seoul
Diverging trends between office submarkets persists
CBD: RENTAL WEAKNESS, TRANSACTION MARKET STILL ACTIVE
Increasing incentives and aggressive marketing by landlords has resulted in another quarter of positive take-up, bringing net absorption year-to-date to 532,000 square feet. AEW understands that leasing is particularly active in buildings with large vacancies (i.e. those in excess of 20%), where the estimated rent free being offered is between four to five months, a new high in the submarket. As a result, effective rental weakness persists and are down close to 4.0% since the start of 2019.
Despite the leasing challenges in the CBD, the transaction market continues to be active, with interest from domestic players. In Q3, 12 large deals (above $100 million in value) were completed amounting to a total of $3.9 billion. The weight of capital continues to place upward pressure on pricing and as a result, cap rates compressed 10 bps to 4.3% in the quarter.
YBD: LEASING SLOWS, LARGE SUPPLY IN 2020
In Yeouido Business District (YBD), leasing momentum slowed in Q3 as demand from the finance and insurance industries was limited. At the same time, two major anchor tenants relocated to self-use premises outside the three-core submarkets. As a result, demand turned negative and vacancy rates increased by two percentage points to 10.1% in Q3.
The pending completion of ParcOne (2.1 million square feet) in 2020 is also putting pressure on the leasing market of which to-date there are no known pre-commitments. Rental growth has been revised down since the start of the year and rents are likely to fall by up to 4.5% over the next two-year (2020 to 2021) period.
GBD: LANDLORD FAVORABLE CONDITIONS PERSIST
Landlord favorable conditions persists in Gangnam Business District (GBD). Limited vacancy and strong pent up demand from the Information, Technology and Communication (ITC) industry kept vacancies limited since the start the year. As of Q3 2019, vacancy rates were 2.9%, 1.7 percentage-points lower than the 10-year historical average of 4.6%. While latent demand remains strong, the lack of available options will limit the take-up of space going-forward. Brokers on the ground have indicated that some firms are already enquiring about leasing space in 2021’s supply – the revamped Renaissance Hotel Development Site by KKR. Given the robust demand, rental growth is expected to continue in the near-term, up by 3% to 5% over the next two-year period.
OFFICE VACANCY RATE BY SUBMARKET
2015 TO 2023F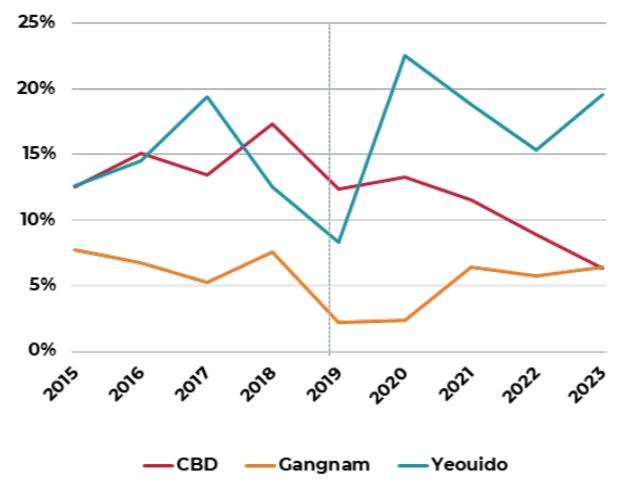
GRADE A SUPPLY OUTLOOK BY SUBMARKET
2015 TO 2023F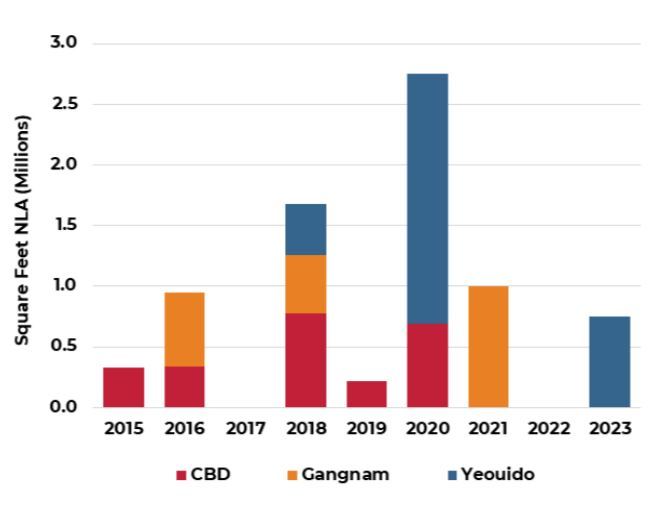
OFFICE RENTAL OUTLOOK
Q4 2018 = 100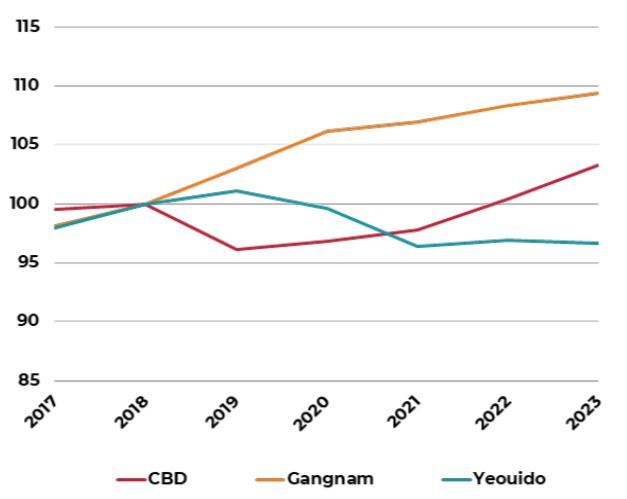
Sources: JLL, as of September 2019
China
Short-term demand weakness in Shanghai and Beijing
SHANGHAI
PUDONG CBD: SHORT-TERM WEAKNESS, FAVOURABLE OUTLOOK
Demand weakness in Liujiazui is attributable to the global economic uncertainty, the government’s deleveraging campaign and the leasing competition from decentralized markets like New Bund (Qiantan). Landlords have been focused on maintaining occupancy levels, offering renewals at a discount. Year-to-date, rents in 2019 have already declined by 8.5% and we expect further rental weakness to mid-2020. AEW believes however, that medium- to long-term fundamentals in Liujiiazui remain attractive- the submarket’s supply cycle ended in 2018, and we do not expect any new construction in the next five-year period. Further, the opening-up of the finance and insurance industry to foreign firms will add to new sources of demand and support leasing momentum.
PUXI CBD: DIVERSE DEMAND SUPPORTS LEASING
Demand in Puxi CBD is varied across sectors and industries, unlike Pudong, which has the bulk of the tenant-base from the finance industry. As a result, demand in Puxi has been more stable year-to-date, with a total take up of 613,000 square feet and vacancy rates declining to 8.5% as of end-September 2019. Going forward, supply pressure from decentralized markets will impact the periphery CBD submarkets. We expect rents in the core CBD submarkets of Jing An, Xuhui and Changning to have minimal impact and for rents to hold up better.
BEIJING
NEW SUPPLY IN CBD INCREASES LEASING COMPETITION
Despite the positive gross leasing volumes of 1.1 million square feet in Q3, actual take-up has slowed. Landlords remain flexible in lease negotiations, offering more favorable terms to tenants. This is especially so in the core submarkets where new supply has increased leasing competition – about 2.0 million square feet is completing in the new CBD precinct (Guomao) in Q4 2019 with another 4.3 million expected by the end of 2021. As of Q3, only about 40% of this space is occupied/pre-committed. Landlords are expected to ramp up their leasing efforts and neighboring submarkets will be most affected, especially as tenants take the opportunity to upgrade premises at a competitively-priced rents.
PUDONG OFFICE SUPPLY & VACANCY
2016 TO 2023F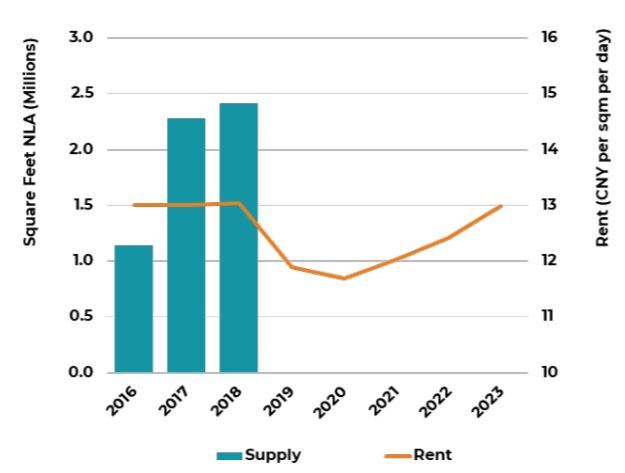
BEIJING FORECAST SUPPLY
2019 TO 2023F 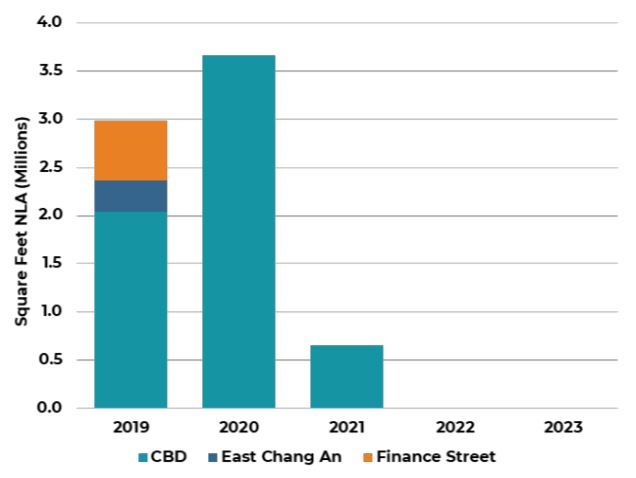
OFFICE RENTAL OUTLOOK
Q4 2018=100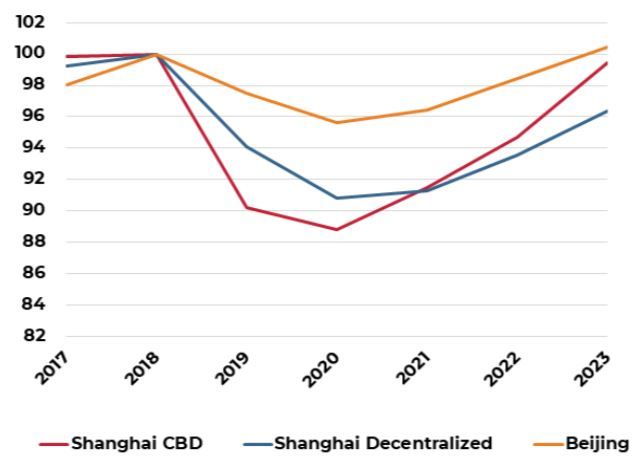
Sources: JLL, as of September 2019
Hong Kong
Commercial markets heavily impacted by US-China trade tensions and protracted social unrest
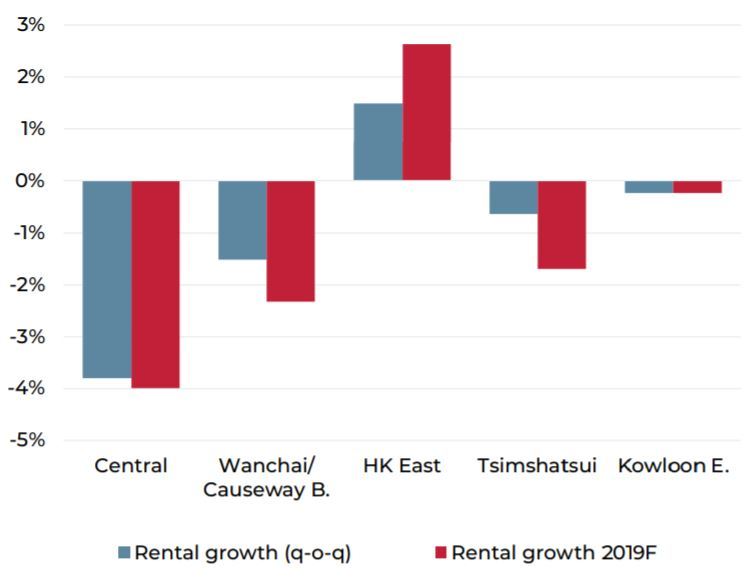
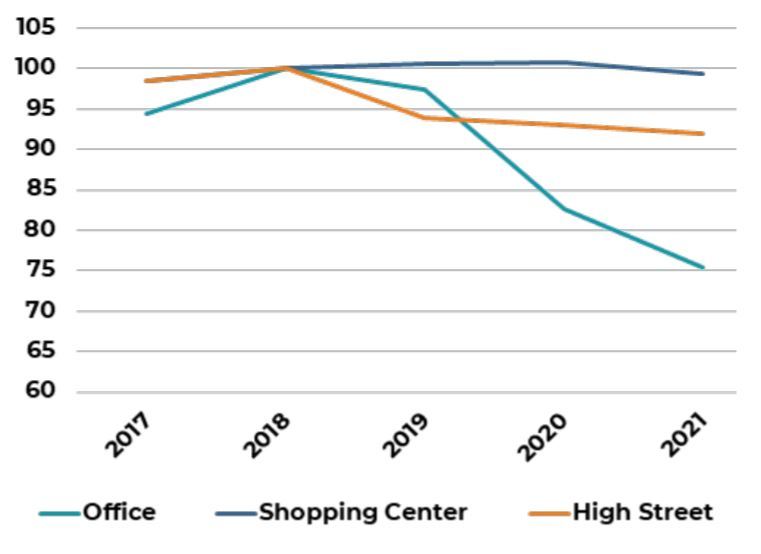
RENTS HAVE PEAKED, DOWNCYCLE BEGINS
Worsening macro-economic conditions and the protracted social unrest have had a direct impact on the office leasing market. Demand on Hong Kong Island has contracted for four straight quarters and vacancy rates have increased by 1.4 percentage-points since the end of 2018 to 3.3%, a five-year high. While previously limited vacancy has given landlords the ability to hold rents in the first half of the year, tenants are taking advantage of increasing vacancy and falling demand to negotiate lower rents. Rents in the overall market fell for the first time since 2013, down 2.2% in the quarter.
CORRECTION STRONGEST IN CENTRAL
The leasing slowdown and downward rental adjustment was more pronounced in Central, due to the additional impact of decentralization trends. AEW understands that spot rents in Central have already declined by about 5% to 8% since the start of the year in some buildings.
NARROWING RENTAL GAP COULD IMPACT DECENTRALIZATION
Decentralization trends persist as cost management remains a priority. Positive demand in Q3 was concentrated in Hong Kong East where tenants were moving into the recently completed K11 Atellier. While Hong Kong East has benefited from cost-conscious occupiers leaving Central for a cheaper alternative, this demand could dry up as landlords in Central aim to lower the rental gap that was previously driving tenants out.
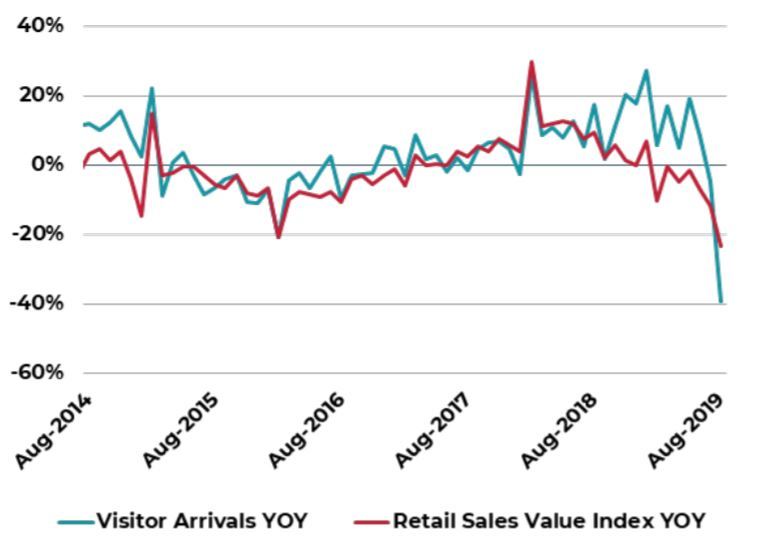
RETAIL AND TOURISM SECTORS DECLINE
Weeks of protests on Hong Kong’s streets has caused significant disruption to inbound tourism and consumption-related activities. Overall tourist arrivals fell about 40% in August year-on-year while safety concerns have resulted in retailers staying closed as well as shoppers and tourists staying home. In August, retail sales declined by 23% year-on-year and expectations are for even worse indicators in the months of September and October.
Given the levels of uncertainly, leasing decisions in both high-street and major shopping malls have been delayed and there is an increasing backlog of vacancies. More leases are being renewed at significant discounts (between 40 to 50% lower) and on shorter lease term periods. AEW understands that some landlords are looking at various options to help struggling tenants which include allowing monthly lease renewals, increasing promotional activities and postponing rental payments.
HONG KONG OFFICE RENTAL CHANGE
Q3 2019 and 2019F
RETAIL SALES AND TOURIST ARRIVALS
AUG 2014 TO AUG 2019
COMMERCIAL RENTAL OUTLOOK
Q4 2018= 100
Sources: JLL, as of September 2019
Singapore
Economic uncertainty strains rental growth
ECONOMIC HEADWINDS IMPACT LEASING ACTIVITY
Rents in Singapore grew by 6.0% in the first three quarters of 2019, but the pace of growth has decelerated sharply since April. Several months of economic weakness, especially in the manufacturing and related services industry has impacted office demand. Tenants have been focused on renewals in existing premises, to avoid incurring additional costs, and as a result, there were limited new leases signed in the quarter. There have also been several cases where companies are turning to flexible space options as an interim space solution. These are not reflected in the overall demand numbers as these are spaces already rented out by co-working operators.
VACANCY REMAINS LOW BUT NEAR-TERM OUTLOOK WEAK
Vacancy in the sector remains limited, falling 2.6 percentage-points since the start of the year to 4.6%, a new low since 2010. The lack of new supply in the market till the completion of ASB Tower (in H2 2020) indicate near-term favorable fundamentals, however the strength of the rental market will be largely dependent on economic conditions in the next six to 12 months. Given the weak economic outlook, rents are expected to remain flat for the next year, with upside potential should economic conditions stabilize sooner.
ACTIVE OFFICE TRANSACTION MARKET
Despite the downward adjustment in the rental outlook, on a relative basis, Singapore’s office market still appears attractive. Besides low vacancy rates, the prospect of withdrawals through a new government led scheme to rejuvenate the CBD could keep stock growth limited. Investors have capitalized on this and 2019 has been an extremely active year with $5.2 billion in office deals completed and pending, about 1.6 times the same period last year.
RETAIL RENTAL GROWTH CHALLENGED
The retail sector continues to be sluggish, reflecting the flow-through weakness from the external sector and the slowdown in discretionary spending. The sector remains rent-sensitive with little or no growth in the last 12-months. New demand is limited as retailers delay expansion plans in the uncertain climate. In Q3, new leases signed mostly stemmed from the F&B industry.
Like the office sector, the rental outlook appears challenged in the near term. However, the lack of major supply up to 2022 could support rental growth, after economic conditions stabilize.
CBD OFFICE GROSS LEASING VOLUME
Q3 2017 TO Q3 2019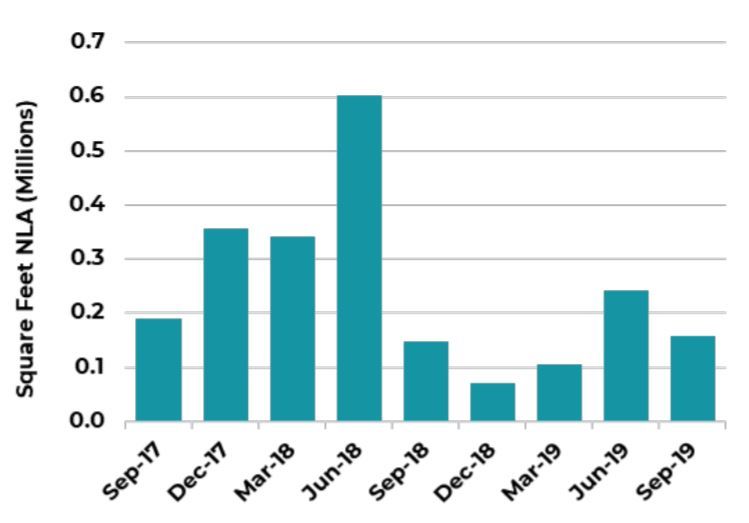
CBD OFFICE SUPPLY AND VACANCY RATES
2014 TO 2023F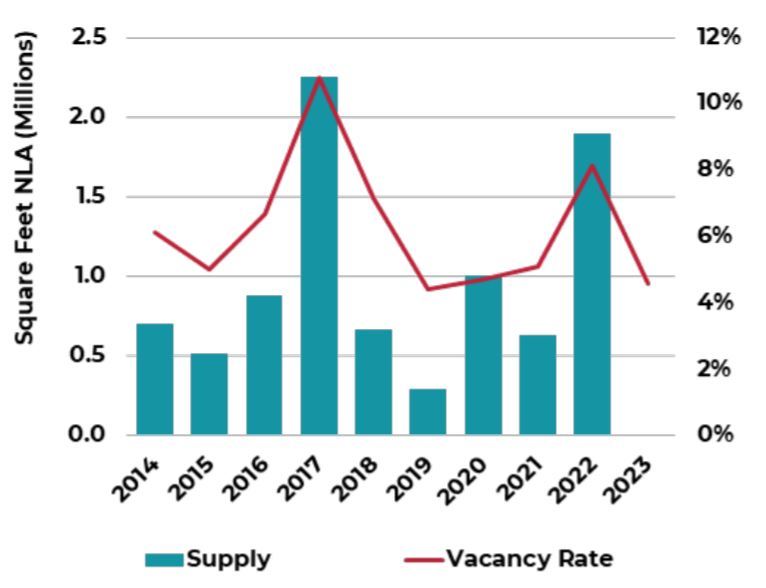
COMMERCIAL RENTAL OUTLOOK
Q4 2018= 100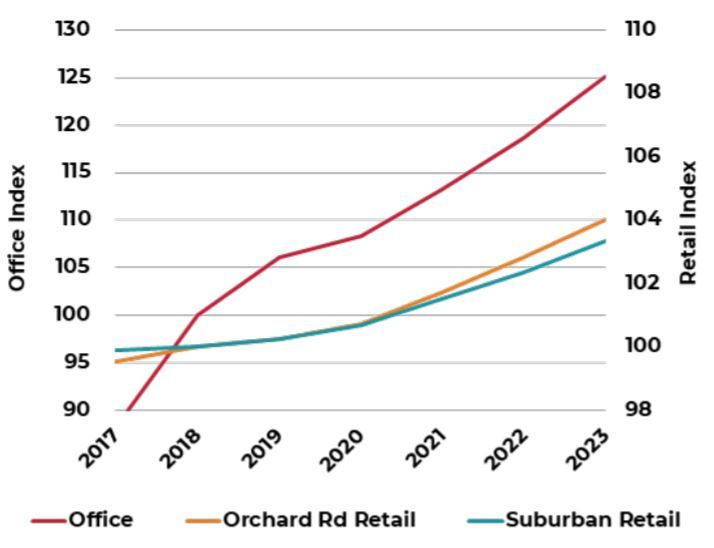
Sources: JLL, as of September 2019
Australia
New benchmark pricing in North Sydney, healthy leasing market in Melbourne CBD
SYDNEY
MORE SHADOW SPACE, LANDLORDS INCREASE INCENTIVES
Even though vacancy rates remain low in the CBD (4.6%), the volume of sublease has increased in the quarter; estimated at about 0.7% of overall stock. This level is low but is indicative of a general pull-back in leasing demand. At the same time, incentives in the market have been trending upwards in 2019 in anticipation of oncoming supply over the next few years. In 2019, there was one new completion; 60 Martin Place (418,000 square feet) and between 2020 and 2021, another 1.7 million square feet is expected to complete. Rental growth is expected to ease in the near term, in tandem with the delivery of new supply, up between 1.0% to 2.0% p.a.in 2020 and 2021.
TECH FIRMS SHOW INTEREST IN SYDNEY METRO MARKETS
Strong demand persists in a few of Sydney’s metro markets, especially among technology sector tenants. This follows the completion of the Sydney Metro North West which was operational between Chatswood and Tallawong (13 stations) the end of May 2019. Submarkets that have seen a pick-up in leasing interest on account of the new metro include Macquarie Park and St Leonard’s, among others.
North Sydney’s metro station (Victoria Cross) is expected to complete only in 2024, but the submarket appeals to tenants due the still-attractive rental gap and proximity to the CBD. Rents in North Sydney were up 1.3% in the quarter and 10.1% year-on-year. A recent purchase (107 Mount) for AUD 17,200 per square meter is a new benchmark pricing in the Grade B office, North Sydney submarket.
MELBOURNE
FAVOURABLE OUTLOOK IN MELBOURNE CBD
Healthy demand continues to push Melbourne CBD’s vacancy rate down further to 3.7%, the lowest across all Australian Capital CBDs. Reflecting the strength of the leasing markets, rents were up 5.0% in the quarter. One more office completion is expected in Q4 2019, but beyond this, there are another eight new projects under construction between 2020 and 2022, amounting to 4.2 million square feet (already 76% pre-committed.) As a number of these pre-commitments are relocations, the volume of the upcoming backfill could increase leasing competition in the near-to medium-term. AEW understands that this is not an immediate concern as backfill leasing has been active, plus more stock withdrawals are anticipated in the coming month. Effective rental growth is expected to continue, in Q4, bringing full 2019 growth to 6 to 7% and further 2.0% to 3.0% p.a. in 2020 and 2021.
SYDNEY METRO RENT DISCOUNT TO CBD
2014 TO Q3 2019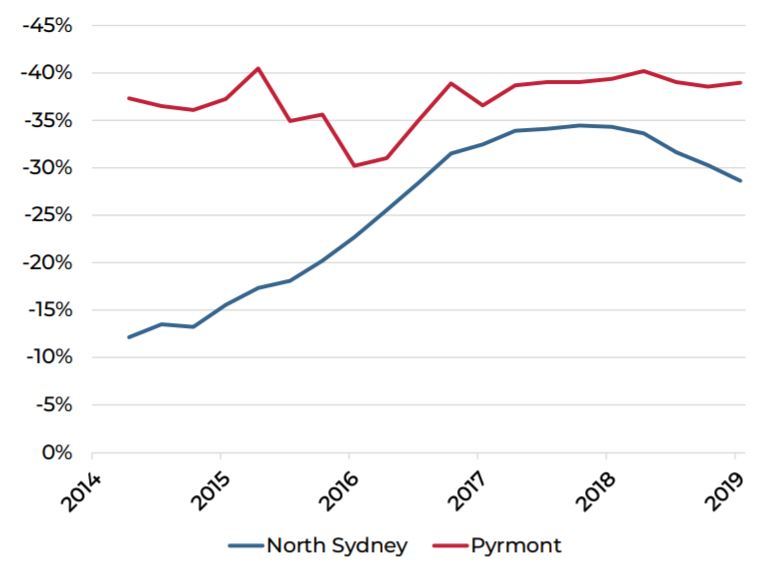
MELBOURNE CBD NEW SUPPLY & VACANCY
2014 TO 2023F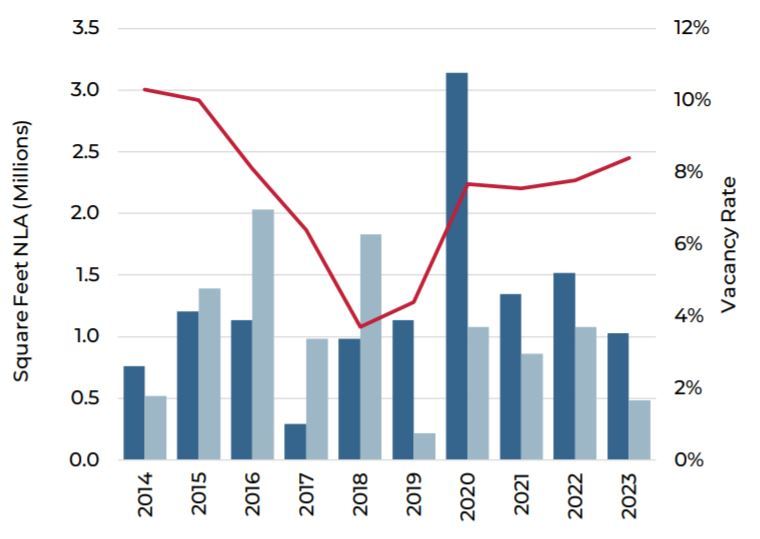
OFFICE RENTAL OUTLOOK
Q4 2018=100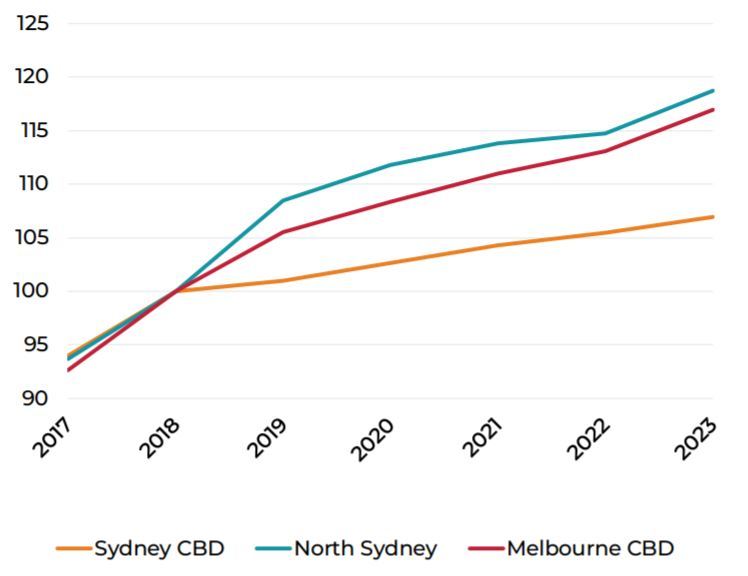
Sources: JLL, as of September 2019
Capital Markets
TRANSACTION MARKETS REMAIN ACTIVE
Although near-term income growth in many Asia Pacific markets are challenged in the current economic climate, investment into real estate continues to be active due to attractive yields spreads and the large weight of capital looking to be placed.
Cumulative year-to-date volumes across major cities in Asia Pacific have reached $96.7 billion, including about $15.7 billion in deals that are still under contract. Compared to the same period last year this represents a 5.5% year-on-year increase.
Across property types, the office sector, which AEW believes to have the most compelling set of fundamentals, continues to attract the bulk of capital. Investments into the office sector are up 13% year-on-year, while investments into retail and industrial have fallen by 5% and 25% respectively from the same period last year.
UNEVEN PICTURE ACROSS MARKETS
As with the variance across sectors, the pace of investments across markets year-to-date have been uneven. Hong Kong and Tokyo have seen sharp decreases of 36% and 12% year-on-year respectively, notably from the high base in 2018. In Hong Kong, the retreat of capital was expected at the start of the year due to an anticipated rental correction in the office market. However, this decline has been exacerbated due to social unrest in the city since June.
Meanwhile, investments into Beijing, Singapore, Shanghai and Sydney were up substantially from the same period last year. Beijing overtook Shanghai as the most active city in China, for the first time since 2008 with $7.7 billion in transactions. In Singapore, the volume of deals was up 100% year-on-year, reaching $9.5 billion, setting a new record for the market.
CROSS-BORDER REMAINS ELEVATED
Cross-border interest has also increased over the year, making up about one-third of total transaction volumes year-to-date. About 50% of all cross-border deals were by fund managers who remain extremely active. Latest fundraising report by PERE indicated about $27.5 billion raised for Asia Pacific strategies in the first three quarters of 2019. Largest capital sources for deals transacted in 2019 were from funds headquartered in Hong Kong, China and Singapore. Major cross-border deals in Q3 2019 to highlight include Duo by Gaw Capital and Allianz, Anson House by Arch Capital in Singapore, as well as Greenland Huangpu Center by Brookfield in Shanghai.
CUMULATIVE TRANSACTION ACTIVITY
2016 TO 2019 YTD 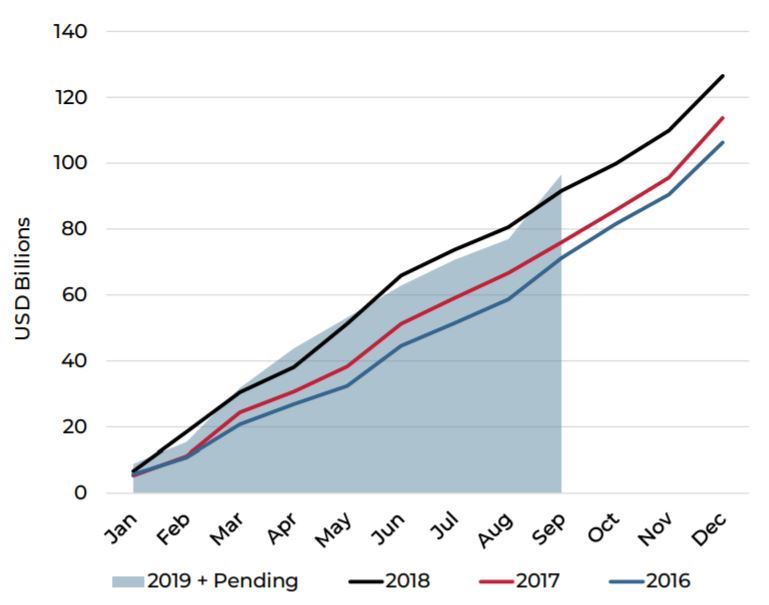
TRANSACTION VOLUME BY MAJOR MARKET
2015 TO 2019 YTD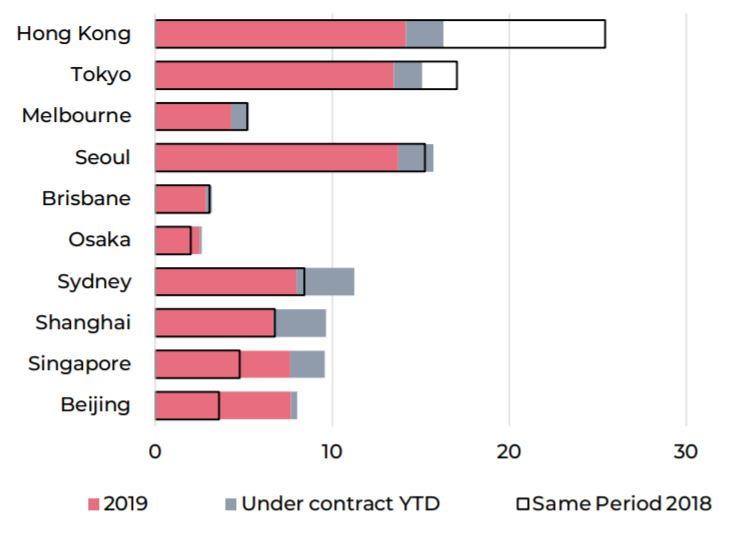
CROSS-BORDER SHARE
2010 TO 2019 YTD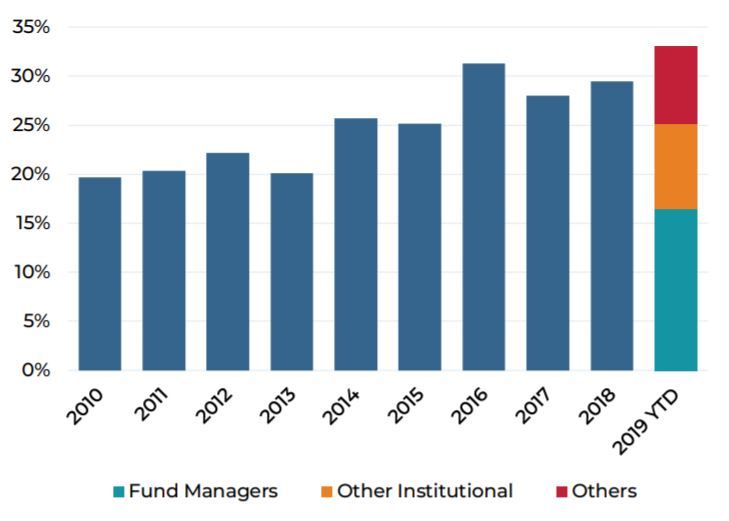
Source: RCA
Note: Transaction volumes in charts above include only income producing assets in the following markets: Beijing, Brisbane, Hong Kong, Melbourne, Osaka, Seoul, Shanghai, Singapore, Sydney and Tokyo
The information and opinions presented in this research piece have been prepared internally and/or obtained from sources which AEW believes to be reliable; however, AEW does not guarantee the accuracy, adequacy, or completeness of such information.