Introduction
Few would argue that the safe and efficient distribution of key food products and medicines is critical to a well-functioning economy and society. For many years prior to the pandemic, changing consumer preferences favoring fresh rather than processed food increased demand for more volume within the temperature-controlled portion of the global supply chain. More recently, advances in various pharmaceuticals and biomedical treatments have also heightened the need for additional capacity. The experience of the COVID-19 pandemic has only served to heighten both the demand for refrigerated space as well as the awareness of the critical role it plays in society broadly. To this point, the U.S. Cybersecurity & Infrastructure Security Agency (CISA) in December issued guidance for physical security for cold storage locations, particularly with respect to the safe and efficient distribution of COVID-19 vaccines.1 Going forward, we believe that this portion of the global supply chain will become increasingly more important as the value added by temperature controlled storage advances in step with the demand for the products and customers that it serves.
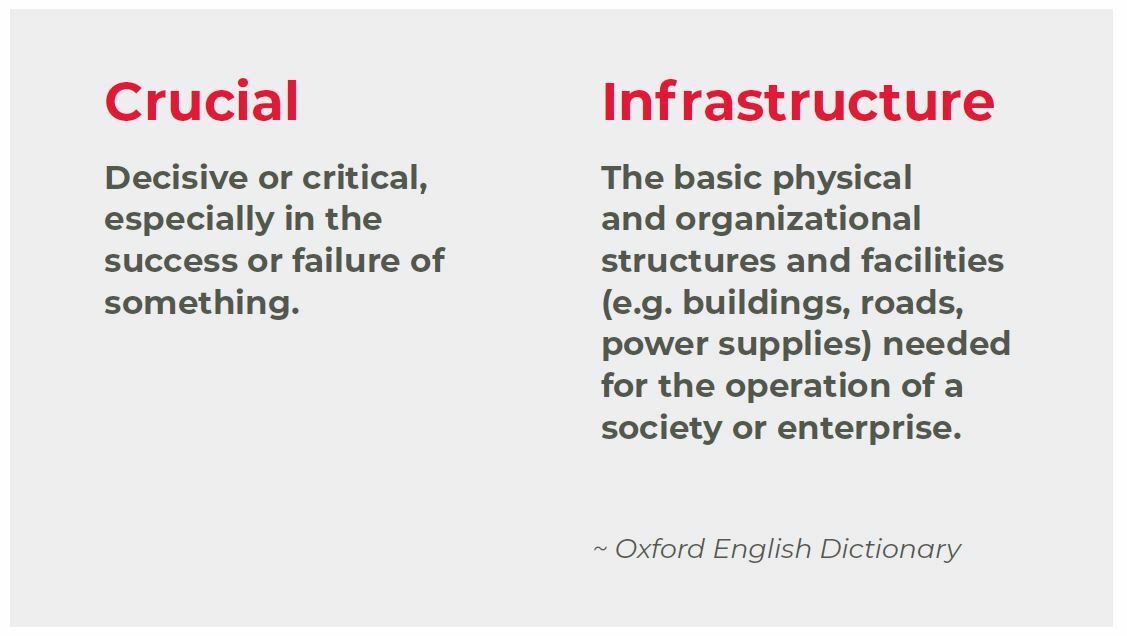
What Is Cold Storage?
The term “cold storage” typically refers to the segment of the global supply chain that provides storage for products and materials that require some form of temperature control, most typically food and pharmaceuticals. As such, cold storage properties, also known as refrigerated warehouses, represent a critical subset of the much larger universe of warehouse and other distribution properties. Cold storage layouts typically match a tenant’s operations with multiple temperature and humidity zones for various product categories such as meat, dairy, produce, frozen goods, flowers, pharmaceuticals, and other perishables.
Cold Storage Considerations Today
Cold storage is a fast growing but relatively small subsector of the broader U.S. Industrial market, accounting for perhaps +/- 2% of total industrial stock. Much of the existing cold storage stock is relatively old, with roughly half of all cold storage capacity built prior to 1990. While typical non-refrigerated warehouse/bulk distribution (“dry”) properties require little physical specialization, cold storage properties typically feature specialized climate-controlled areas that fall into two general categories:
COOLER OR COLD (33-39°F)
Used to store perishables (e.g. fruits, vegetables, flowers, dairy, and meats)
FREEZER (0-32°F)
Generally used to store frozen vegetables, fruit, fish, meat, and seafood
Ceiling heights (clear heights) for modern traditional non-refrigerated (dry) warehouses currently range from 32 to 40 feet compared with 36 to 60 (or higher) feet for modern freezer buildings. Often, a typical dry warehouse can be retrofitted with what is referred to as a “Box-in-Box” system, whereby insulated metal panels are installed to form distinct climate and moisture environments in an otherwise non-climate-controlled building. Generally, purpose-built (i.e. not retrofitted) cold storage development is more complicated to design and develop and typically has much higher additional costs for mechanical equipment and other physical requirements of the building (e.g. enhanced and heated slabs within freezer space). Historically, this greater cost and complexity has acted to limit speculative development within the sector.
Broadly, there are two categories of refrigerated warehouses in the United States today: public and private. A private refrigerated warehouse is one that is owned or leased by a company that primarily produces or owns the products that are kept in the warehouse, such as a food manufacturer or a grocery company. It is generally used to store only that company’s products.
TABLE 1: CHARACTERISTICS OF PRIVATE AND PUBLIC WAREHOUSES
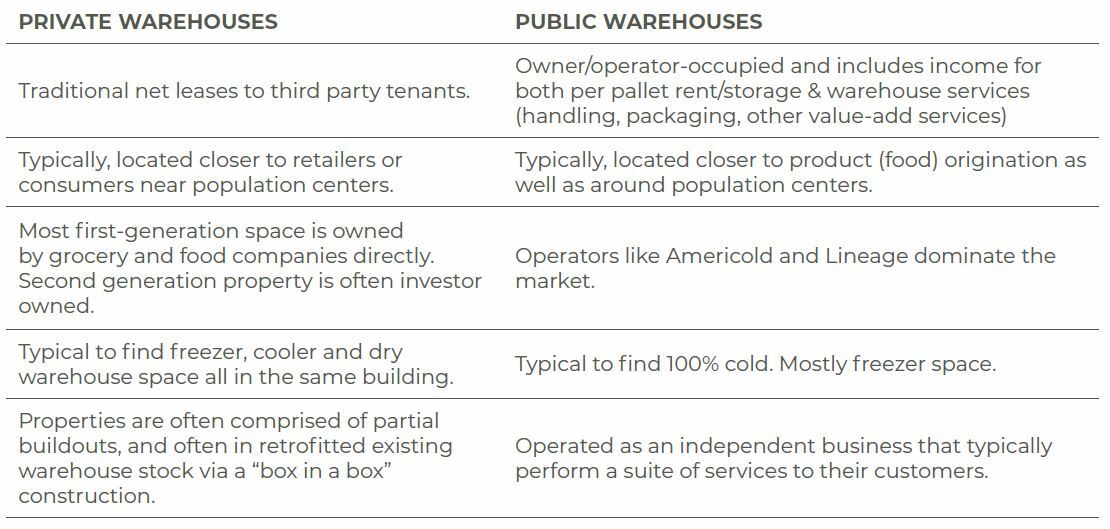
Source: Global Cold Chain Alliance
In contrast, Public Refrigerated Warehouses (PRWs) store and distribute products on behalf of other companies, usually on a rental pallet per month basis. Public warehouses are typically owned and operated by third-party logistics providers (3PLs) that, in addition to providing refrigerated space, often provide various product handling services to their tenants.
Private refrigerated warehouses often have a higher percentage of space that is not refrigerated (i.e. dry), while PRWs are more likely to be primarily cold and often largely freezer space, typically 80% or more.
While all cold storage properties offer some degree of temperature control and refrigeration, the sector represents a wide range of physical spaces, covering everything from movable refrigerated containers to purpose-built specialized warehouses for very specific industry and tenant needs. Please refer to the appendix for more detail.
TABLE 2: TYPES OF COLD STORAGE WAREHOUSES
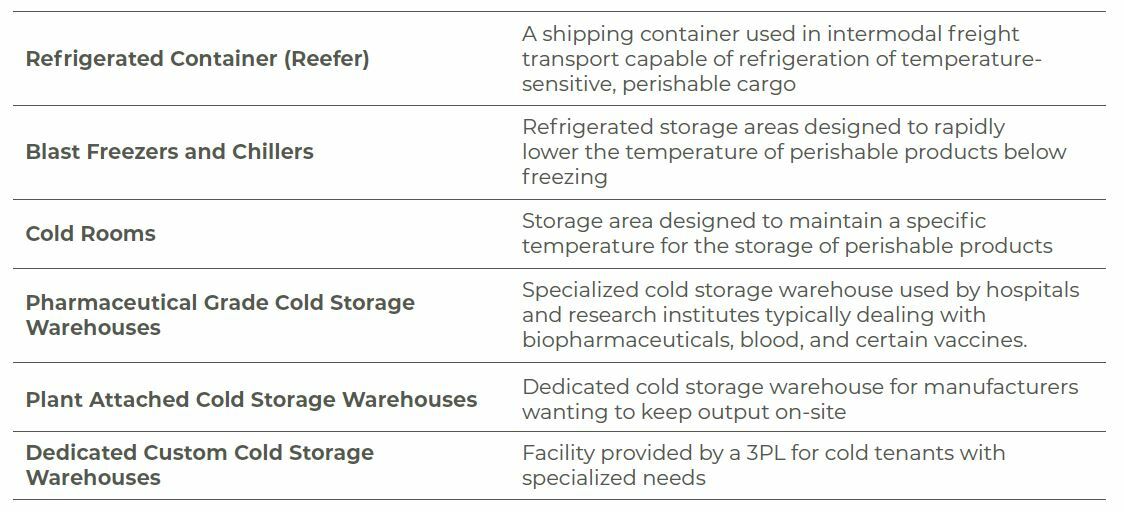
Source: Winnesota Regional Transportation
How Large is the U.S. Cold Storage Property Sector?
Precise measurement of the U.S. cold storage property sector is elusive as many properties may be only partially temperature controlled with the remainder being dry space (non-refrigerated). Also, properties originally developed as dry can be retrofitted to include refrigeration in total or part and this is not always captured by brokerages and other third-party data providers.
The U.S. Department of Agriculture (USDA) regularly reports on the storage capacity of the nation’s refrigerated warehouses2 but with some notable qualifications of the data. Specifically, beginning with their January 2018 report, the USDA modified the inclusion criteria for their survey to include only properties that are artificially cooled to a temperature of 50 degrees Fahrenheit or lower, normally store food products for 30 days or more and store at least one of the 110 commodities reported in their Monthly Cold Storage inventory report. Given these restrictions, the USDA tally, while informative, clearly misses various segments of the broader cold storage market that are supporting inventories not included in the 110 USDA tracked groupings (e.g. pharmaceutical products) or tenants experiencing much faster inventory turnover (e.g. a cold storage warehouse that is supplying final demand at local restaurants). Please refer to the appendix for more detail on the characteristics of dry versus cold storage.
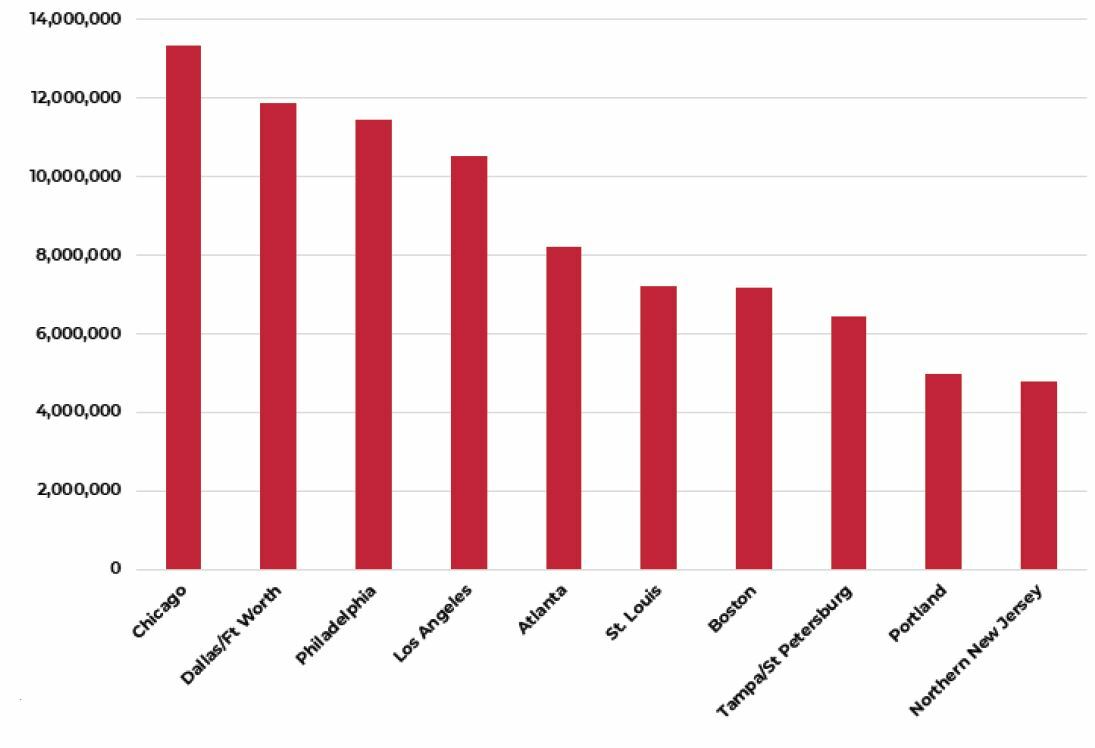
FIGURE 1: TOP TEN STATES BY COLD STORAGE SQUARE FOOTAGE
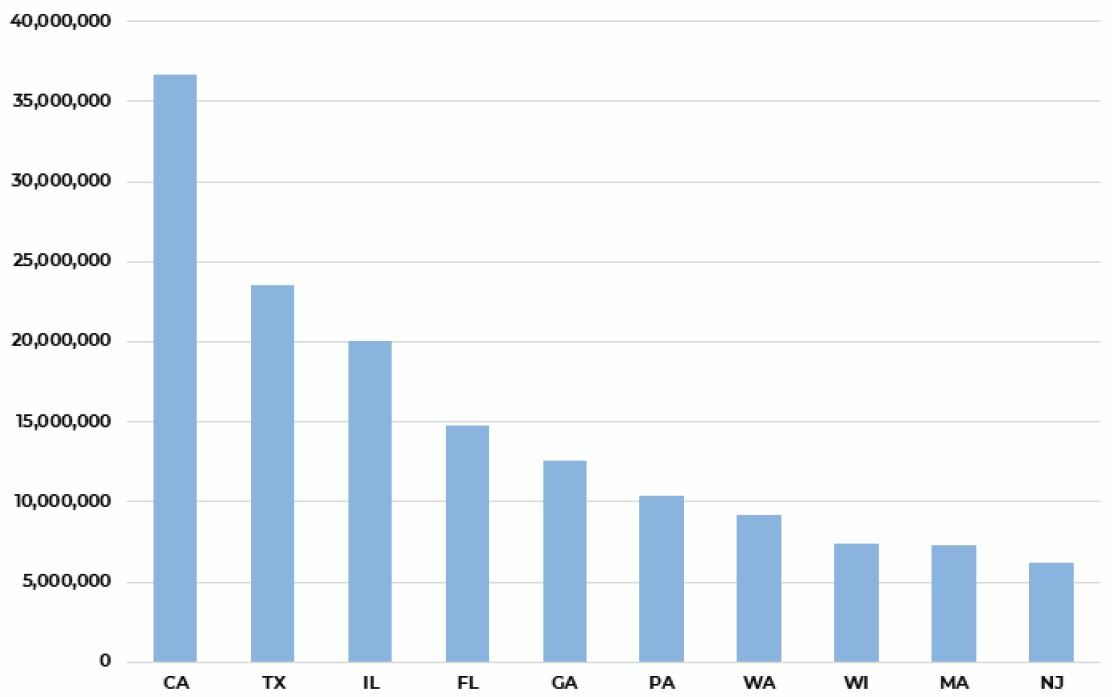
Source: CoStar
Despite these limitations, as of the end 2019 the USDA recorded 3.65 billion total cubic feet of gross refrigerated storage space and 2.97 billion cubic feet of usable space across 912 distinct properties (551 public warehouses and 361 private warehouses). Usable freezer space represented 80% of all space with 20% identified as cooler space. Public warehouse space currently represents 74% of total refrigerated space tracked by the USDA.
The CoStar Group tracks a somewhat larger universe of refrigerated warehouses totaling approximately 240 million square feet across more than 2,200 properties. While ceiling height data is not available for all properties, the average height for properties reporting is between 20 and 25 feet indicating gross cubic footage between five and six billion cubic feet. While larger than the USDA universe, the CoStar sample likely also undercounts the true universe as numerous properties in their database are classified as “food processing” despite having some degree of refrigerated space. Additionally, there are likely numerous properties throughout the country that have some degree of refrigeration that is simply not reported. Throughout this report, we are using the set of properties classified as refrigerated unless otherwise noted.
FIGURE 2: TOP TEN METRO AREAS BY COLD STORAGE SQUARE FOOTAGE
Source: CoStar
The geographic distribution of cold storage warehouse space correlates closely with aggregate population and food production. Given this, it is no surprise that California is home to more than 50% more cold storage space than the next largest state, Texas. Interestingly, despite California’s rank as the top state for aggregate refrigerated warehouse space, the top three metropolitan areas are Chicago, Dallas/Fort Worth and Philadelphia with Los Angeles coming in fourth.
Although many cold storage tenants are found in industry sectors that require a high level of precision regarding the care and status of their products (e.g. certain pharmaceuticals and food applications), the U.S. inventory of cold storage properties is fairly antiquated with roughly half of all properties built before 1990.
FIGURE 3: COLD STORAGE INVESTORY BY DECADE BUILT
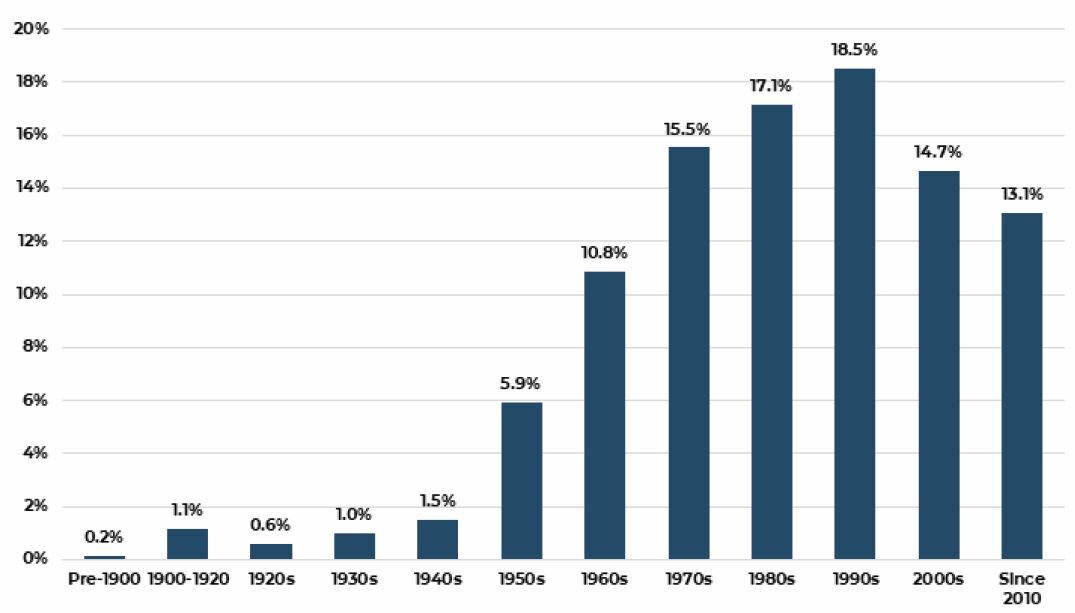
Source: CoStar
The main reason that the age of the cold storage stock matters is directly related to building height and, consequently, cubic volume. Warehouses have generally become taller over time to reflect both advances in building and warehouse management technology but also to reflect rising land costs. The pre-1990 built cold storage inventory is largely lower height construction, typically averaging between 20 and 25 feet. In contrast, the stock of properties built after the financial crisis (i.e. after 2009) have an average height of more than thirty feet and maximum height over seventy feet.3
FIGURE 4: AVERAGE AND MAXIMUM HEIGHT OF COLD STORAGE WAREHOUSES BY DECADE BUILT
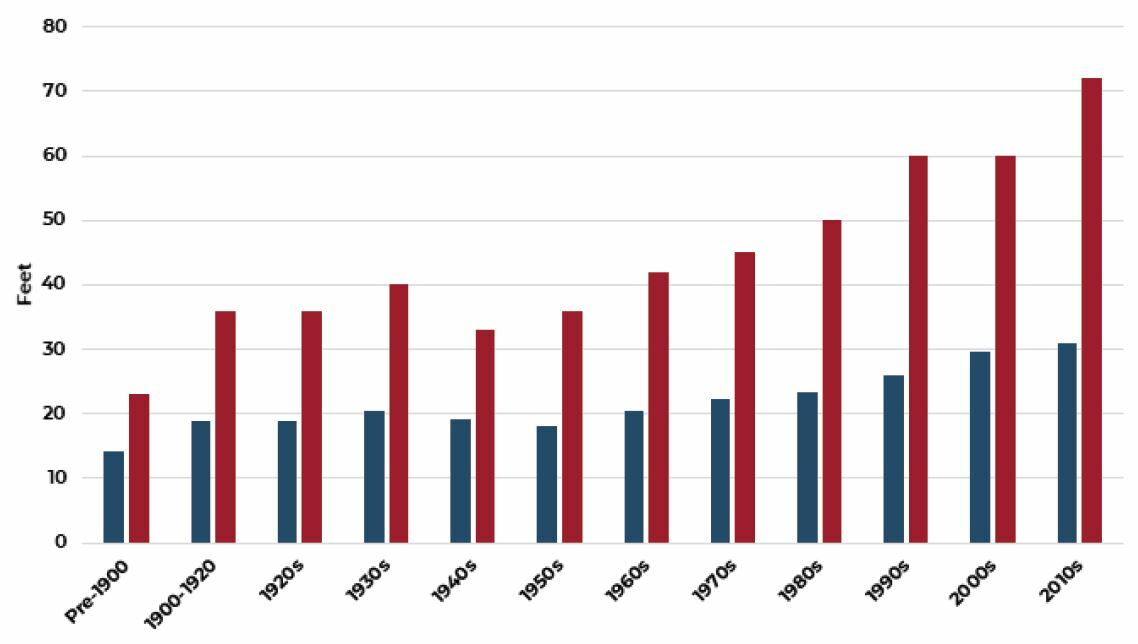
Source: CoStar
Cold Storage Industry Concentration
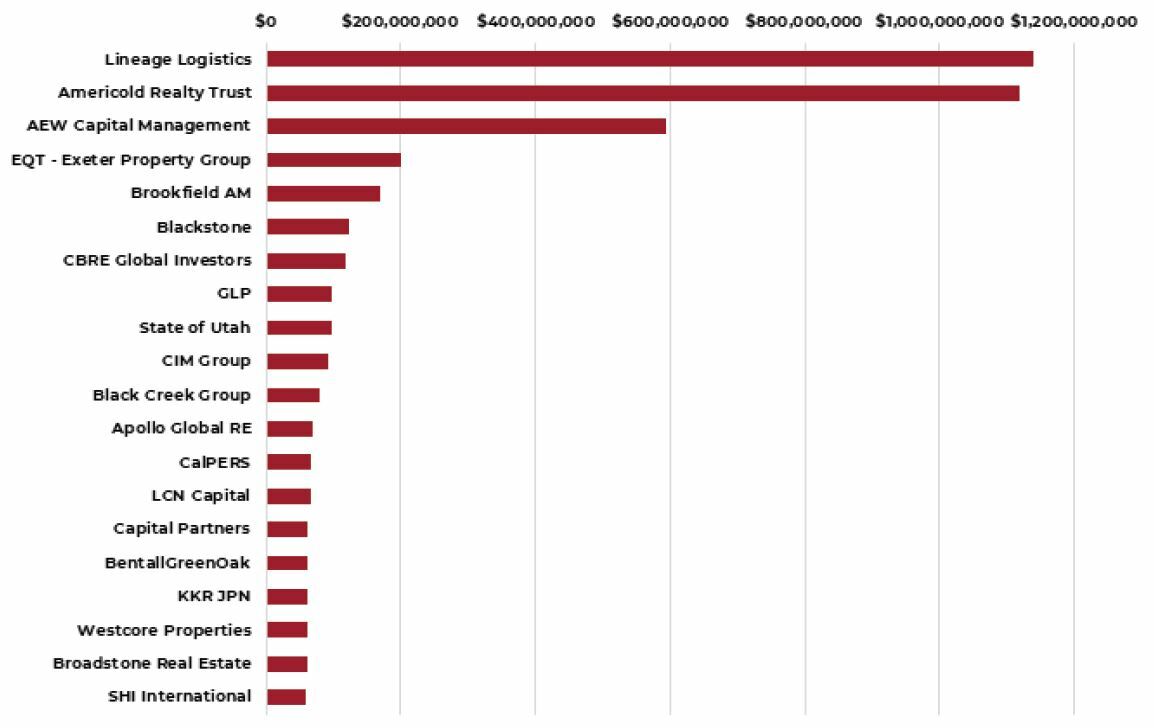
The North American cold storage sector is fragmented with two companies (Lineage Logistics and Americold Logistics) representing roughly one-third of the total cubic volume identified from the CoStar data with the next eighteen largest companies accounting for less than 20%. In addition to being the largest company in the sector, Lineage is also the fastest growing with total cubic feet increasing by more than 20% between 2019 and 2020, followed by 16% growth for the much smaller United States Cold Storage Inc.
TABLE 3: TOP 20 NORTH AMERICAN REGRIGERATED WAREHOUSING COMPANIES
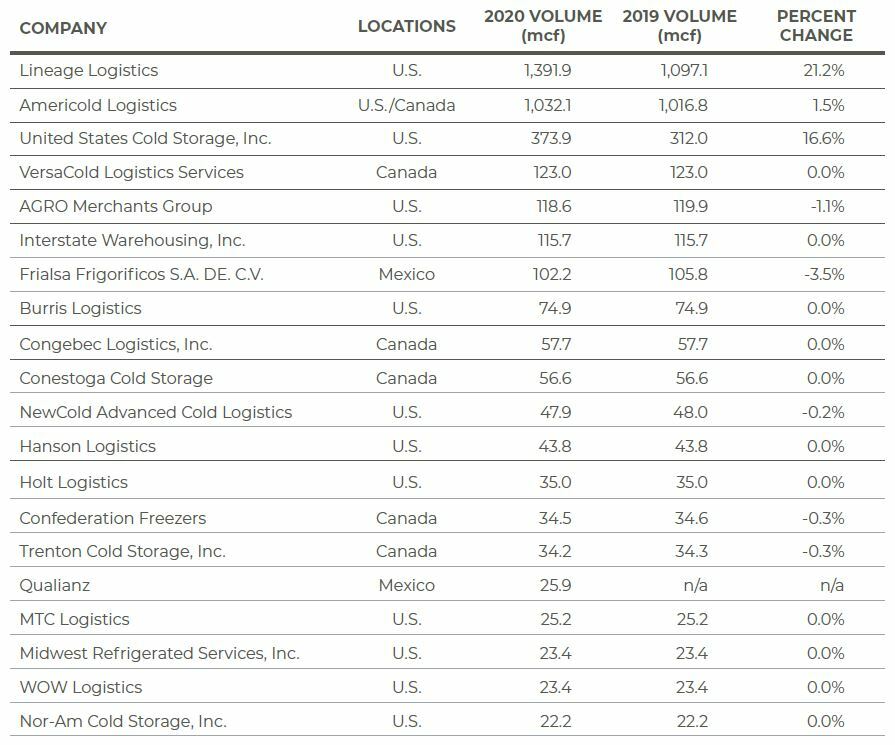
Source: International Association of Refrigerated Warehouses (IARW)
While Lineage Logistics and Americold Logistics are the largest North American cold storage companies, it should be noted that they are dwarfed by companies such as DHL and Amazon in terms of overall logistics footprint.
TABLE 4: TOP NORTH AMERICAN WAREHOUSING 3PLs
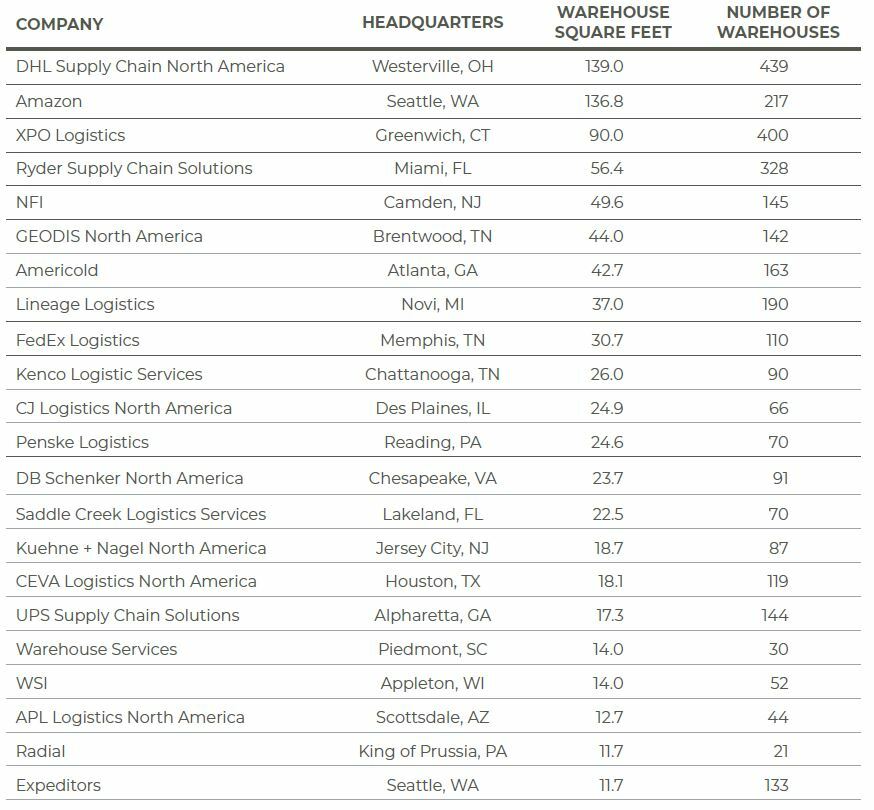
Source: Armstrong & Associates
What is Driving Demand for Cold Storage Property?
Many of the same forces driving demand for distribution space generally are also driving demand for cold storage space specifically; forces such as displacement of portions of the in-person retail channel by direct delivery to customers’ homes or other locations, growing demand for faster order fulfilment and the need for more resilient and, possibly redundant, inventory. In the case of cold storage property, this is largely related to online purchasing of food in general and fresh food specifically.
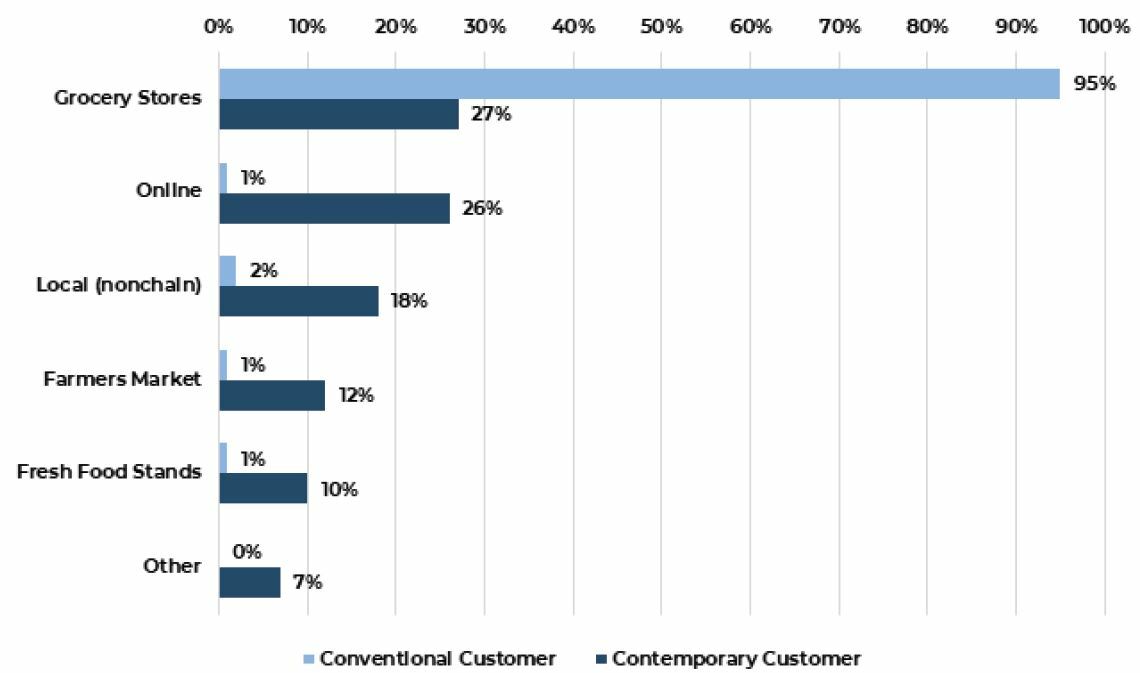
FIGURE 5: SHARE OF FRESH FOOD PURCHASED THROUGH EACH CHANNEL
Source: Deloitte
Total sales at food and beverage stores increased at an average annual rate of roughly 3% per year over the decade preceding the COVID-19 pandemic. Similarly, the share of all food and beverage purchases made online had also slowly increased from almost zero ten years ago to slightly more than 3% in 2019. During 2020, sales at food and beverage stores increased by more than 10% as most restaurants and bars were completely or partially closed due to the pandemic. At the same time, the online share of all food and beverage sales jumped to more than 10%. A recent study by Deloitte examined this phenomenon by directly surveying consumers regarding their shopping habits and preferences with respect to fresh foods specifically.4 Deloitte identified two distinct consumer profiles within their responses: conventional consumers and contemporary consumers.
Conventional consumers represented 60% of the study group and tended to be older, lower-income and more rural. Contemporary consumers, in contrast, represented 40% of the study group and tended to be younger families, more affluent, more urban and more ethnically diverse. The Deloitte researchers note that the conventional consumer shops almost exclusively at grocery stores while the contemporary consumer is more fluid, shopping across multiple channels that best suit their various purchases. They also note that both groups reported shopping less frequently in person during the pandemic and posited that this increases the need for fresh food to be even fresher at the time of purchase to minimize spoilage at home during elongated periods between shopping.5
As younger consumers, the habits of contemporary consumers will likely become the norm as this group ages. Historically, consumers generally disliked using non-store (i.e. online) channels for fresh food purchases such as meats and produce and generally preferred selecting these items themselves. The Deloitte study showed, however, that 68% of contemporary consumers trust assigned in-store shoppers to select their fresh products.
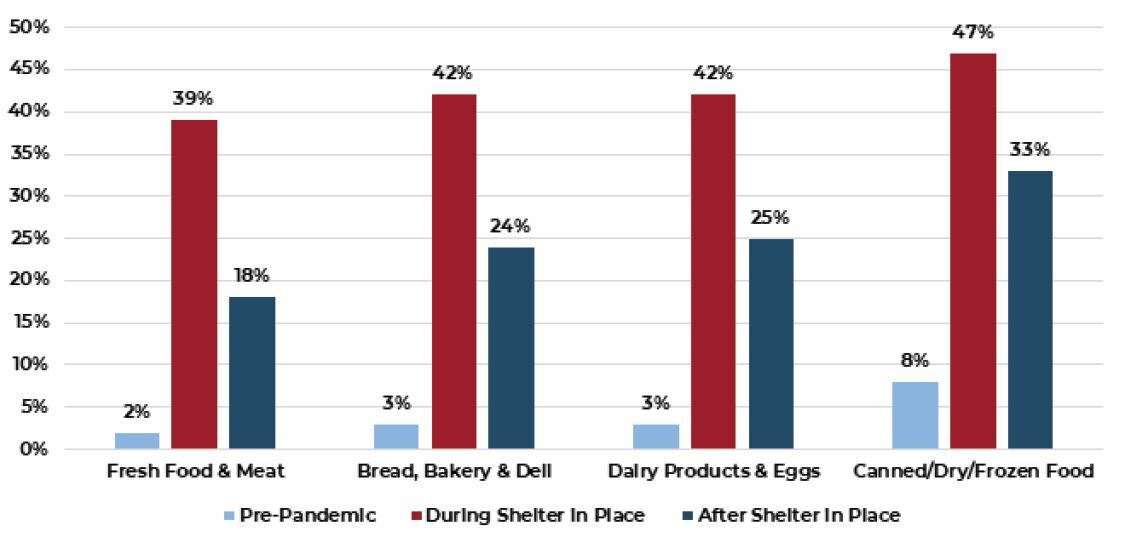
FIGURE 6: PERCENT OF CONSUMERS THAT PREFER ONLINE PURCHASES OVER IN PERSON BY CATEGORY6
Source: Mercatus
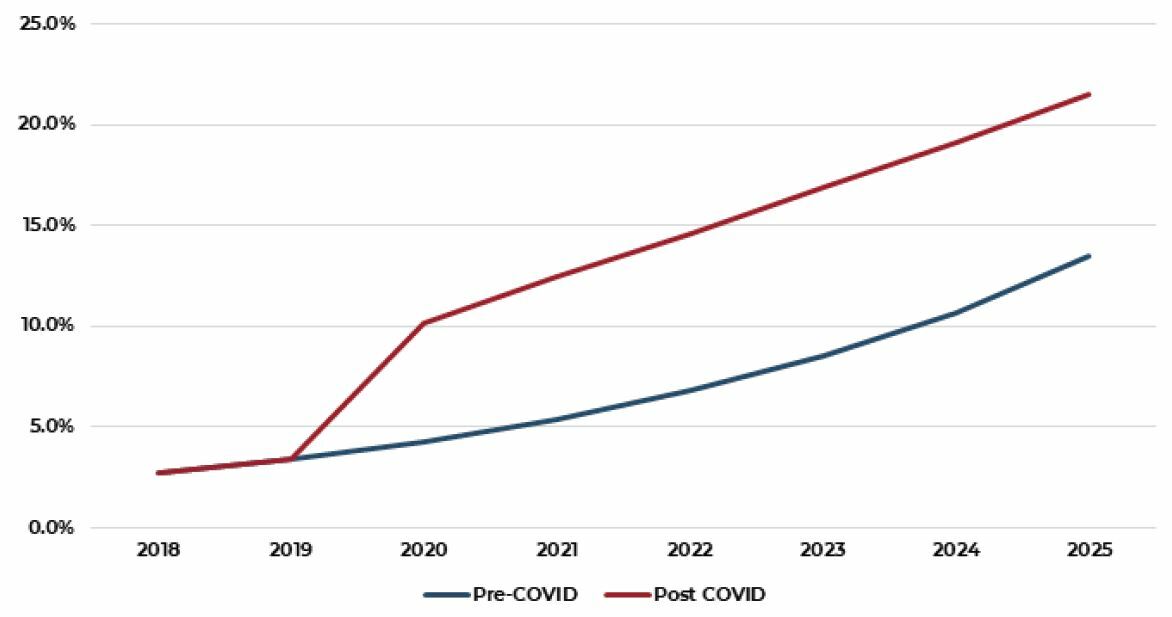
A recent survey by the online grocery platform Mercatus suggests that while most consumers preference for online purchases of groceries will retreat some from the elevated level of 2020, it is likely to remain far above the pre-COVID level going forward. Reflecting that, Mercatus projects that more than 20% of all grocery sales in the U.S. will take place online by 2025. Currently, food and beverage stores reported $863 billion of sales in 2020 and total food and beverage sales are estimated to be approximately $1 trillion when sales at other types of stores (e.g. Target and Walmart) are included. Using the online penetration estimates from Mercatus, online sales of food and beverages were approximately $100 billion in 2020. Moody’s Analytics projects 15% aggregate growth in this category, bringing total food and beverage sales to $1.15 trillion by 2025. Again, using the projected online penetration ratio for 2025 (21.5%), expected online grocery sales in 2025 will be approximately $250 billion, roughly 2.5 times the size of the 2020 marketplace.
FIGURE 7: ONLINE SHARE OF TOTAL GROCERY SALES
Source: Mercatus
While food garners the most attention, it should be noted that other common temperature sensitive and temperature-controlled goods include:
- Pharmaceutical products
- Flowers and plants
- Artwork
- Biological samples and components such as blood and some vaccines
- Specialty pharmaceuticals including orphan drugs
- Raw materials for pharmaceutical products
- Some petrochemicals
- High-tech electronic goods
- Candles
- Film
- Lipstick
- Cologne
- Certain textiles
Cold Storage Property Performance
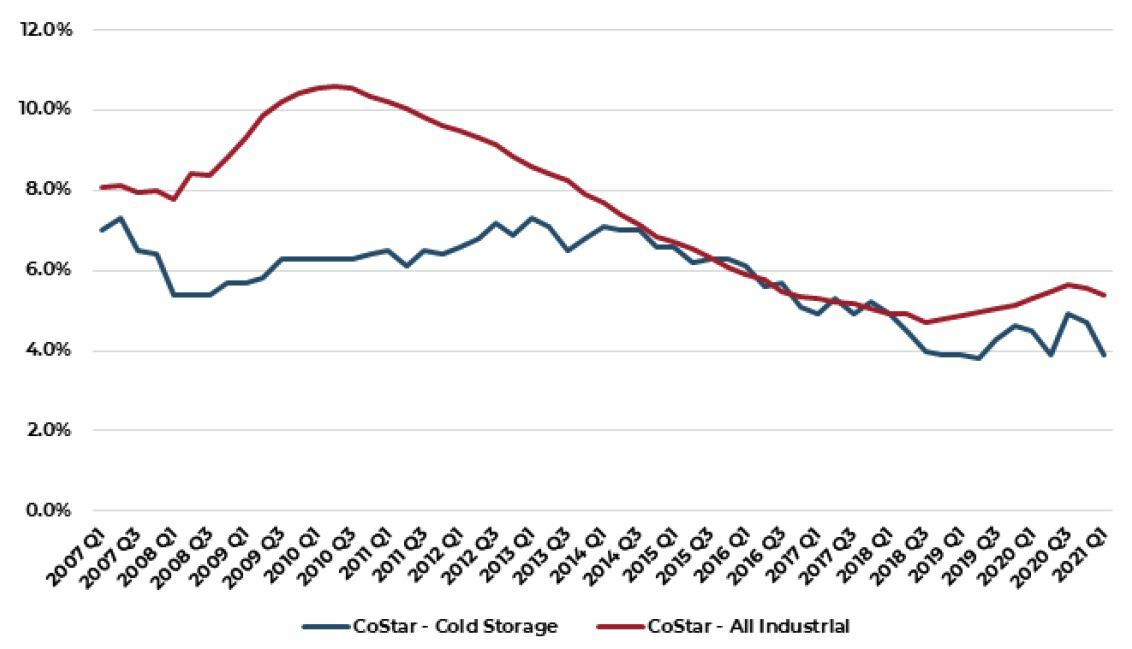
Cold storage investment performance is not measured by conventional sources such as NCREIF and there is currently only one publicly traded REIT (Americold). Overall, cold storage properties have performed as well or better than industrial properties as a whole and, at least in terms of occupancy, significantly outperformed the industrial sector average through the financial crisis period and most recently.
FIGURE 8: COLD STORAGE VACANCY RATE VS ALL INDUSTRIAL PROPERTIES
Source: CoStar
Lower structural vacancy in cold storage relative to the industrial sector in total reflects both steady demand as well as lower levels of supply. As shown in Figure 7, the year-over-year growth in the U.S. cold storage stock has been lower than the comparable growth rate for the entire industrial property sector and this difference has widened over the past 12-18 months. Currently, the cold storage stock is increasing at an annual rate of only 1%, roughly half the growth rate of overall industrial stock. Again, this likely reflects the greater cost and complexity of cold storage development relative to more commonplace dry property development.
FIGURE 9: NEW SUPPLY
YEAR-OVER-YEAR GROWTH IN TOTAL STOCK
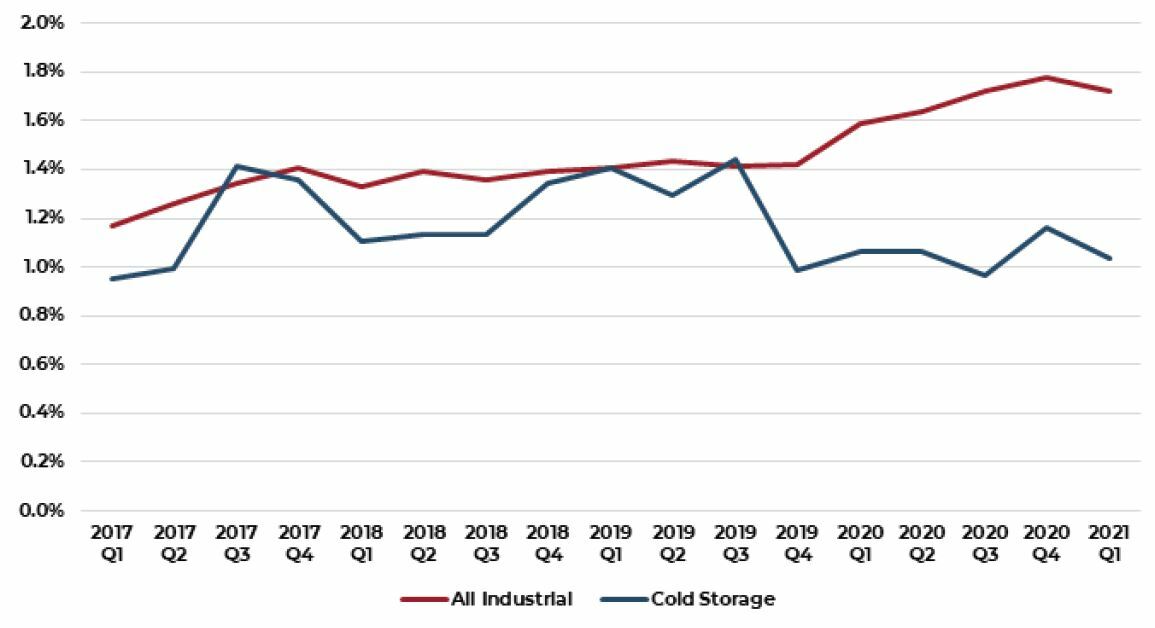
Source: CoStar
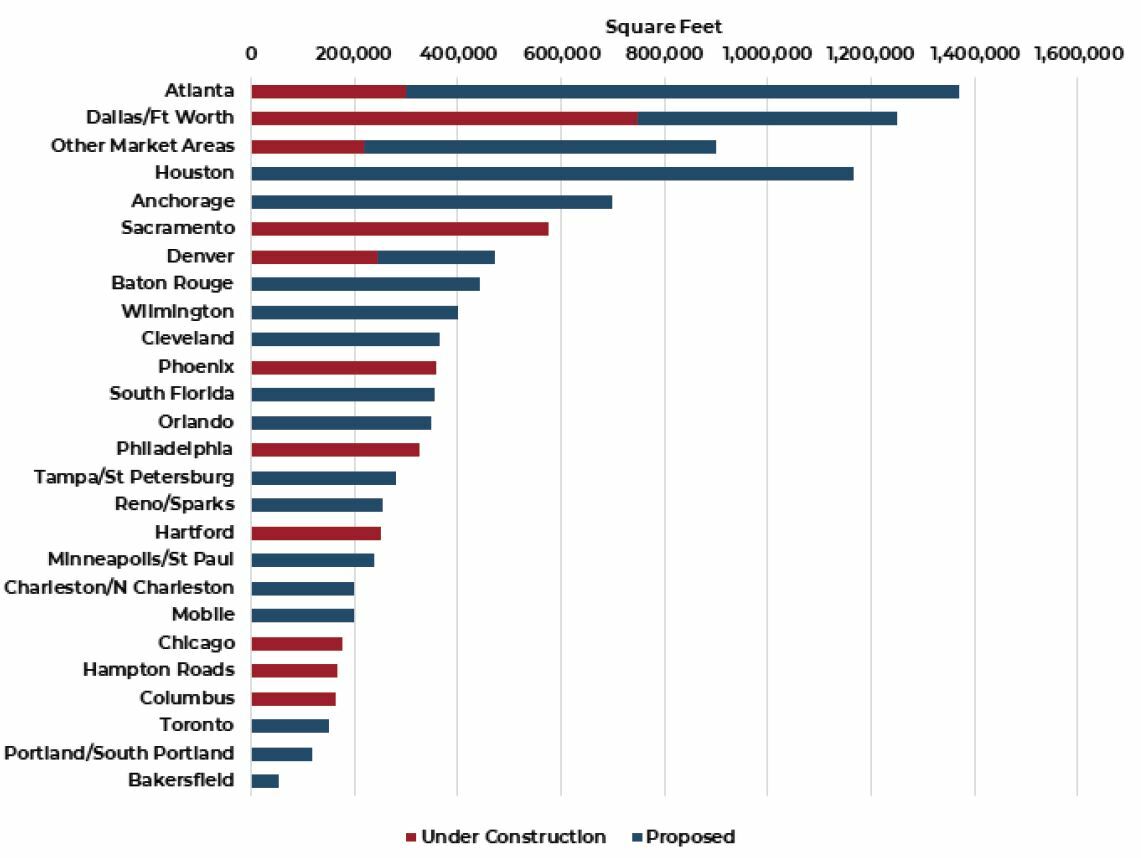
Currently, CoStar is tracking 45 cold storage development projects across the United States totaling 11.2 million square feet. Of this, 3.5 million square feet are currently under construction with 7.7 million square feet categorized as proposed.
FIGURE 10: GEOGRAPHIC DISTRIBUTION OF CURRENT COLD STORAGE SUPPLY PIPELINE
Source: CoStar
Cold Storage Transaction Market
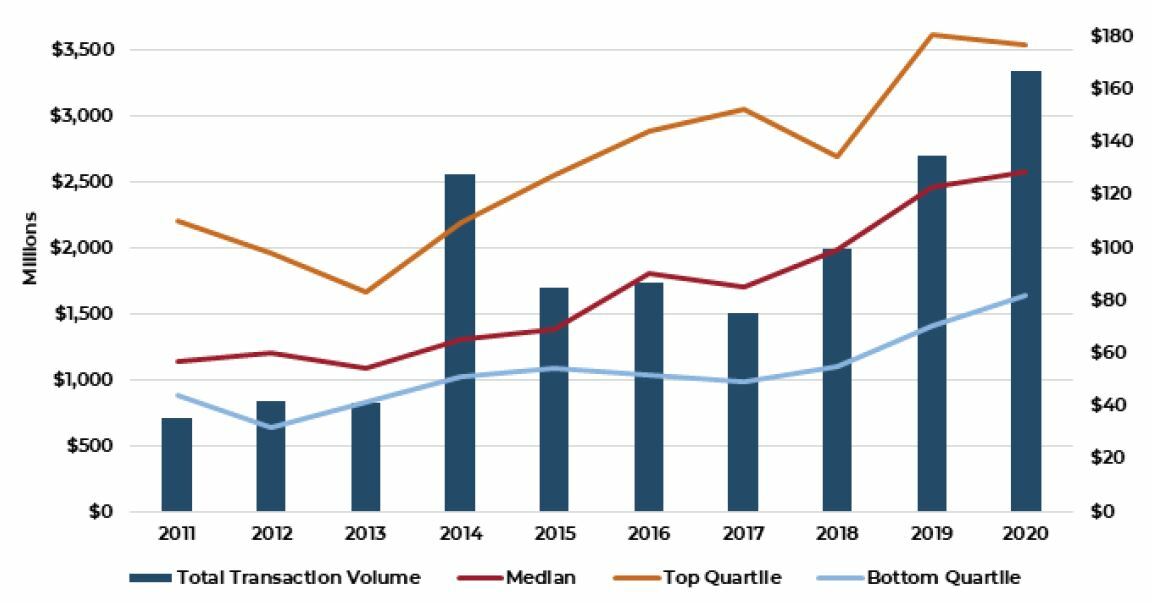
The total transaction volume for cold storage properties has grown steadily in recent years rising from slightly less than one billion dollars per year in the earlier part of the past decade to nearly $3.5 billion during 2020, despite the global pandemic. More significantly, the average price per square foot of properties that traded have also risen steadily with top quartile properties in 2020 commanding more than $180 per foot.
FIGURE 11: TOTAL TRANSACTION VOLUME FOR U.S. REFRIGERATED WAREHOUSES AND PRICE PER SQUARE FOOT
Source: Real Capital Analytics (RCA)
Not surprisingly, the transaction market for cold storage properties in the U.S. has been dominated by the two largest refrigerated warehouse companies, Bay Grove Capital (Lineage) and Americold Realty Trust with both organizations acquiring more than $1 billion of property over the past 24 months.
FIGURE 12: MOST ACTIVE BUYERS OF U.S. REFRIGERATED WAREHOUSES OVER PAST 24 MONTHS ($ Millions)
Sources: Real Capital Analytics (RCA), AEW Research
Pricing for cold storage properties, like industrial properties in general, has experienced compressing yields (capitalization rates) over the past decade. For cold storage properties specifically, there has been significant compression of yields in an absolute sense and as a spread to industrial properties in total. Figure 11 illustrates this compression showing the average yield of properties tracked by both CBRE and RCA compared with the stabilized carrying value yield of institutionally owned industrial properties in the NCREIF property index. While this spread has narrowed from approximately 250 basis points five years ago to 150 basis points today, we expect the spread to narrow even further going forward as top quartile industrial property transactions continue to set new milestones for compressing yields.
FIGURE 13: COLD STORAGE AND INDUSTIRAL CAP RATES

Source: CBRE, RCA, NCREIF
Conclusion
Cold Storage is a relatively small but vital component of the global supply chain servicing the growing and evolving demand for products requiring various degrees of temperature control. To date, much of this demand stems from a growing consumer appetite for fresh and perishable food products but also from rapid development of new and more temperature sensitive pharmaceutical and biomedical products as well as a variety of specialty niches such as fresh flower, candles, artwork and electronics. The stock of refrigerated warehouses in the U.S. is relatively old and the higher development cost of building new cold facilities discourages speculative development. As such, the growth in the cold stock typically lags growth in industrial properties generally resulting in lower structural vacancy in the cold segment. Ownership of the existing cold storage inventory is fragmented with two large third party logistics operators dominating the public warehouse portion of the market with little concentration in the private warehouse segment. We believe there exists a significant near-term and long-term opportunity to acquire and update existing properties as well as develop true state of the art facilities to service a growing tenant base with limited location options.
1 Physical Security for Cold Storage Locations. CISA Insights. December 2020. U.S. Cybersecurity & Infrastructure Security. https://www.cisa.gov/sites/def...
2 See, for example, “Capacity of Refrigerated Warehouses 2019 Summary”. January 2020. United States Department of Agriculture. ISSN: 1949-1636. https://downloads.usda.library...
3 Note, ceiling height is not reported for all properties in the dataset used. Modern cold storage properties with ceiling heights greater than 100 feet exist though are not representative of the broader universe. The largest cold storage property in the U.S., 2800 Polar Way in Washington state, is reported to have a ceiling height of 120 feet (see https://www.tricitiesbusinessnews.com/2019/04/preferred-freezer-facility/)
4 Renner, Barb, Baker Brian, Cook, Justin and Mellinger, Josh. “The Future of Fresh, Patterns from the pandemic”. Deloitte Insights. October 13, 2020.
5 This component of fresh food demand could reverse if consumers revert to pre-pandemic shopping habits.
6 e-Grocery’s New Reality – The Pandemic’s Lasting Impact on U.S. Grocery Shopper Behavior”. Mercatus/INCISIV. September 2020.
This material is intended for information purposes only and does not constitute investment advice or a recommendation. The information and opinions contained in the material have been compiled or arrived at based upon information obtained from sources believed to be reliable, but we do not guarantee its accuracy, completeness or fairness. Opinions expressed reflect prevailing market conditions and are subject to change. Neither this material, nor any of its contents, may be used for any purpose without the consent and knowledge of AEW.
