Throughout human history, housing has been regarded as so important as to be indispensable, largely as protection from the elements as well as from predators. Until relatively recently, housing represented not just indispensable shelter but, in many cases, the locus of household economic activity as well. It is only with the advent of the industrial revolution and the great shift from agrarian to urban-centered production that housing lost its claim as the fundamental workplace. Even now, this dynamic ebbs and flows. Following the Great Financial Crisis in 2012, some major tech companies began to call back remote workers to the home office. Conversely, during the Covid-19 pandemic many workers were forced to work from home or other remote locations.
Where we live defines us in many ways. Where we live typically dictates where we vote and where our children go to school. Where we live also often defines where we might reasonably be able to work, shop, recreate and receive medical care. Former Secretary of State Condoleezza Rice famously observed that if all that was known about you was the zip code where you live, a reasonable projection could be created of the opportunity and success that you would likely have over your lifetime.
Economists and other researchers have long recognized the link between where we live and our success along various important dimensions. In 1994, for example, the National Bureau of Economic Research (NBER) and the U.S. Department of Housing and Urban Development (HUD) launched the Moving to Opportunity (MTO) program whereby low-income families with children living in public housing within some of the most disadvantaged urban neighborhoods in the nation were provided the opportunity to move to private-market housing in much less distressed communities. Longitudinal observation of these families revealed that moving from a lower-poverty neighborhood significantly improves college attendance rates and earnings for children who were young when their families moved and that these children were much more likely to live in better neighborhoods themselves as adults.1
In the United States today, and for quite many years, a structural supply and demand imbalance exists in a large segment of the nation’s housing market, limiting where a large proportion of people are able to live. Specifically, the stock of housing that is affordable to households with incomes below the median for their market (which by definition is 50% of the entire base of households for a market) is typically insufficient relative to the absolute size of this group of households, and this is true in nearly every metropolitan area in the country.
While this structural imbalance exists in both the for sale and for rent segments of the market, it is particularly pervasive in the rental market as these households are truly renters by necessity and have little recourse when faced with limited affordable options. This structural imbalance represents a particularly pernicious form of market failure that endures despite the actions of various actors, agents, and arbitrageurs to reduce or eliminate it. This segment of the rental market sends all the right signals from a property investment standpoint – high and stable occupancy rates, rents that typically grow above inflation and property cash flows that are naturally durable through cycles. Despite the attractive cash flow and return characteristics of this segment of the rental market, when institutional capital comes into this segment of the market, it largely works to move units from the current affordable rental price point to some higher level through value-add strategies.
Walter Wriston, the former CEO of Citibank, was found to note that “capital goes where it is welcome and stays where it is well treated” and long-term, patient capital should be drawn to the market segment we have described, the segment that we refer to as Essential Housing2, the segment of the rental housing market that is affordable to households with low to moderate household income. Instead, the capital formed around this housing stock has largely acted to remove units from inventory, renovate them, and return them to the market at higher rental rents, thereby displacing tenants. Ironically, these actions work to further enhance the fundamental investment-level characteristics of this segment by constraining supply.
America’s Housing Affordability Problem
Measuring the affordability of any good or service is a complicated exercise of balancing the cost of that good or service with the income of the person or group that is seeking to purchase it. Something can be unaffordable because the cost is too high (even with high relative incomes) or because incomes are too low despite low relative cost. Since 1981, the U.S. Department of Housing and Urban Development (HUD) has broadly defined housing to be affordable when the cost accounts for 30% or less of household income. A household that spends more than 30% of its income on housing is described as housing cost burdened while a household spending more than 50% of income on housing is regarded as extremely housing cost burdened.3 As a greater share of household income is devoted to housing costs, a declining share is available for other essential items such as food, clothing, transportation, education and medical care.
Harvard’s Joint Center for Housing Studies estimates that nearly one half of all U.S. renter households are housing cost burdened to some degree.4 On average this share rises to nearly 60% of low-to moderate-income households and is typically more than 80% of extremely low-income households.5
Geographically, every metropolitan area in the country has a shortage of affordable housing stock, but the shortage is particularly acute in most of the nation’s higher barrier to entry markets as well as select other geographies where the share of the rental population that is cost burdened is typically well over 50%. Approaching this from a different angle, the National Low-Income Housing Coalition (NLIHC) estimates that there exist only 60 affordable rental housing units for every 100 renter households with incomes at 50% of their area’s median income.6 The NLIHC estimates that this shortfall ranges from only 37 units per 100 households for extremely low-income households to 94 units per 100 moderate income households.7
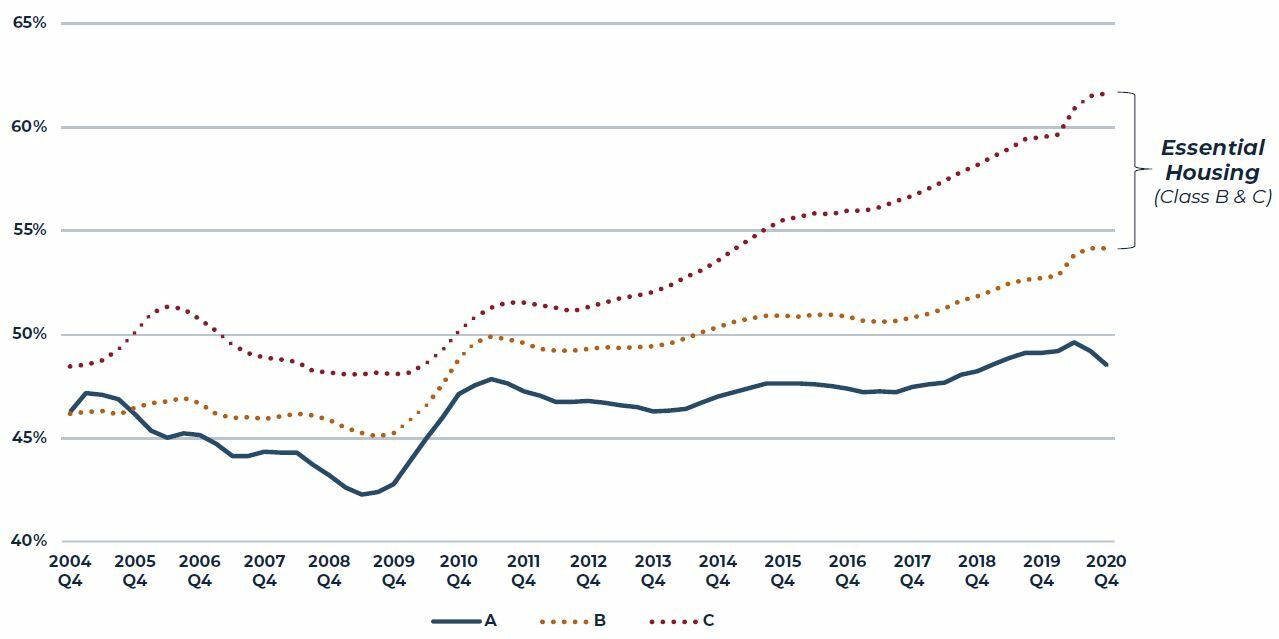
Figure 1: Percent of Renter Households that are Cost Burdened
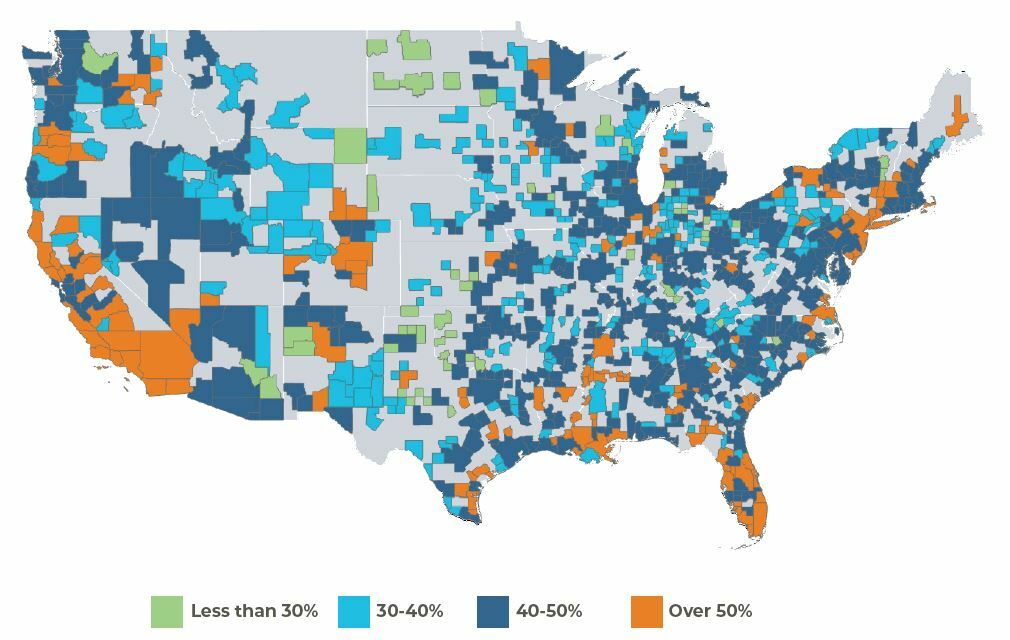
Source: AEW Research, Joint Center for Housing Studies of Harvard University
Who are the Essential Housing Tenants?
The renters living in essential housing today are largely representative of the breadth and depth of the 21st century American work force, people we all know and see every day. They might include people working in construction, retail trade, food service, hospitality, first responders, teachers, healthcare workers, transportation & warehousing, etc. Many of these workers, who are now, somewhat ironically, often categorized as “essential” workers, often face a pronounced lack of affordable housing choices available to them. These essential workers tend to be housing cost burdened, with disproportionately higher income shares dedicated towards housing as shown in Table 1 below. Like any tenant base in any property market, these residents will have varying tastes and preferences for where and how they prefer to live. Some will place greater importance on the quality of the schools that serve a specific location while others may prefer greater access to public transportation. Some may be looking for closer proximity to employment centers and some may prefer better access to retail nodes or health care. Again, the limiting factor in nearly all cases will be the prevalence of units that are affordable to their income.
Table 1: Median Income for Select Occupations and Metropolitan Areas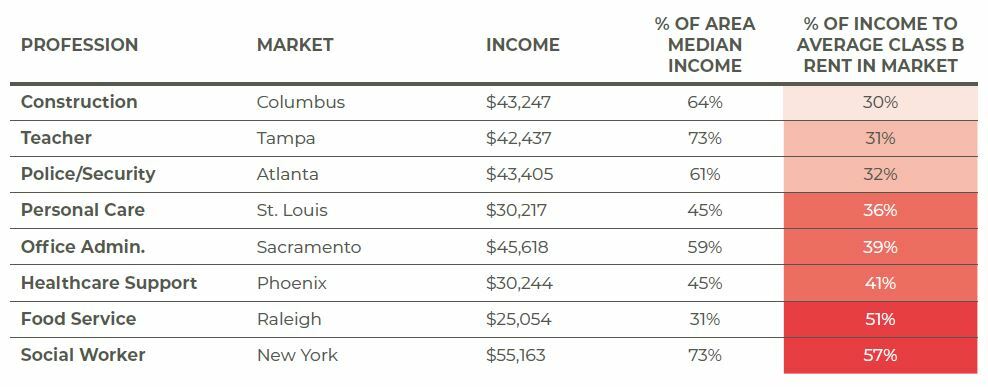
Source: AEW Research, CoStar, American Community Survey (Census)
Understanding the Structural Supply and Demand Imbalance
Rental residential properties (most commonly multifamily apartments, but also single-family homes for rent and other residential types) are typically stratified by qualification systems based on various measures of quality or attractiveness. The most frequently used metrics in such systems revolve around identifiers such as cost (e.g. monthly rental cost) and quality (e.g. age, amenities, location, etc.). Like most ranking systems, apartment properties are usually assigned either a certain star rating or a specific class rating. In general, properties rated Class A are broadly comparable to properties rated 4&5 Stars, Class B largely equates to 3 Star and Class C approximates 1&2 Star ratings.
Reflecting the vagaries of residential property development across the United States broadly as well as myriad market specific issues, capital investment in new residential property development disproportionately skews towards higher rent and higher classification rating properties. At the most basic level, land procurement and physical construction costs are largely comparable regardless of the quality or rent level of the property being constructed. Adding to the high cost of construction, local requirements layer on additional costs regardless of targeted rents such as developer set asides, zoning complexities, traffic and parking restrictions, etc. all add to the cost structure. Given the similar cost basis and development risks associated with delivering any building, a higher return on investment basis will almost always be associated with higher targeted rental rate properties. As a result, nearly all new apartment development in most markets is found in the Class A (4&5 Star) segment of the market.
Figure 2: Year-Over-Year Growth in U.S. Apartment Property Stock and Share of Stock that is Class A
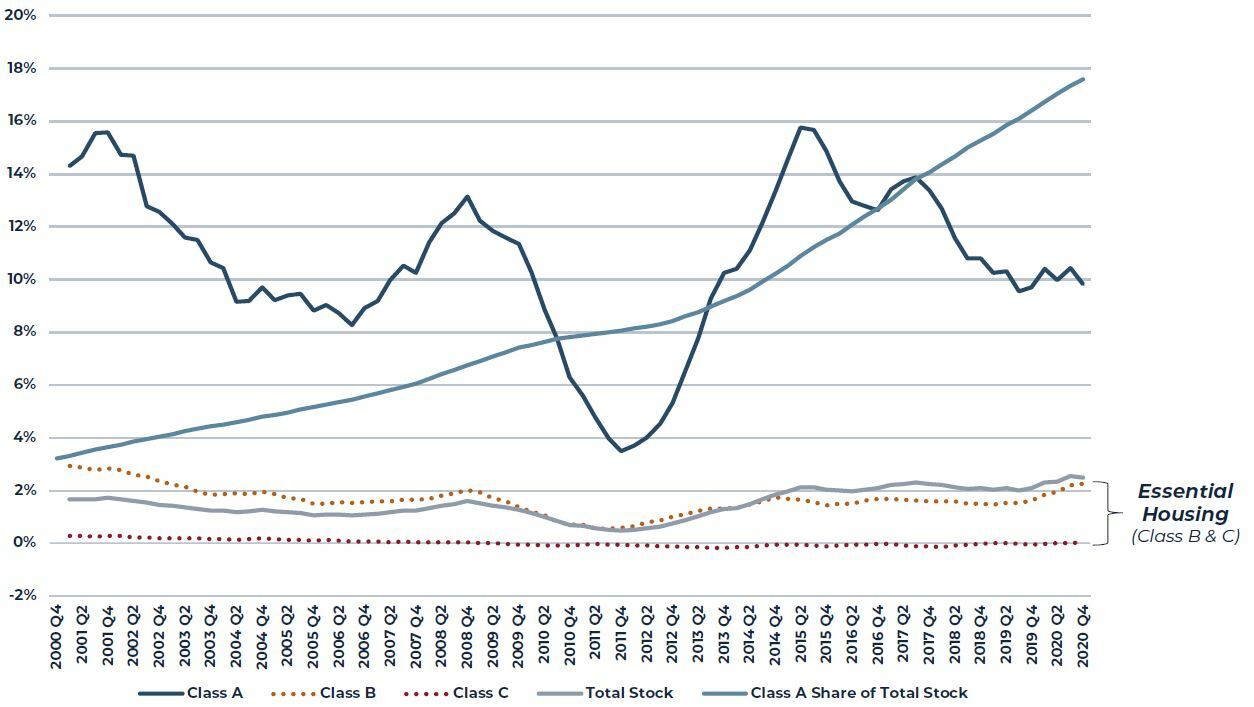
Source: CoStar
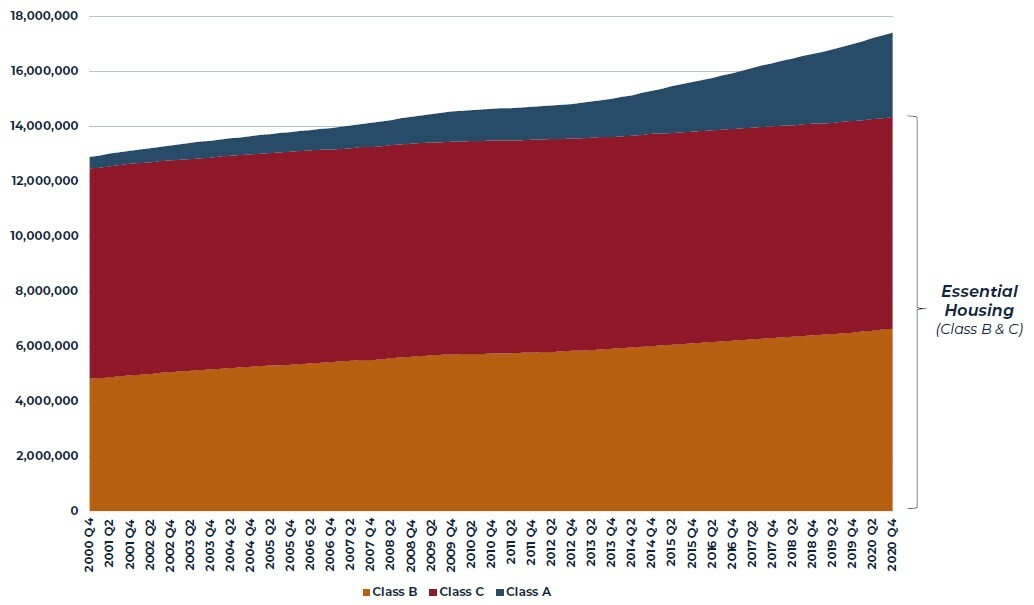
In contrast, the lowest rent/lowest quality tier of the market experiences little or no growth in stock and, in many years, the stock may actually shrink through physical depreciation/obsolescence or, in many cases, through demolition/redevelopment to create a property that commands higher rent. Reflecting this, the total apartment stock in the United States typically grows only modestly, perhaps 2% per year or less, as the very large lower tier segments of the market record even slower growth, while the relatively small Class A segment grows far more rapidly. As a result, the share of the entire market that is found in the highest rent/quality segments grows continuously, putting ever greater pressure on moderate to lower income households to find adequate affordable rental housing. Indeed, the chart below quantifies the gap, comparing the total inventory of B and C quality apartment units to the absolute size of below median income renters. This gap varies over time but has averaged between 7-8 million units in recent years.
Figure 3: Total B & C Apartment Inventory (Units) and Total Below Median Income Renter Households (000s)8
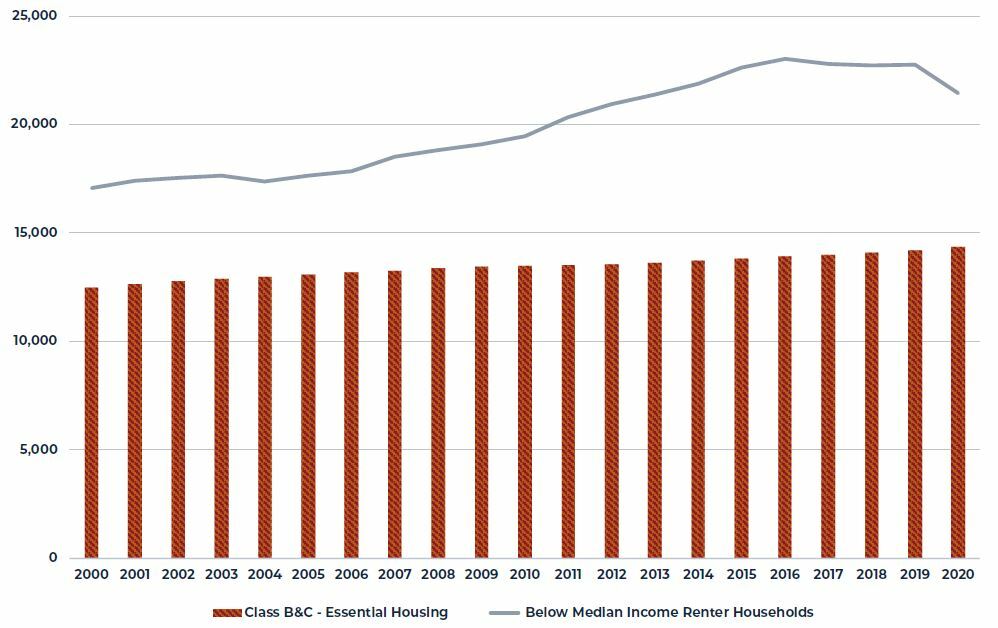
Source: CoStar, Census, AEW Research
Occupancy and Cash Flow Characteristics of Essential Housing
Given the structural shortfall of rental unit inventory of 7-8 million units illustrated above, it is not surprising that the average occupancy rate in the essential market segment is more stable and higher than the occupancy rate for the market segment that receives nearly all new supply, the Class A segment. Simply stated, units stay occupied because there are not enough units.
Figure 4: Average Apartment Occupancy Rate by Class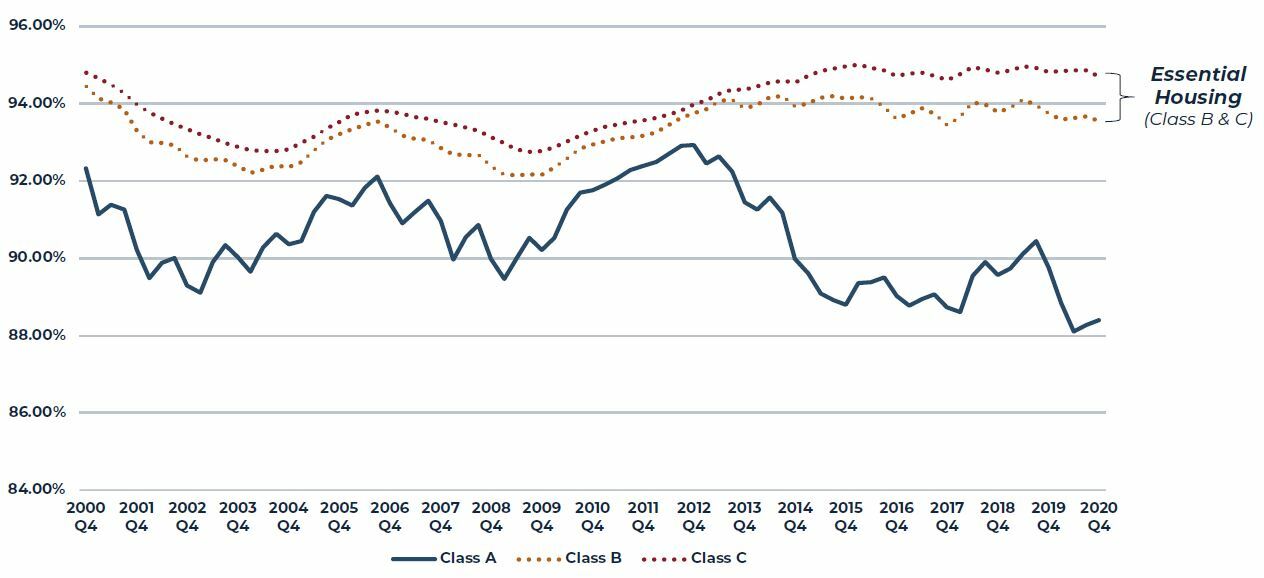
Source: CoStar
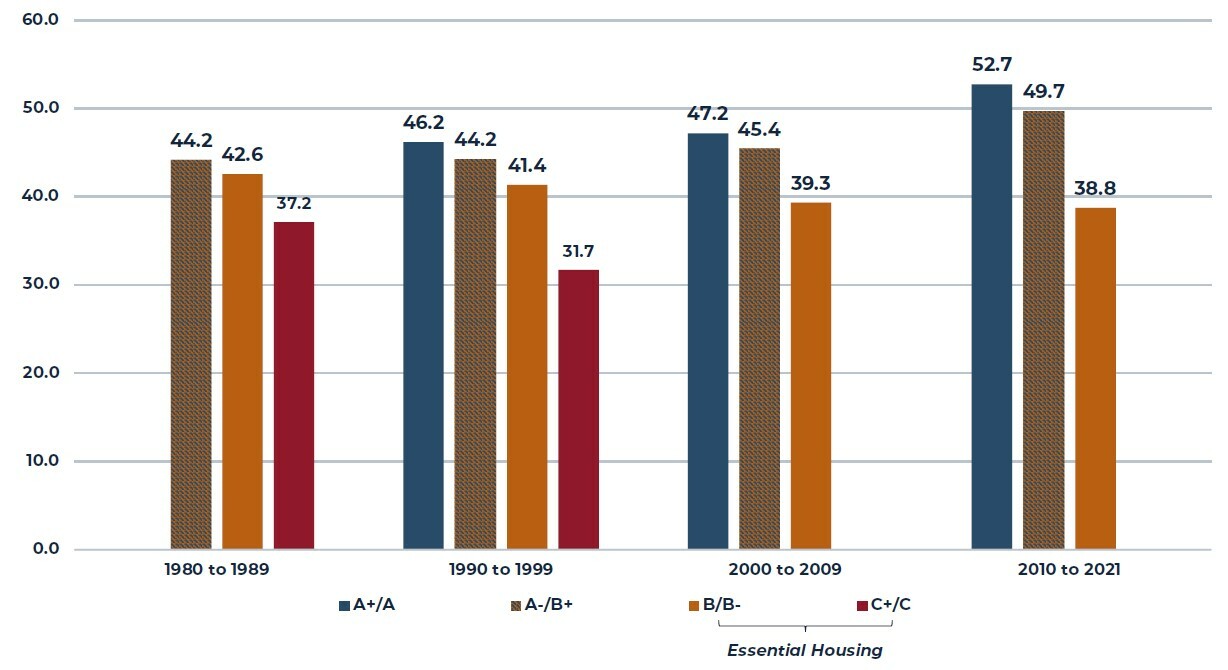
Not surprisingly, essential housing’s higher occupancy rate is directly related to significantly lower turnover rates in low tier segments of the market as compared with the highest rated segments. Interestingly, the pattern of higher turnover rates in higher tier properties shown in Figure 5 is also observed even as the properties are stratified by age of property. While the range is somewhat narrower, there remains a distinctly higher turnover rate in the highest rated properties relative to the lower categories (Figure 6). The typical Class A renter has many more options to consider at renewal (with new options regularly entering the market) as well as a rent versus own decision that is rarely an option for the renter by necessity tenant at the lower tier properties. Essential housing’s lower turnover rates benefit property cash flow in ways beyond simply maintaining occupancy as each tenant turnover is typically associated with some degree of maintenance or capital expense (e.g. repairs, painting, replacing rugs, appliances) as well as leasing costs, downtime, etc.
Figure 5: 2020 Apartment Turnover Rate by Property Class (%)
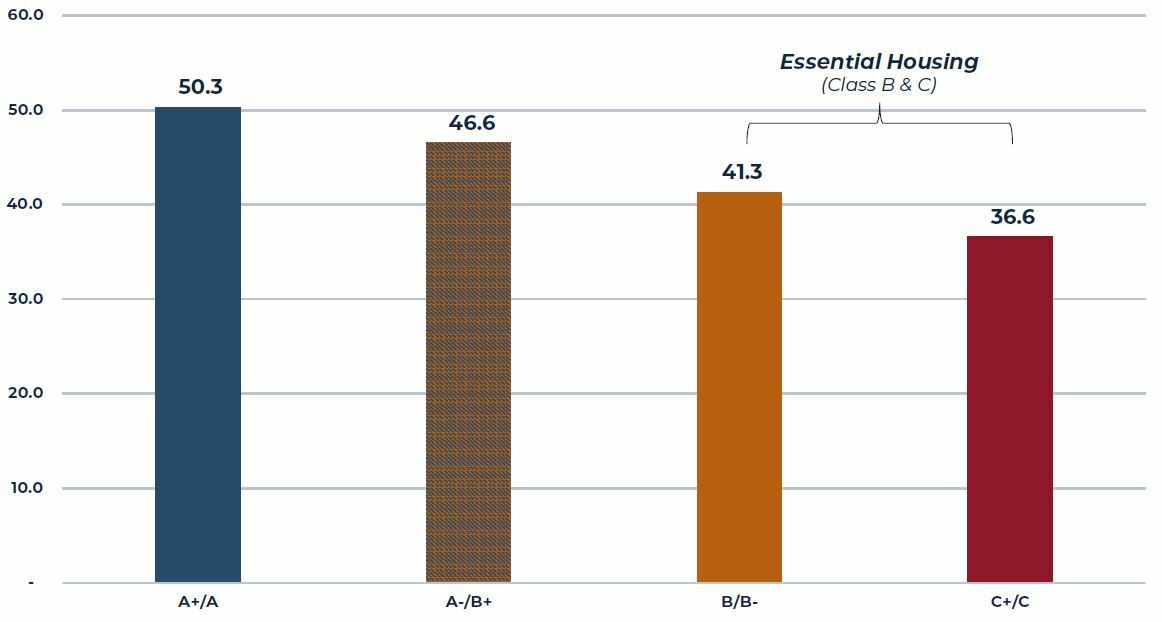
Source: Yardi
Figure 6: Average Apartment Turnover During 2020 by Property Class and Decade Built (%)9
 Source: Yardi
Figure 7: Renewal Conversion Rate by Property Class (Four Quarter Moving Average)
Source: RealPage
Reflecting both the higher average structural occupancy rates and lower average turnover rates, it is perhaps also not surprising that the growth in average rental rates has been consistently higher for essential housing (in Class B and Class C properties) compared with Class A. This difference is particularly acute in the current pandemic period where the average Class A rent has fallen sharply as these tenants with more options clearly exercised them.
Figure 8: Year-Over-Year Growth in Effective Rent by Property Class
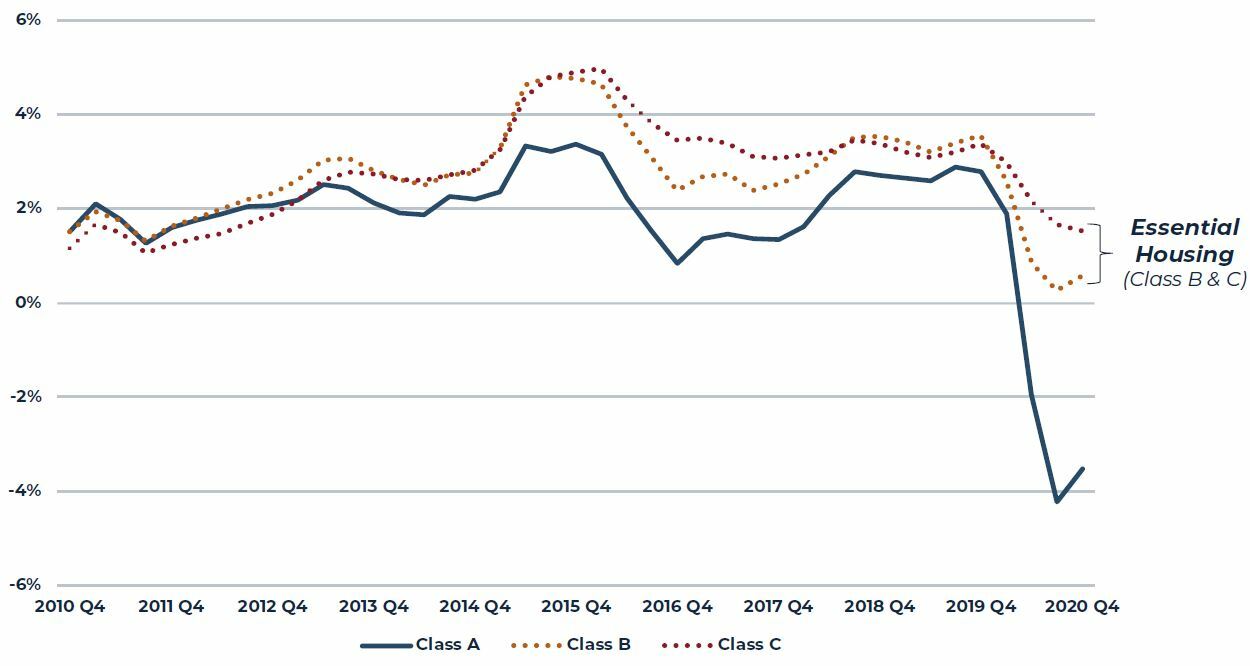
Source: CoStar
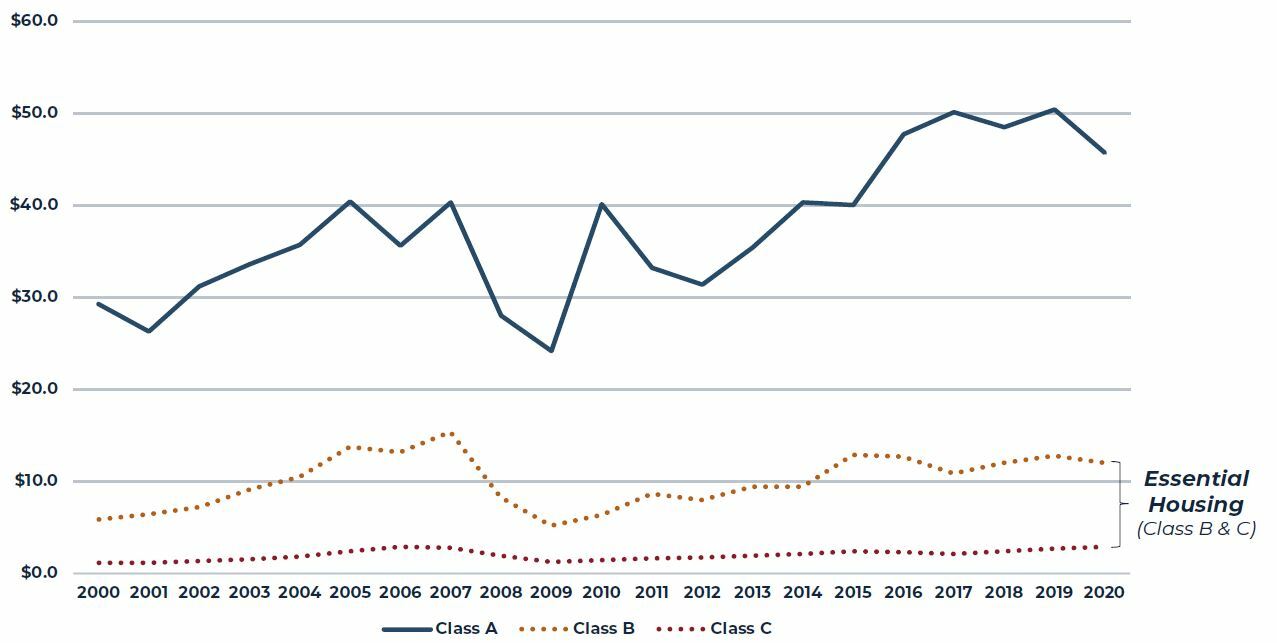
We have found that revenue per available unit (i.e. unit revenue adjusted for occupancy) correlates well with changes in NOI and, as shown in Figure 9, reveals a very similar pattern as the differences in rent movements between the various property classes, but with even more variability for Class A apartments stemming from greater variability in Class A occupancy rates. Putting all of this together suggests that investors could expect both higher and more stable NOI growth in essential housing (Class B and Class C apartment properties) over a cycle compared with Class A properties.
Figure 9: Year-Over-Year Growth in Revenue Per Available Unit by Property Class
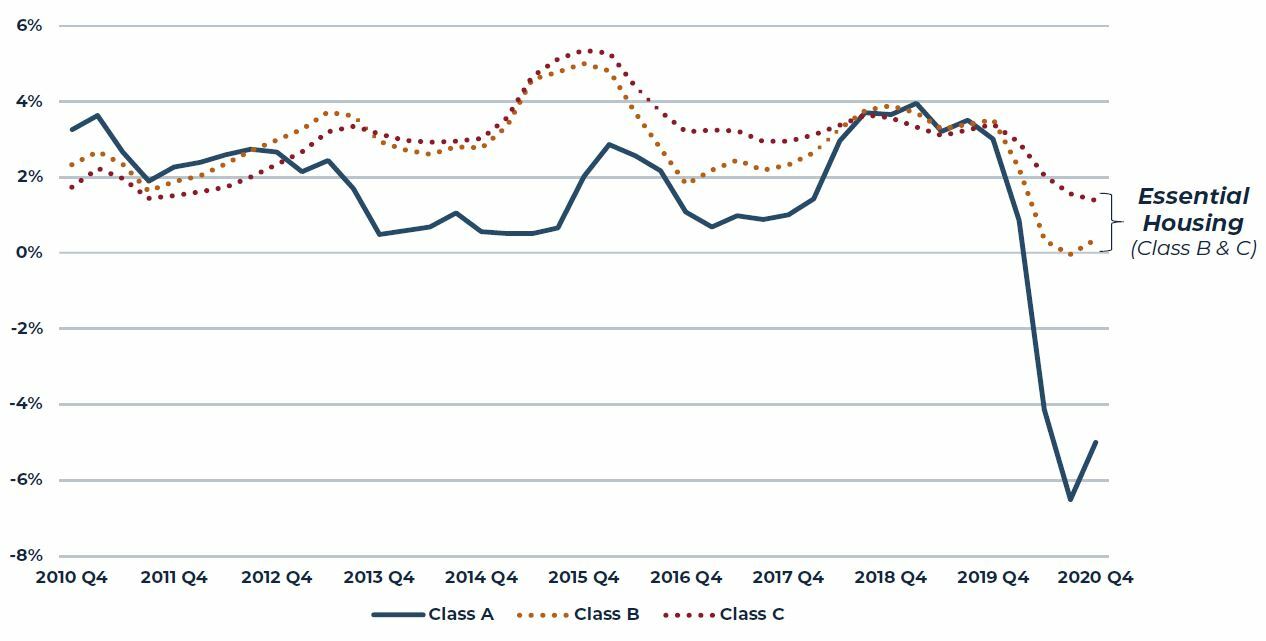
Source: CoStar
Size of Market Segments and Relative Liquidity
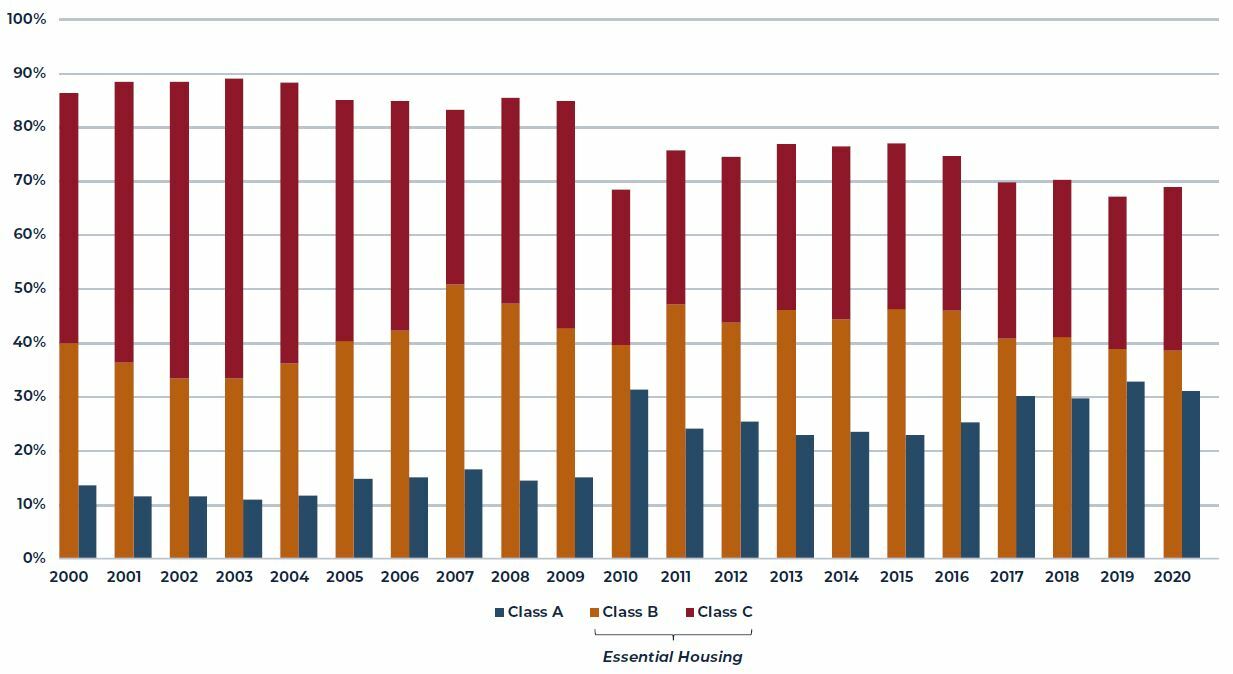
In aggregate, there are more than 40 million rented residential units in the United States today. While the Class A segment of the apartment market is the fastest growing, this segment still accounts for less than 20% of the entire competitive apartment market with essential housing representing 80% (Class B and Class C representing 38% and 44% respectively).
Figure 10: U.S. Apartment Stock by Property Class Rating
Source: CoStar
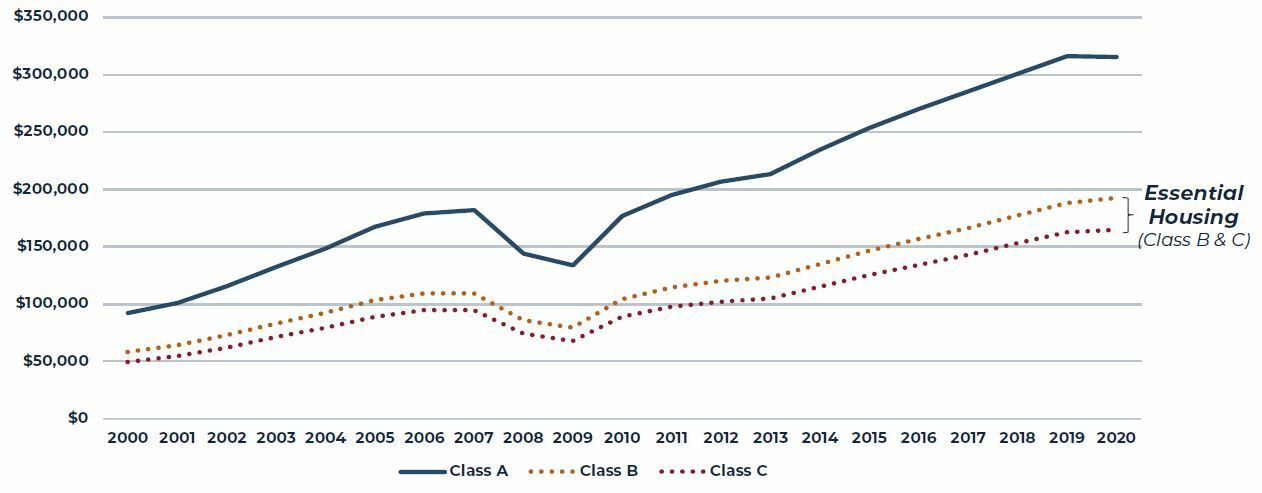
The dollar value of the 17.5 million units tracked by Costar is estimated to be roughly $3.5 trillion or approximately $200,000 per unit. The average value of these apartments varies considerably by property quality category with the average Class A unit estimate above $300,000 per unit with the average Class B and Class C units valued slightly below $200,000 per unit and slightly above $160,000 per unit respectively.
Figure 11: Estimated Total Asset Value by Apartment Property Class ($ Billions)
Source: CoStar
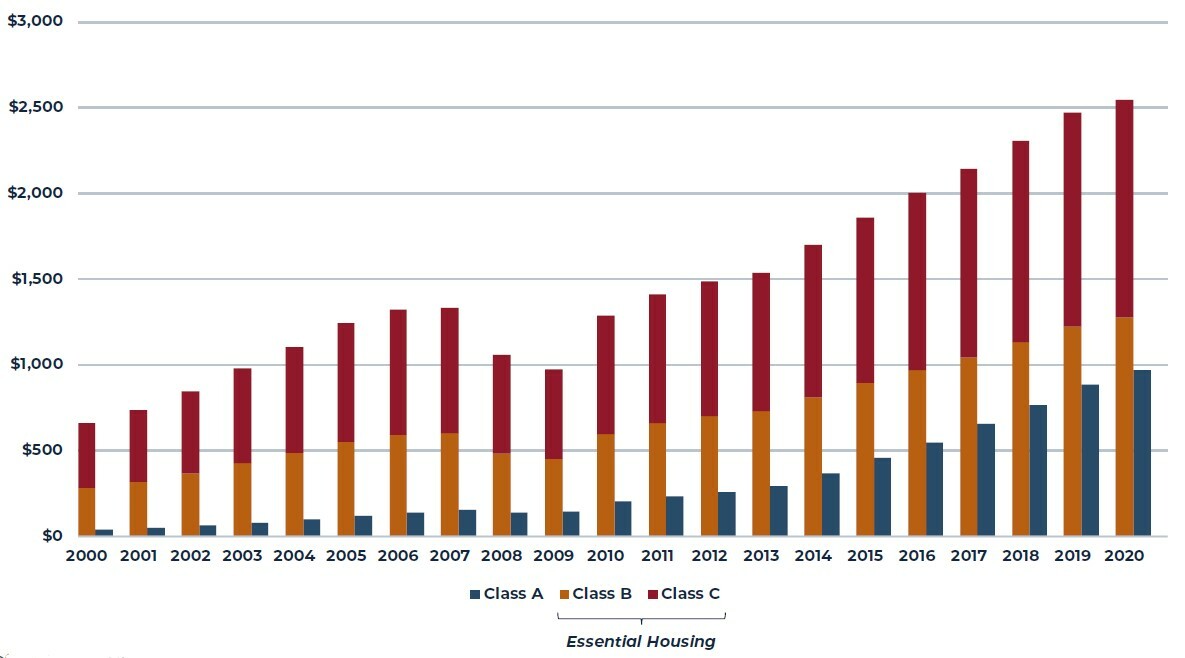
In aggregate, the dollar value of the essential housing segment of the apartment total is approximately $2.5 trillion or 2.5x the estimated $1 trillion value of the Class A segment.
Figure 12: Estimated Total Asset Value by Apartment Property Class ($ Billions)
 Source: CoStar
The U.S. apartment transaction market is an extremely large and liquid market with nearly two trillion dollars of aggregate transactions over the past 20 years.10 This is particularly true of the past decade and more significantly over the past five years where aggregate apartment transactions have averaged $134 billion per year 2010 to 2020 and $165 billion per year to 2015 to 2020.
Figure 13: Annual Apartment Property Transaction Volume (Billions)

Source: Real Capital Analytics (RCA)
Figure 14: Share of Annual Apartment Transaction Volume by Apartment Property Class
 Source: CoStar
With respect to deal size and pricing, there exist significant differences across the various apartment property quality categories. In general, Class A properties trade in much larger dollar value trades and at significantly lower capitalization rates when compared with essential housing properties. In recent years, Class A property transactions have averaged approximately $50 million per trade compared with slightly more than $10 million for Class B properties. Given the much larger aggregate dollar value of transactions by property category, this means that many more lower tier properties trade in any given period relative to higher tier segments.
Figure 15: Average Deal Size by Apartment Property Class ($ Millions)
Source: CoStar
Finally, it is important to note that essential housing apartment properties typically trade at initial yields (capitalization rates) significantly above the yields of Class A properties. Essential housing yields tend to be relatively comparable in recent years with average premiums of as much as 100 basis points above the yields of Class A properties that have traded. There are also significant differences by geographic market as well, with larger gateway markets having lower cap rates than the national average.
Figure 16: Average Transaction Cap Rate by Apartment Property Class
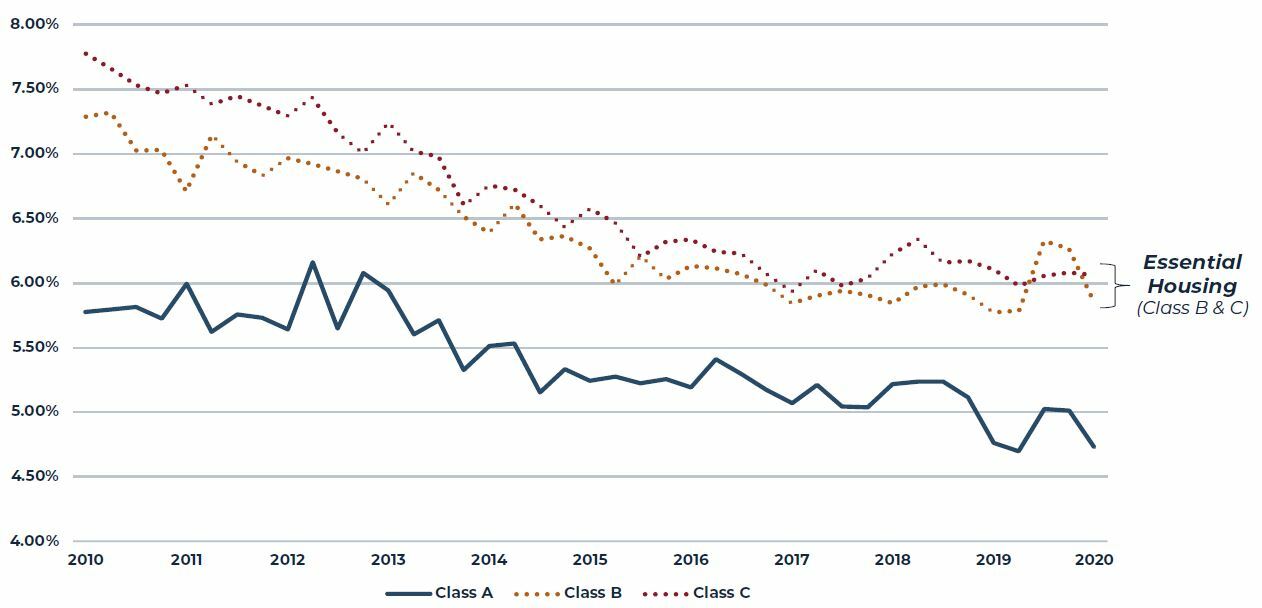
Source: CoStar
Essential Housing is Especially Well-Suited to Moderate Financial Leverage
Commercial property assets are fundamentally hybrid financial assets comprising a combination of fixed income and equity characteristics. In the simplest form, the fixed income qualities originate in the leases encumbering the property – periodic payments to the owner of the property backed by the underlying credit of the lessee – while the equity characteristics flow from the right to re-lease or sell the property now or in the future. This inherent combination of fixed income and equity is one of the factors contributing to the lower relative return volatility often enjoyed by property investors as the debt and equity components diversify each other and does much to explain why unleveraged property investment returns often fall somewhere between debt and equity returns over longer periods.
Adding leverage (financial gearing) to the capital structure of property is a form of shorting some of the fixed income exposure and increasing the portion of total return that will flow from the equity component. This both raises expected total return and potentially return volatility as well. When borrowing costs are below the current income yield, financial leverage also raises the asset’s current yield. Properties with high and stable cash flow (e.g. apartment properties with high and stable occupancy rates) are better suited for financial leverage than properties with more erratic cash flow (e.g. hotels). In other words, Essential Housing properties are particularly well-suited for financial leverage.
Figure 17: Yield Impact of 50% LoAN to Value Leverage on Apartment Yields
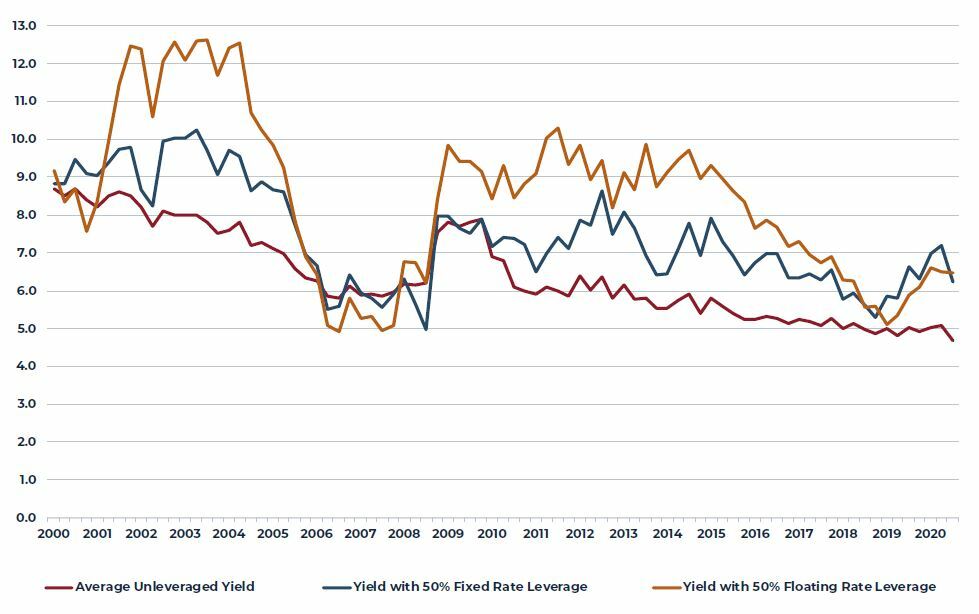
Sources: American Council of Life Insurers (ACLI), NCREIF, AEW Research
Given the operating performance characteristics of apartment properties generally and the prevalence of lenders unique to residential properties (e.g. agency financing), it is again not surprising that a higher share of apartment properties in the NCREIF universe use leverage compared with other property types. As of year-end 2020, nearly 70% of the apartment properties in the NCREIF Property Index were levered compared to roughly 50% of the office and retail properties and only a quarter of the industrial properties. Similarly, institutional investors tend to employ slightly more leverage in their apartment investments, typically 50% loan-to-value as compared to roughly 40% for other property types.
Figure 18: Share of Properties in the NCREIF Property Index with Leverage by Property Type
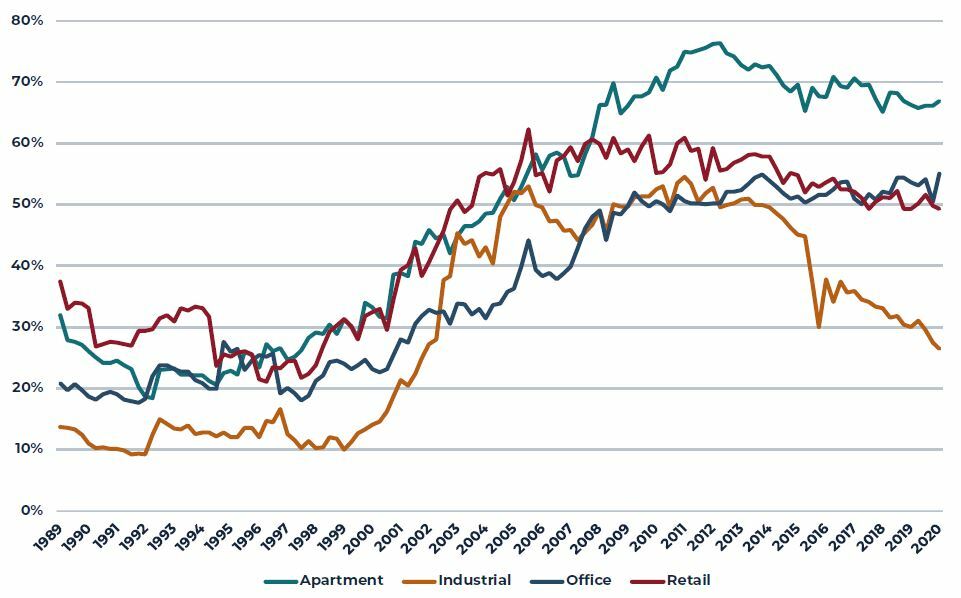
Source: NCREIF, AEW Research
Figure 19: Average Loan to Value Ratio of Properties in the NCREIF Property Index Using Leverage

Source: NCREIF, AEW Research
Conclusion
The U.S. residential housing market is one of the largest and most liquid asset markets in the world and for-rent apartment property investment has long been a key component of most investors’ core real estate portfolio. The largest and most liquid segment of the investable apartment market, the portion where most renters-by-necessity live, has been largely overlooked by most institutional investors. This segment of the market, the segment we refer to as Essential Housing, largely services the lower to moderate income workers in America, families and households that typically have few quality housing choices that they can afford in the locations where they would like to live. The cash flow and return characteristics of this segment of the rental market are highly attractive to long-term, income-focused investors yet when institutional capital comes into this segment of the market, it largely works to move units from the current affordable rental price point to some higher level. The structural supply and demand imbalance that persists in the Essential Housing market leads directly to lower turnover rates among tenants, higher average occupancy rates and less volatile rental rate growth as compared with the higher rent, highly amenitized class A segment of the market, that historically garners the disproportionate share of institutional investment capital and virtually all new supply. We believe that properly aligned investors seeking higher and more stable income and cash yields would be well served by portfolio exposure to the Essential Housing segment of the nation’s apartment market.
1 Chetty, Raj, Hendren, Nathaniel and Katz, Lawrence F. The Effects of Exposure to Better Neighborhoods on Children: New Evidence from the Moving to Opportunity Experiment. NBER Working Paper No. 21156 May 2015.
2 Broadly, we use the term “Essential Housing” to mean housing that is affordable for low to moderate income households. Typically, this includes households with incomes between 50% and 80% of the area median income.
3 The National Housing Act of 1937 established, among other things, the first federal public housing program, specifically for the “families in the lowest income group”. This program introduced the concept of establishing income limits to qualify for living in public housing rather than maximum rents. At that time, family income could not exceed five to six times the rent being charged. In 1969, the Brooke Amendment to the 1968 Housing and Urban Development Act formally established a rent threshold of 25% of household income. Congress raised the limit to 30% in 1981.
4 The State of the Nation’s Housing 2020. Joint Center for Housing Studies of Harvard University.
5 The State of the Nation’s Housing 2020. Joint Center for Housing Studies of Harvard University.
6 The Gap. A Shortage of Affordable Homes. March 2021. National Low-Income Housing Coalition.
7 Per the NLIHC: Area Median Income (AMI): The median household income in the metropolitan area.
Extremely Low-Income: Households with incomes at or below the poverty level or 30% of AMI, whichever is higher. Very Low-Income: Households with incomes between ELI and 50% of AMI. Low-Income: Households with incomes between 50% and 80% of AMI. Moderate-Income (MI): Households with incomes between 80% and 100% of AMI. Cost Burdened: Households than spend more than 30% of their income on housing costs. Severely Cost Burdened: Households that spend more than 50% of their income on housing costs.
8 The estimate of below median renter households was derived by calculating one half (i.e. below median) of the total number of renter households from Census home ownership and household data.
9 There were no properties built between 2010 and 2021 that were classified as Class C. Similarly, there were no properties built between 1980 and 1989 that were classified as Class A+ or A.
10 Real Capital Analytics (RCA)
This material is intended for information purposes only and does not constitute investment advice or a recommendation. The information and opinions contained in the material have been compiled or arrived at based upon information obtained from sources believed to be reliable, but we do not guarantee its accuracy, completeness or fairness. Opinions expressed reflect prevailing market conditions and are subject to change. Neither this material, nor any of its contents, may be used for any purpose without the consent and knowledge of AEW.
