HOME SWEET HOME: THE RESIDENTIAL SECTOR LIES ON SOLID FOUNDATIONS
- European housing markets differ in terms of tenure and regulation. However, the share of households renting in the private sector has been increasing in all markets as a result of rising residential prices and socio-demographic trends.
- Demand has consistently outpaced supply in the main European residential markets. This imbalance results in high occupancy rates, limited void periods between tenants and strong rental growth of 3% per annum since 2014. This translates into stable income streams to investors.
- The residential investment market is no longer a niche sector in Europe. Volumes have increased fivefold since 2008 and the sector now represents 25% of the overall market. Significant differences remain between European markets in terms of liquidity and share of institutional ownership.
- House price growth has been strong at 6% per annum since 2016 overall in the main European markets. With interest rates forecast to remain at historically low levels, house price growth is expecting to continue going forward. This offers capital growth potential to investors.
- With a spread between residential yields and mortgage rates currently standing at 160 bps, a private equity approach to investment in European residential is attractive in comparison to mortgage bonds.
- The residential sector is proving to be among the most resilient in the context of the Covid-19 pandemic. The sector might be negatively impacted by rising unemployment rates but evidence from the European REITs shows that rent collection rates have been close to 100%. In addition, more households will continue to rent as credit conditions have tightened.
- Going forward, demand for housing will continue to outpace supply in the large European cities. Data on building permits indicate a drop in completions in the short-term.
- Prime residential yields are low at around 3.25% on average in Europe but prime high street retail and office yields are only marginally higher. With a risk premium over government bonds currently standing at 250 bps and expected to remain above 200 bps over the next five years, the European residential sector is very attractive on a risk-adjusted basis.
Sources: CBRE, Bloomberg, AEW Research & Strategy
EUROPEAN RESIDENTIAL MARKETS STRUCTURES
PRIVATE RENTED MARKET REPRESENTS 22% OF THE HOUSING STOCK
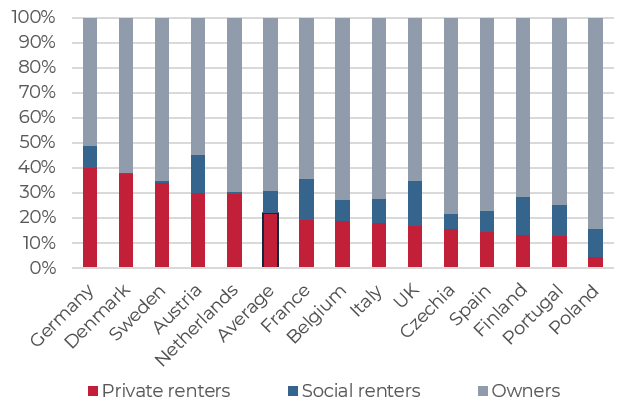
- On average, the private rented market represents 22% of the housing stock in Europe. Owners represent 69% of the market and social renters in the regulated sector 9%.
- However, housing markets across Europe have very different structures in terms of tenure. Overall, Northern European countries tend to have a higher share of households renting in the private sector – this is particularly the case of Germany (40%), Denmark (38%) and Sweden (34%).
- By contrast, Southern and Central European countries have a larger share of households owning their home, notably Poland (84% of owners), Czech Republic (79%) and Spain (77%).
Residential markets by tenure (%)
Sources: Eurostat, AEW Research & Strategy
A LARGER SHARE OF RENTERS IN LARGE CITIES
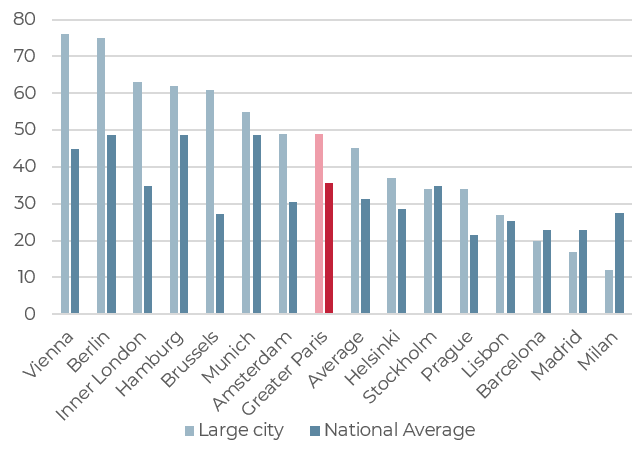
- When looking at the city level, the share of households renting is significantly higher in capital cities (45%) than the national average (34%). The only exceptions are Milan, Madrid, Barcelona and to a lesser extent Stockholm.
- The share of households renting is particularly high in Berlin (75%), even in comparison to the German average at 49%. This explains why there is strong political support for rent regulation in the State of Berlin.
- The largest differences between the capital city and the national average are recorded in Brussels/Belgium, Vienna/Austria and Inner London/UK.
Share of households renting – Large cities vs national averages (%)
Sources: Eurostat, AEW Research & Strategy
INCREASING SHARE OF PRIVATE RENTERS
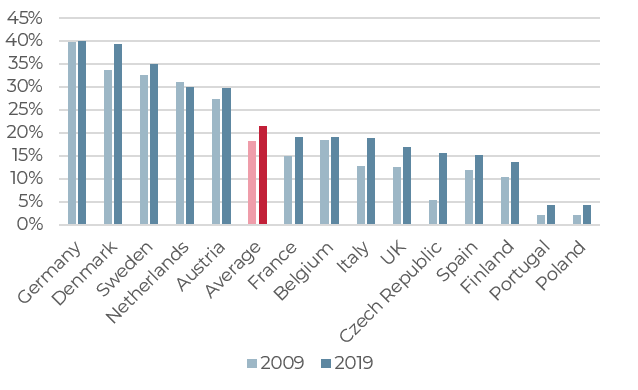
- The share of private renters has increased significantly from 18% to 22% between 2009 and 2019. The largest increases have been recorded in the Czech Republic, Portugal and Poland. The Netherlands is the only exception, where a slight decrease has been recorded since 2009.
- This is due to a number of reasons. Some of them are directly related to the housing and labour markets: rising residential prices preventing tenants to step on the property ladder; an increasing need for mobility and flexibility to access jobs.
- Other reasons are demographic or reflect a change in household preference: a later entry into adult life; more diverse household structures (step/recomposed families); a desire to live closer to amenity-rich city centres and reduce commuting times.
- These are structural trends driving demand for rental solutions in a context where rented properties are increasingly seen as a service.
Evolution of the share of households renting in the private sector (%)
Sources: Eurostat, AEW Research & Strategy
SUPPLY/DEMAND IMBALANCE DRIVES RENTAL GROWTH
DEMAND HAS OUTPACED SUPPLY OVER THE PAST 10 YEARS
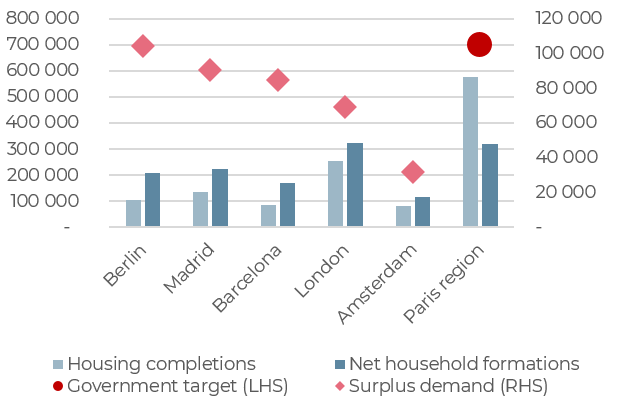
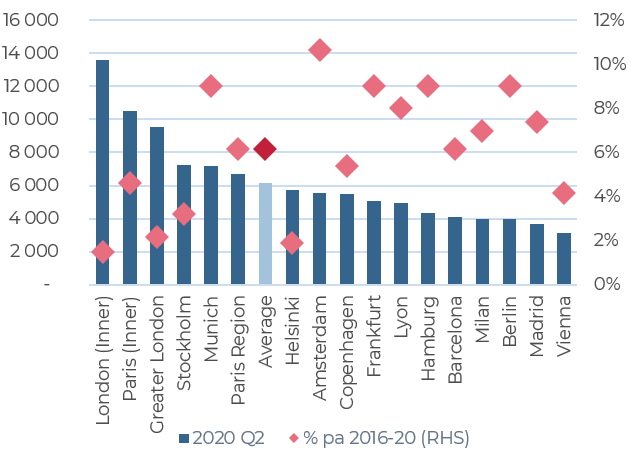
- An analysis of the housing completions and net household formations over the past ten tears highlights the accumulated supply / demand imbalance. The housing shortage in Berlin, Madrid and Barcelona is particularly acute.
- The Paris region stands as an exception. Completions in the Paris region have outpaced household growth since 2010. Construction activity was particularly active in 2017-2019. This is due to state government intervention to incentivise local authorities to build more, notably through urban regeneration projects. However, completions remained insufficient to resorb the accumulated housing shortage - particularly between 2000 and 2009 - and recent reforms will limit future developments.
- The quality of the existing stock also needs to be taken into account as standards on soundproofing, energy efficiency, outdoor space and accessibility are continuously improving.
- This imbalance between demand and supply cannot be solved in a short time frame. This explains consistently high occupancy rates in the residential sector and limited void periods between tenants.
Supply / demand imbalance - 2010-2019
Sources: Eurostat, Ministerio de Fomento, CBS, destatis, Ministère du développement durable, Greater London Authority, AEW Research & Strategy
LACK OF SUPPLY DRIVES 3% RENTAL GROWTH PA SINCE 2014
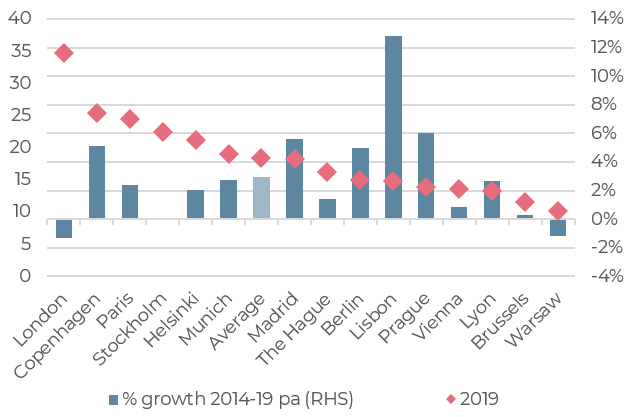
- The lack of supply also drives residential rental growth. On average across the 15 markets shown on the right, residential growth reached 3.0% per annum between 2014 and 2019. This compares against 3.6% and 2.4% respectively for the European office and logistics sectors during the same period.
- The chart also highlights the differences across European markets both in terms of rental levels and rental growth. While London’s rents are the highest of all markets covered on this chart, rental growth has been negative since the Brexit vote in 2016 until 2018.
- Regulation – at national and local levels – play a key role in the residential sector. Lisbon has experienced the strongest increase in rents, partly as a result of liberalisation reforms. By contrast, Berlin’s Senate approved a five-year rent freeze in June 2019 for all rented dwellings built before 2014 which led to a sharp fall in the share price of listed housing companies. Regardless of the final decision to be taken by the Federal Court of Karlsruhe on the constitutionality of the rental cap, political pressure remains high to curb rental growth in the main German cities. Catalonia is also considering introducing new policies to limit rental growth. Regulatory changes need to be closely monitored.
Residential rents (€/sqm/month) & rental growth pa 2014-2019
Sources: Eurostat, AEW Research & Strategy
RENTAL GROWTH HAS OUTPACED INCOME GROWTH IN MOST MARKETS
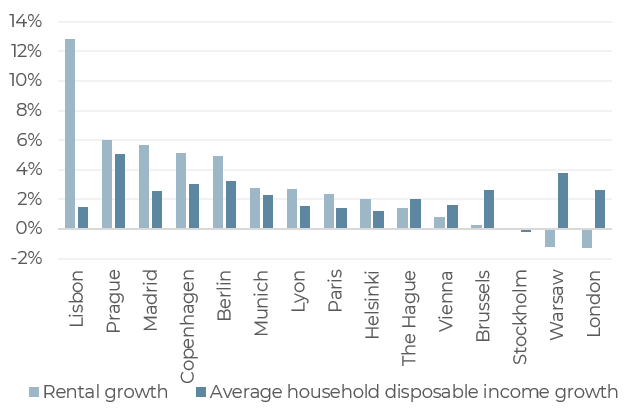
- On average across Europe, housing costs represent 27% of private renters’ income, ranging from 38% in the UK to 13% in Finland.
- At the city level however, rental growth has outstripped household disposable income growth since 2014 in most European markets, yet not all.
- Lisbon is by far the market where affordability conditions have deteriorated the most. This can be partly explained by the 2012 reform to gradually abandon open-ended leases with rents significantly below market levels and by the boom in short-let rentals on platforms such as Airbnb following the change in regulation in 2014.
- Disconnection between rent and income might limit rental growth potential going forward. Nevertheless, the lack of supply is likely to continue putting pressure on rents. Long time series on rental levels highlight the resilience and low volatility of residential rents in the largest cities throughout the economic cycles. This underpins the downside protection characteristics of the residential sector.
Rental growth & household disposable income growth (%, pa) – 2014-2019
Sources: Eurostat, Oxford Economics, AEW Research & Strategy
THE RISE OF THE RESIDENTIAL INVESTMENT MARKET
FIVEFOLD INCREASE IN RESIDENTIAL TRANSACTION VOLUMES
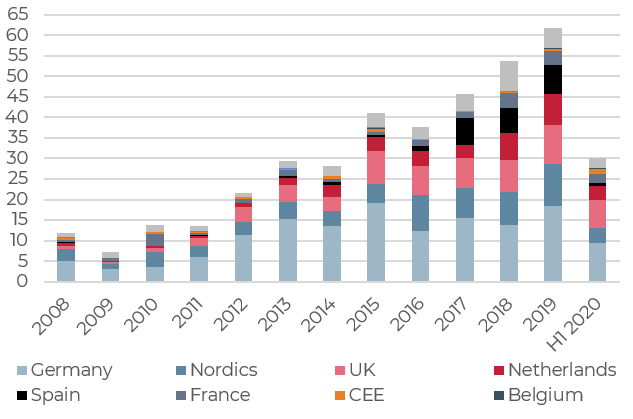
- European residential transaction volumes have increased from €11.8 billion in 2008 to €61.7 billion in 2019. This represents more than a five-fold increase.
- Despite the Covid-19 pandemic, residential volumes invested in H1 2020 represents more than half of the 2019 full-year record volumes. This indicates the increasing appetite of investors for this defensive property type at a time of greater uncertainty.
- European markets differ widely in terms of liquidity. The largest investment market is Germany (€18 bn transacted in 2019), followed by the Nordics. By contrast, the UK and France have a relatively small residential sector in comparison to the size of their overall investment market.
- Appetite for residential is expected to remain high as investors focus on income-producing, core assets in the current volatile environment. German investors in particular are investing in Germany and the rest of Europe.
Residential investment volumes (€ billion)
Sources: RCA, AEW Research & Strategy
RESIDENTIAL NO LONGER A NICHE AT 25% OF THE OVERALL MARKET
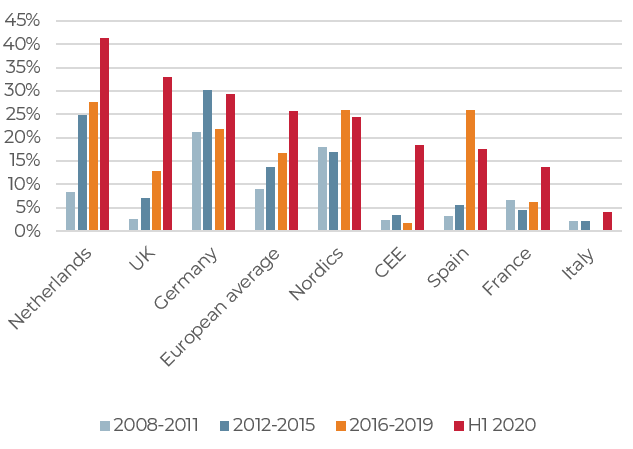
- The share of residential in the overall market has been rising in most countries and now represents over 25% of total volumes, compared to 9% in the 2008-2011 period.
- In the UK, residential represented 33% of the volumes in H1 2020 compared to just 3% in 2008-2011. A similar trend was recorded in Spain, driven by cross-border investors via takeovers (Hispania for €2.8 bn and Axiare for €1.7 bn). These are significant increases in countries dominated by owner-occupiers. Nevertheless, institutional ownership of residential properties remains low in the UK (2%) and Spain (3%), in comparison to Germany (18%) or the US (37%).
- Institutional investors have historically been more active in the Netherlands and Germany. In these markets, residential volumes represent 41% and 29% respectively of the total invested volumes.
- In France, institutional investors are making a comeback to the residential sector. While residential represents 15% of institutional investors’ real estate portfolios (mostly historic assets), the office sector has dominated the investment market for more than a decade. However, the lack of residential buildings available to buy limits transactions.
Residential investment volumes as % of total volumes invested in real estate
Sources: RCA, Green Street, AEW Research & Strategy
PRIME RESIDENTIAL YIELDS ARE LOW BUT CLOSE TO RETAIL AND OFFICES
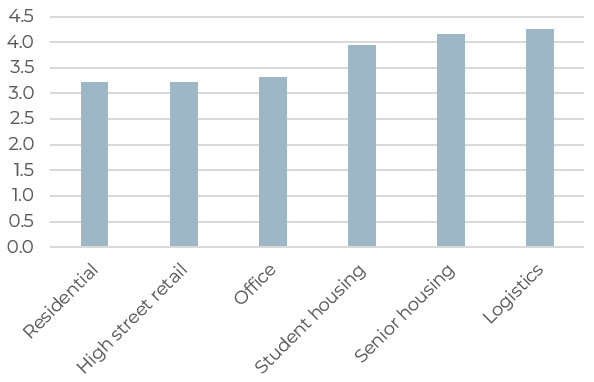
- Prime residential yields are low at around 3.25% (European average of 16 markets). However, prime high street retail and office yields are only marginally higher in Q2 2020.
- Student & senior housing enjoy the same market fundamentals than the residential sector with the additional benefits provided by long, triple-net commercial leases and a less constraining regulatory environment. Prime student and senior housing yields are also more attractive at 4.00-4.15% on average in Europe. The 75-90 bps spread over standard residential reflects the operating risks but further yield compression is to be expected in these maturing sectors.
Prime net yields by sector in Q2 2020 – European average of 16 markets (%)
Sources: CBRE, Savills, AEW Research & Strategy. Student housing & senior housing yields based on FR, DE, NL and ES average.
RESIDENTIAL PROVIDES STABLE INCOME & CAPITAL GROWTH POTENTIAL
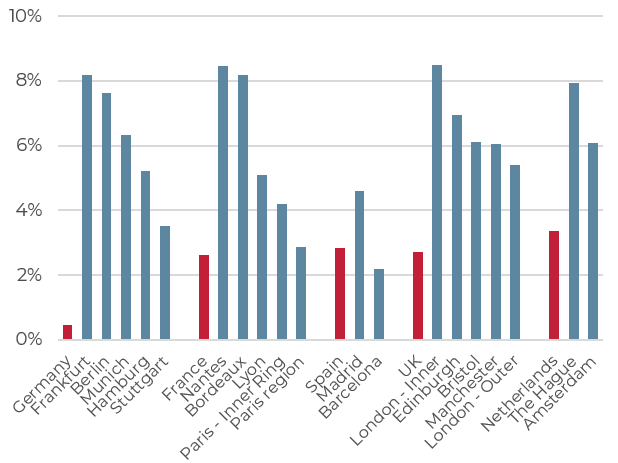
SUBURBAN LOCATIONS & REGIONAL CITIES OFFER MORE ATTRACTIVE YIELDS THAN INNER CITIES
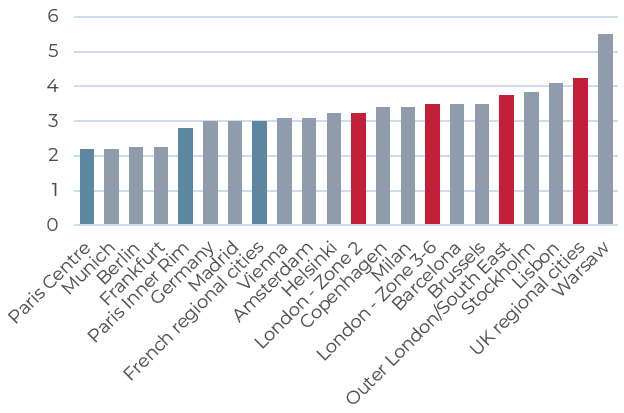
- Prime residential yields in Europe range from 2.20% in central Paris and Munich to 5.50% in Warsaw, reflecting differences in liquidity, market size and potential for capital appreciation.
- While prime initial yields are sharp in inner cities, suburban locations offer more attractive returns. For instance, prime residential yields stand at 3.25% in Central London (zone 2), at 3.50% in zones 3 to 6 and 3.75% in Outer London.
- Regional cities also tend to offer more attractive yields, but the depth of the occupier market can also be less important.
Prime residential yields (%) - Q2 2020
Sources: CBRE, AEW Research & Strategy
HOUSE PRICE GROWTH HAS BEEN STRONG AT 6% PA SINCE 2016
- All major residential markets have experienced house price growth since 2016. On average across the 17 markets on the right, house price growth reached 6.1% per annum between 2016 and 2020.
- The German markets and Amsterdam recorded the strongest growth (over 9.0% pa) over the period, followed by Lyon and Madrid.
- Central Paris apartment price growth has been robust although prices/sqm are among the highest in Europe alongside London. Stockholm also recorded solid growth despite stricter mortgage amortization requirements in Sweden.
- Madrid and Barcelona stand out as the only European markets where house price have not recovered to their pre-GFC levels.
- Despite strong growth over the last ten years, Berlin apartment prices remain low in a European context at €4,000/sqm.
- Data collection on city level performance remains challenging in the residential sector. Our approach at AEW is to collect data from online platforms and local market sources to have more timely and more granular information.
Residential prices (€/sqm) & price growth (%, pa, 2016-20)
Sources: National offices of statistics, Idealista, Zoopla, Meilleurs Agents, Immoverkauf24, Immobilienscout24, Asuminenhelsingissa, NVM, Goinglobal, AEW Research & Strategy
DIRECT RESIDENTIAL INVESTMENTS OFFER A PREMIUM TO INVESTORS OVER MORTGAGE BONDS
- Mortgage interest rates have not been impacted by the Covid-19 pandemic. At 1.4% on average in the Eurozone, interest rates remain at historically low levels, supporting house price growth by increasing households’ purchasing power.
- Mortgage markets play a key role in the stability of the residential sector. Both household debt and banks’ balance sheets are overall much healthier today than before the GFC.
- RMBS (Residential Mortgage Backed Securities) and mortgage bonds are other options available to investors to get exposure to the European residential market. However, these public real estate debt products are often overweight to the UK and sometimes mixing commercial and residential assets. A private equity approach also seems more attractive with a spread between residential yields and mortgage rates currently standing at 160 bps.
Eurozone mortgage interest rates (%), prime residential yields (8 market avg, %) & house price index (Q2 2012 = 100, RHS)
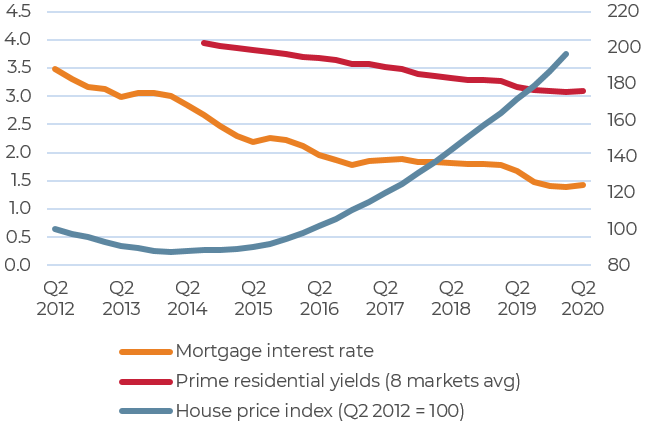
Sources: ECB, Eurostat, AEW Research & Strategy
COVID-19 IMPACT ON THE RESIDENTIAL SECTOR
RISING UNEMPLOYMENT RATES EXPECTED TO HAVE MIXED IMPACTS ON THE PRIVATE RENTED RESIDENTIAL SECTOR
- As a result of the Covid-19 pandemic, the unemployment rate in the Eurozone is forecast to increase from 7.6% at the end of 2019 to 9.3% in 2021 - as temporary job schemes are partially lifted.
- Rising unemployment rates have mixed impacts on the private rented sector. On one hand, household disposable incomes will be negatively impacted, potentially leading to increasing arrears. On the other hand, more households will be forced to rent longer or to move to cities offering job opportunities.
- Due to the exogenous nature of the current economic crisis, unemployment is forecast to decrease faster than after the GFC. Severely hit sectors such as tourism and restauration are indeed expected to recover quickly once the sanitary crisis is over.
Unemployment rates (%)
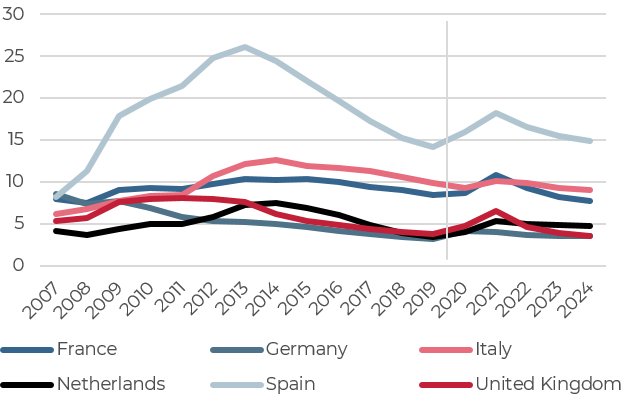
Sources: Oxford Economics, AEW Research & Strategy
MORE HOUSEHOLDS WILL BE FORCED TO RENT DUE TO TIGHTENING CREDIT CONDITIONS
- Data from the ECB on the mortgage market indicate that credit conditions have tightened for households as a result of the Covid-19 pandemic, in particular for first-time buyers.
- More significant is the decrease in demand for loans from households. This reflects the deteriorating labour market conditions.
- A growing number of households – particularly first-time buyers - is therefore expected to stay in the private rented sector.
- The UK stands out as an exception as the government introduced a stamp duty holiday until late March 2021 to support the housing market, which has led to a surge in transactions.
- Credit conditions are expected to remain tight. Banks are indeed required to keep healthy balance sheets, while these have been disrupted by measures to protect mortgage-holders such as temporary forbearance of mortgage payments.
Credit conditions & demand for mortgages from households
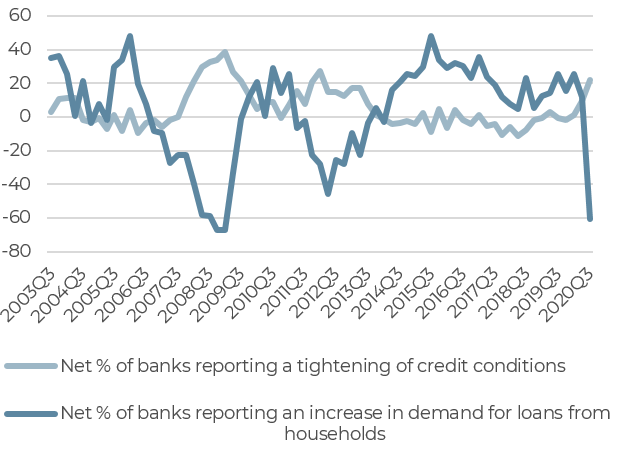
Sources: ECB, AEW Research & Strategy
REIT RENT COLLECTION DATA HIGHLIGHTS THE RESILIENCE OF THE RESIDENTIAL SECTOR
- Rent collection data from European Real Estate Investment Trusts highlight the resilience of the residential sector.
- In Q2 2020, residential REITs reported rent collection rates close to 100%. This compares to 96% for logistics REITs, 93% for office REITs and 59% of retail REITs.
- The residential sector is considered as the most defensive property types as it is less subject to economic downturns.
European REITs - Rent collection rates in Q2 2020 (%)
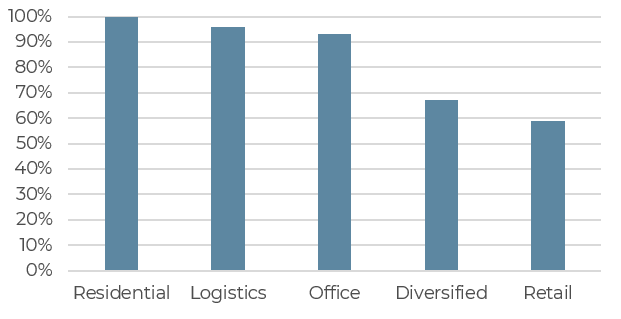
Sources: Green Street, AEW Research & Strategy
OUTLOOK FOR THE RESIDENTIAL SECTOR
POPULATION GROWTH CONCENTRATED IN CITIES
- In the largest metropolitan areas, supply has been unable to catch-up with demand for housing. Population growth is indeed concentrated in a few dynamic European cities, which cluster jobs, universities and urban amenities.
- This secular trend of urbanisation (and its spillover effect suburbanisation) is here to stay despite the Covid-19 pandemic. In a context of weak demographic growth in Europe, the largest cities are still forecast to grow despite high housing costs, environmental and now sanitary challenges.
- While growth rates appear unspectacular, the 7% population growth expected in Greater London over the next ten years translates into a net addition of 600,000 inhabitants. Household growth also tends to accelerate as household size continues to decrease.
- Agglomeration economies – the benefits associated with spatial clustering of economic activities, labour and infrastructure – remain powerful forces in a knowledge-based economy concentrated in metropolitan areas. Location matters even if working remotely becomes more widespread (cf. Thomas Friedman’s “The World is Flat” vs Richard Florida’s “The Rise of the Creative Class” debate).
Population growth forecasts post-Covid (next 10 years) in %
Sources: Oxford Economics, AEW Research & Strategy
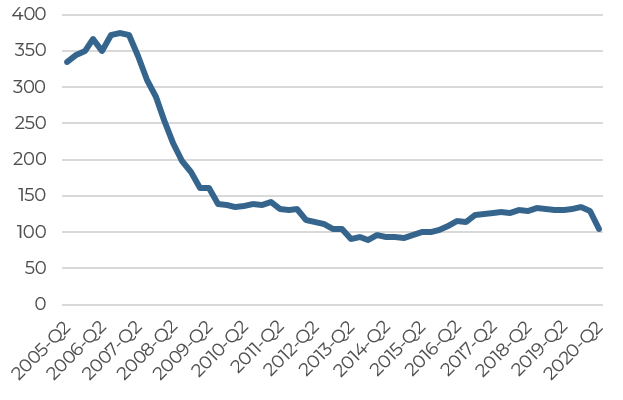
BUILDING PERMITS DATA POINTS AT A DROP IN FUTURE SUPPLY
- The lockdown had direct impact on construction activity and on the processing of building permits by planning authorities.
- As a result, the number of building permits fell 20% in Q2 2020 year-on-year to a near historic low. This is a forward-leading indicator predicting a future decrease in housing completions.
- The drop is particularly severe in Spain – where construction activity has been very limited since the property boom pre-GFC - and in France, where local elections had to be postponed this year, causing further delays. The pandemic also put an halt to construction activity in the UK.
- Construction activity remains however active in Germany, Austria, the Netherlands, Poland and the Czech Republic.
- Lack of available land, rising construction costs, more comprehensive environmental regulations and NIMBYsm are limiting residential developments. For these reasons, demand will continue to outstrip supply for a number of years to come.
EU building permits index (2015 = 100)
Sources: Eurostat, AEW Research & Strategy
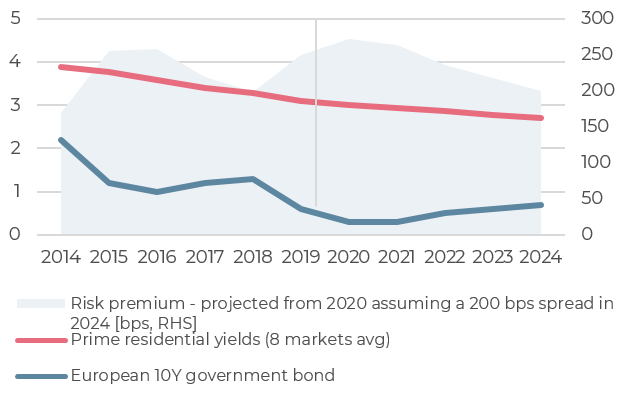
LOWER FOR LONGER INTEREST RATES WILL DRIVE HOUSE PRICE GROWTH GOING FORWARD
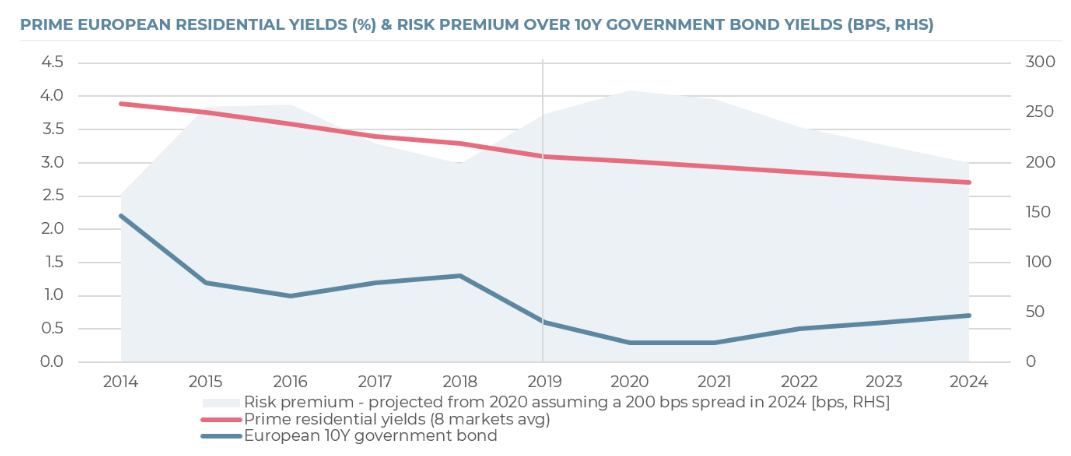
- Despite low initial yields, the residential sector offers attractive risk-adjusted returns to investors looking for a defensive investment. Indeed, the risk premium over a 10-year government bond (European average) currently stands at 250 bps.
- We have assumed a yield spread of 200 bps in 2024 and interpolation between 2019 and 2024 to calculate projected residential yields.
- In this scenario, prime European residential yields would compress c. 40 bps to reach 2.70% by 2024.
- As central banks are expected to keep interest rates lower for longer, we expect prime residential yields to remain at historically low levels over the next five years.
Prime European residential yields (%) & risk premium over 10Y government bond yields (bps, RHS)
Sources: CBRE, Bloomberg, AEW Research & Strategy
READ THE FULL REPORT
WATCH THE WEBCAST
The information and opinions presented in this research piece have been prepared internally and/or obtained from sources which AEW believes to be reliable; however, AEW does not guarantee the accuracy, adequacy, or completeness of such information.