MAY 2020
Moving Into The Next Phase
The economic impact of the COVID-19 pandemic can perhaps best be described in four distinct phases: the shutdown, the re-opening, the transition to the new normal and the new normal (or as one colleague has put it, the new “abnormal”). As of May 18th, all 50 states have officially begun the process of lifting restrictions on personal and commercial activities and re-opening their economies. While there is great variation across the states with respect to the pace and breadth of re-opening, all have initiated some form of staged re-opening. These stages will advance from more restrictive to less restrictive, in theory, on the achievement of some prescribed public health goals such as a reduction in new confirmed cases over a specified period (e.g. 14 days) or a decline in hospitalization rates relative to new cases. It is worth noting, there is also great variation across the states in the degree to which the rate of new infections appears under control. As of the date of this report, 14 states are reporting accelerating numbers of new cases over the prior two weeks, largely attributed to broader testing regimes. Similarly, the economic contraction associated with the shutdown phase continues into the re-opening period with the Department of Labor reporting more than 2.1 million new claims for unemployment insurance during the week of May 18, and nearly 41 million new claims for unemployment insurance over the past ten weeks. On a positive note, continuing claims for unemployment insurance, people who were unemployed and seeking insurance two weeks in a row, decreased by more than 3.8 million during the prior week (May 11). This decline in continuing claims is the first government reported employment data to confirm the growing real-time evidence that economic activity is accelerating as the re-opening broadens and accelerates. Disparate data such as restaurant reservations and cell phone mobility tracking confirm that a growing number of workers are returning and increasing shares of the population are venturing forth to shop, eat and even recreate. As terrible as the economic data has been over the past few months, it is very likely that the data will be equally spectacular to the positive over the next several months with weekly declines in unemployment claims and monthly reports of employment growth in the millions.
Rapid near-term improvement, but no true v-shape
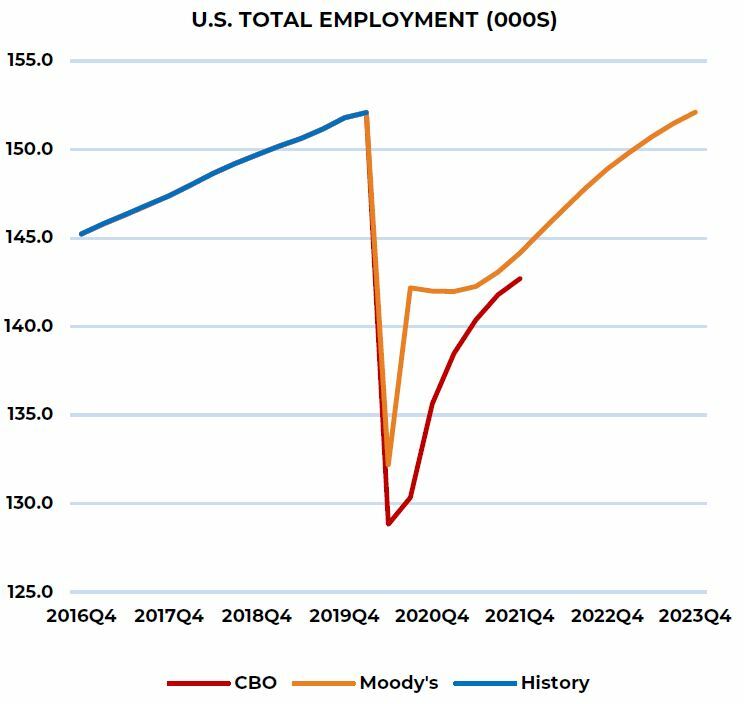
While still highly speculative, visibility on the near-term outlook for the U.S. economy is slowly improving. New forecasts from groups such as Moody’s Analytics and the Congressional Budget Office (CBO) seem to be converging towards a view of the economy where some portion of the record number of jobs lost come back relatively quickly as states, and by extension, businesses re-open. This will be particularly acute in the myriad lower wage services sectors that have been particularly hard hit such as restaurants, bars, hotels and retail. This return to work, while significant, will not likely fill the entire hole created by the shut down; some portion of these establishments will not re-open or, if they do, will not operate at pre-COVID levels. Additionally, negative second order employment effects will continue to ripple through the economy as state and local governments, colleges and universities and many hospitals (and others) are forced to cut spending and workers. Most likely, a return to prior peak employment levels will take 24-36 months, but this could be accelerated or elongated by both virus progression (e.g. introduction of a vaccine) and additional fiscal policy response (or not).
Unprecedented Fiscal and Monetary Policy Response
Relative to the financial crisis in 2008 and 2009, the fiscal and monetary policy response has been significantly larger and faster. Reflecting the spending bills already passed by Congress, the federal deficit for the current fiscal year will exceed $3 trillion, the largest both in absolute terms and as a share of GDP since WWII. While often described as stimulus legislation, what Congress has done so far is largely replacing income and revenue lost to economic lockdown by households and business. For its part, the Federal Reserve has restarted nearly all of the extraordinary monetary policy programs of the Financial Crisis and has added many more. Most significantly, the Fed has already added more than $3 trillion to its own balance sheet through direct purchases of financial assets and has signaled a willingness to expand its balance sheet by as much as another $3 trillion of assets.
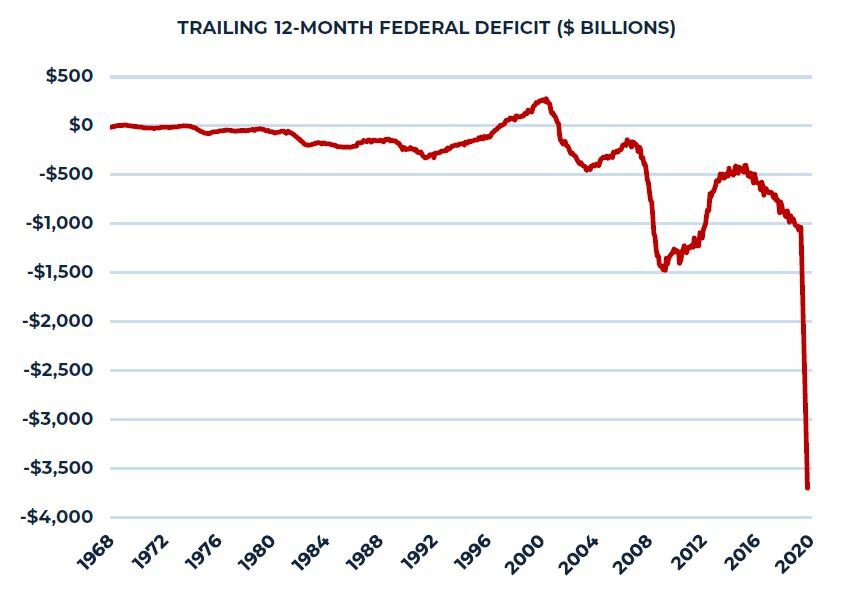
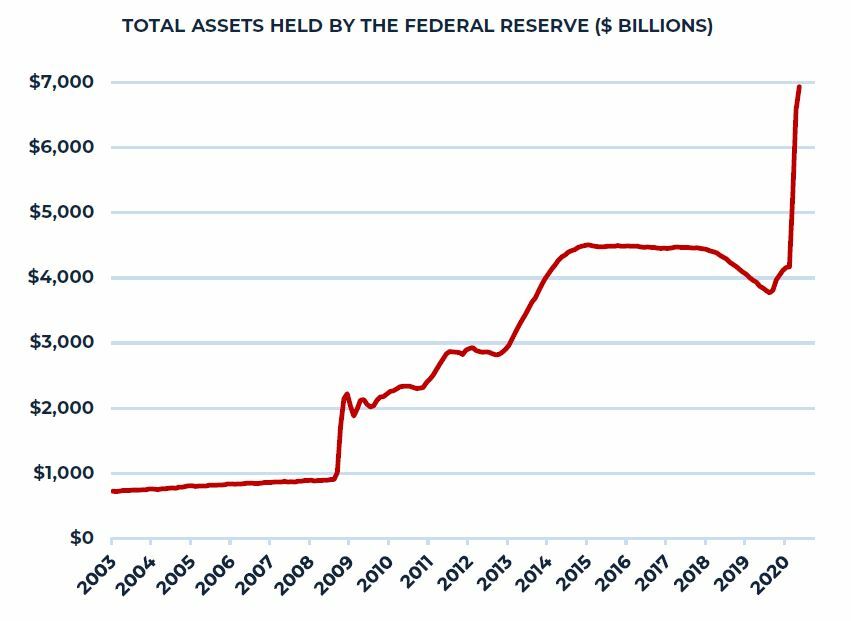
Source: Congressional Budget Office, Federal Reserve
Lower for Longer, Lower Forever?
Reflecting this aggressive monetary policy, market expectations for future interest rates signal a very low interest rate environment for the foreseeable future. As a result, investors around the globe will continue to struggle to find stable and attractive yield. This is a problem that has vexed investors for most of the post Financial Crisis period, and it is one of the powerful forces that has contributed to steady growth in real estate allocations for many investors over the past decade.
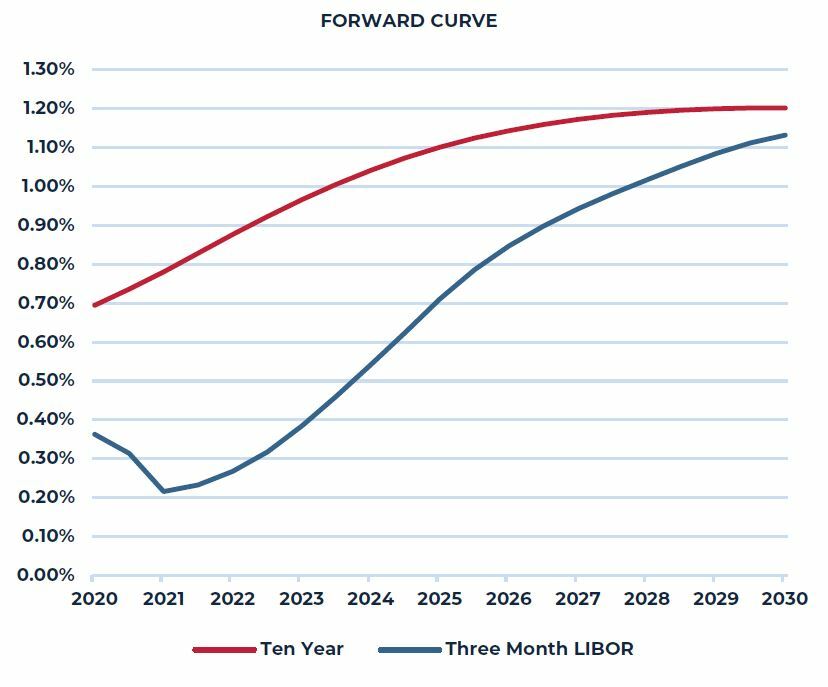
Source: Chatham Financial
The Search for Value and Conviction
The below exhibit highlights the current state of commercial property pricing relative to the ten-year Treasury bond yield as of the end of the first quarter and over the prior 20 years. While the absolute level of property yield is near historic lows, the spread is at or close to historic highs. The degree to which investors accept historically low yields will depend, in large part, on the perceived stability of near-term property income and, ultimately, the expectation of growth in that income over the medium- and long-term. This conviction will obviously vary considerably by property type and possibly geography now and post-COVID. If “lower for longer” is really now “lower forever” property pricing in the U.S., at least for high conviction cash flow assets, may be about to enter a new regime that will likely challenge the comfort level of many investors.
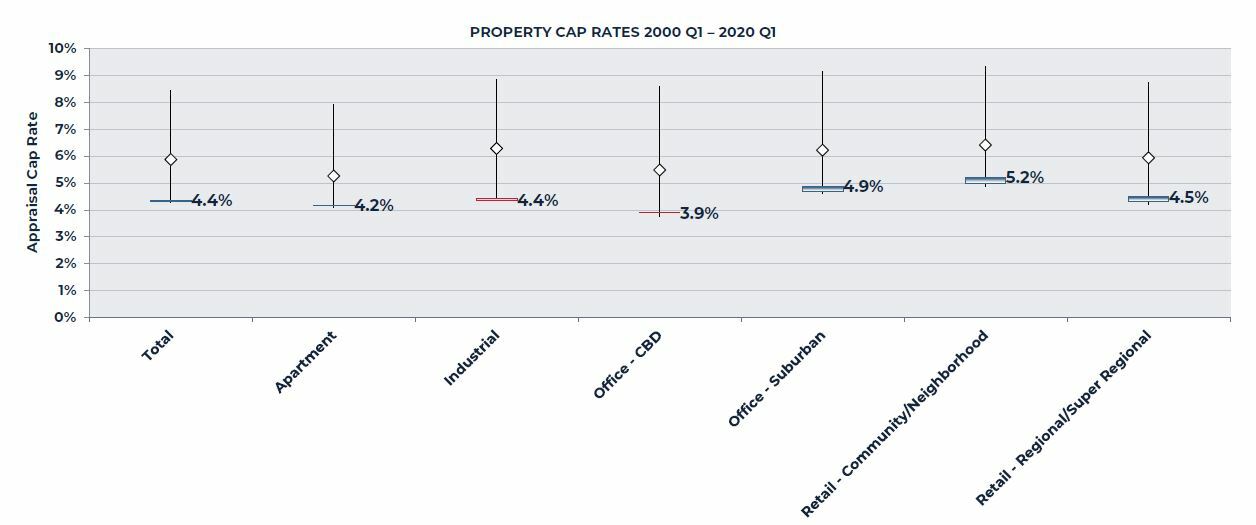
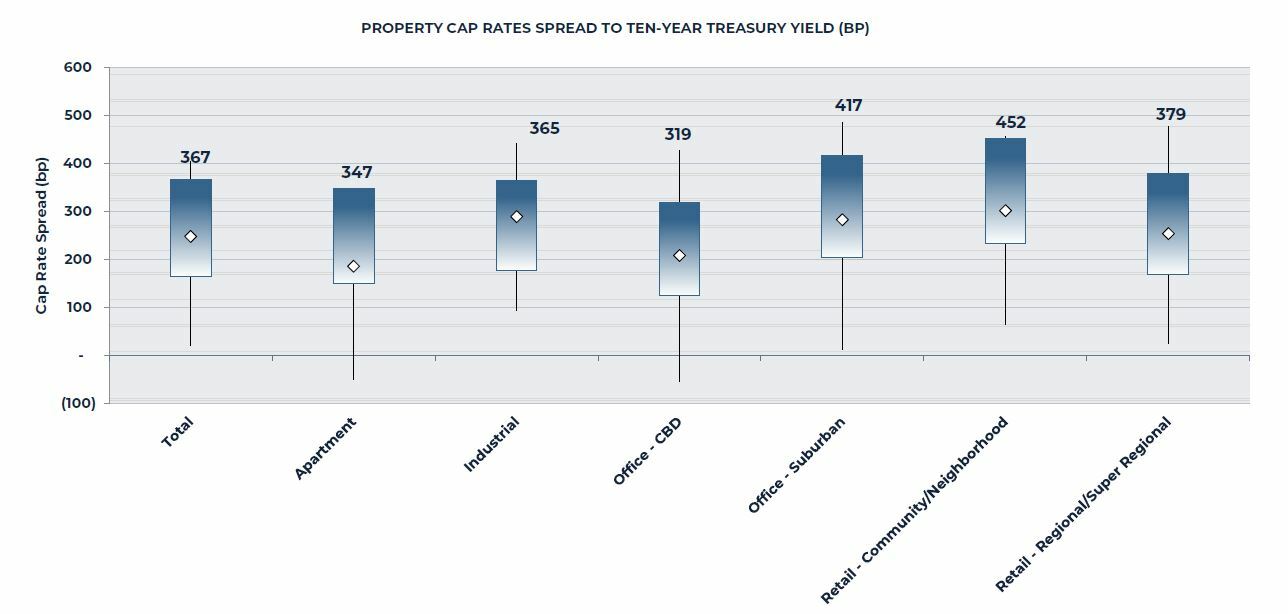
Source: NCREIF
Note: The charts above illustrate the current value for each measure. The line represents the entire range over the time period shown (2000 Q1 to 2020 Q1). The diamond represents the average over the entire historical period and the shaded area shows the change over the past four quarters
This material is intended for information purposes only and does not constitute investment advice or a recommendation. The information and opinions contained in the material have been compiled or arrived at based upon information obtained from sources believed to be reliable, but we do not guarantee its accuracy, completeness or fairness. Opinions expressed reflect prevailing market conditions and are subject to change. Neither this material, nor any of its contents, may be used for any purpose without the consent and knowledge of AEW.
