July 2020
TWO STEPS FORWARD, ONE STEP BACK
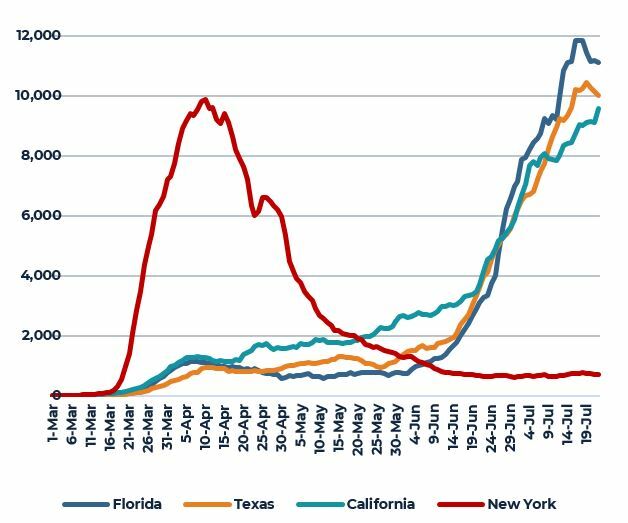
Second quarter data confirm that the U.S. suffered the single most severe contraction in real GDP (-32.9% annualized) since the 1930s and, as the U.S. now passes through the “dog days” of summer, the nation’s economy and psyche continues to be dogged by the relentless spread of coronavirus across large swathes of the country, in particular the southeast, southwest and west coast states. As a result, many states have been forced to slow or even reverse some of the economic re-opening that had been enjoyed during May and June. More significantly, school districts, colleges and universities in many parts of the country are now indicating that fall semester will be delayed or occur in a form that will be less than fully in-person (hybrid of on-line and in-person or fully on-line), leaving many to question the likelihood of a continued (and hoped for) V-shape recovery. Rather, there are a great number of data sources available to monitor the pace of economic recovery in both real time and geospatially that show an economic recovery that is slowing or, in some cases, reversing. One very simple metric that captures a great deal of information regarding consumer sentiment and coronavirus concern are reservations for in-person dining. Simply put, consumers need to feel financially able to dine out, as well as psychologically comfortable being amongst others while participating in a relatively intimate, non-essential activity. In states that re-opened earlier, such as Texas and Florida, it is fairly easy to see the connection between economic re-opening and the acceleration in new infections. Conversely, in a state such as New York that experienced significantly worse infections earlier, the re-opening has been much slower but also, hopefully, more sustainable.
DAILY INCREASE IN COVID-19 CASES
(7-Day Moving Average)
RESTAURANT RESERVATIONS COMPARED TO SAME DAY LAST YEAR
(7-day Moving Average)
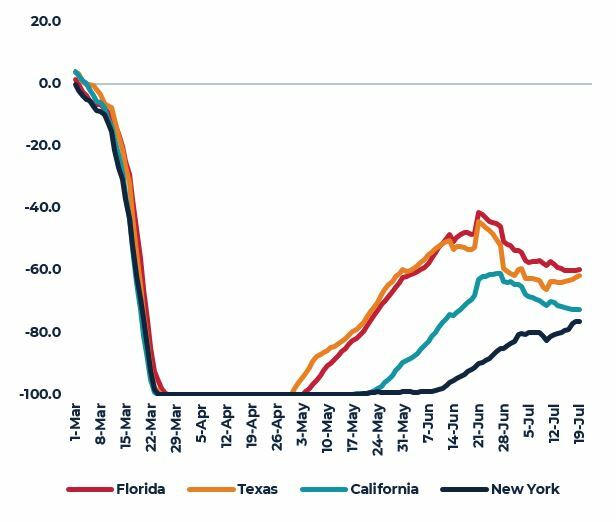
Source: New York Times/GITHUB, Open Table
PROPERTY MARKET IMPACTS
So far, there has been scant hard data on COVID-19 impacts on U.S. property markets with the first wave of economic shutdowns beginning around mid-March as Q1 drew to a close. Second quarter data, however, are beginning to reveal some of the negative and, we assume, worsening conditions over the next several quarters. Specifically, vacancy rates across all major property types (and most major markets) increased during Q2, albeit not dramatically. The significance of these increases is not as much tied to the scale, but rather the direction. After ten-years of slow, but steady economic growth and property market tightening, property market fundamentals are unambiguously going in the wrong direction and this change is showing up not just in measures of the physical market, but also in the financial characteristics of many properties.
YEAR-OVER-YEAR GROWTH IN NET OPERATING INCOME (NOI)
VACANCY/AVAILABILITY RATE
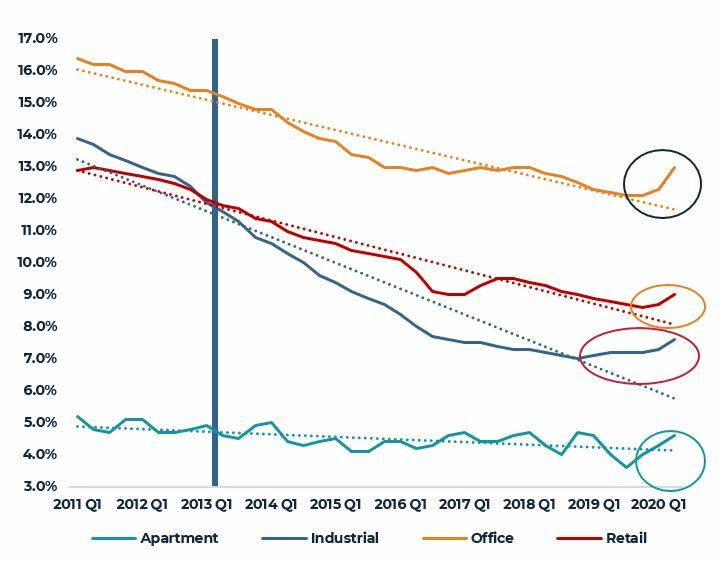
Source: CBRE-EA
PROPERTY INCOME
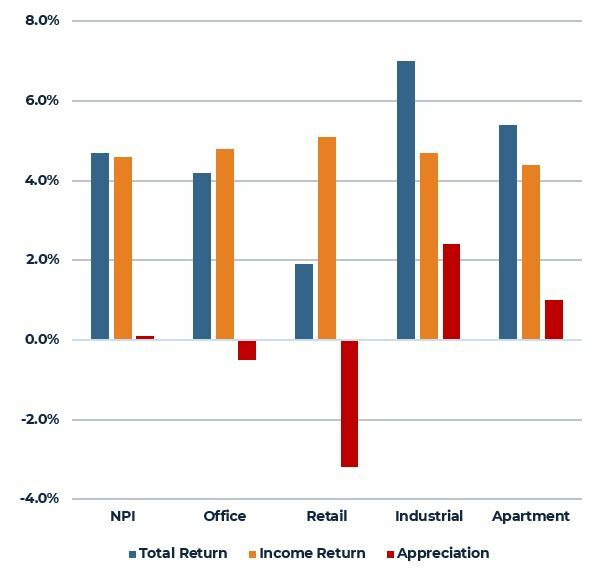
While the deterioration in property occupancy during the second quarter was relatively small, the impacts to the metrics that investors most care about, such as property income, were far more significant. Second quarter data from NCREIF shows retail property net operating income (NOI) falling more than 32% during the second quarter with the largest declines coming in the beleaguered regional mall sector (-60%). Apartment properties also suffered negative NOI growth during the quarter, falling 3.8%, marking the first quarter of year-over-year decline in apartment NOI since the financial crisis. So far, these declines in NOI have not been capitalized into property values as most investors likely believe these dislocations to be transitory, and in many cases, this will likely prove correct. At this point, however, there remains significant uncertainty on several fronts. How high will vacancy rents rise and what impact will this have on rents, cap ex requirements and expenses? How will this vary by market and property type? Clearly it is still fairly early in the COVID-19 property investment period to adequately answer these and other questions, but the transaction market, while significantly scaled back from pre-COVID levels, does point to some early consensus.
YEAR-OVER-YEAR GROWTH IN NET OPERATING INCOME (NOI)
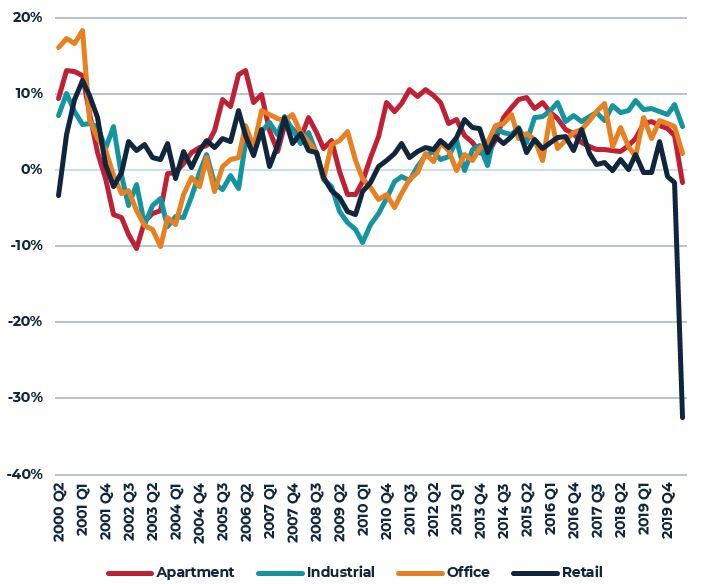
Source: NCREIF
PROPERTY TRANSACTION MARKETS
Commercial property transaction volumes during the first quarter did not show any meaningful COVID-19 impact. Total volume was down near 4% compared with the first quarter of 2019 but the volume of industrial property transactions was nearly double the prior year’s volume. Indeed, most of the major property type recorded an increase in transaction volume during the first quarter relative to 2019.
The second quarter, however, was significantly different with total volume falling nearly 70% from first quarter and year-earlier levels. Not surprisingly, the drop in transaction volume corresponded closely to the negative impact on property performance associated with the pandemic-driven economic shutdown with hotels, retail and seniors housing showing the greatest reduction. For seniors housing, the drop in investment activity was more likely a function of health and safety concerns by property owners and an inability for investors to enter properties during lockdown periods. Property fundamentals did soften, however, as occupancy rates declined as new entrants were delayed.
CHANGE IN 2020 TRANSACTION VOLUME
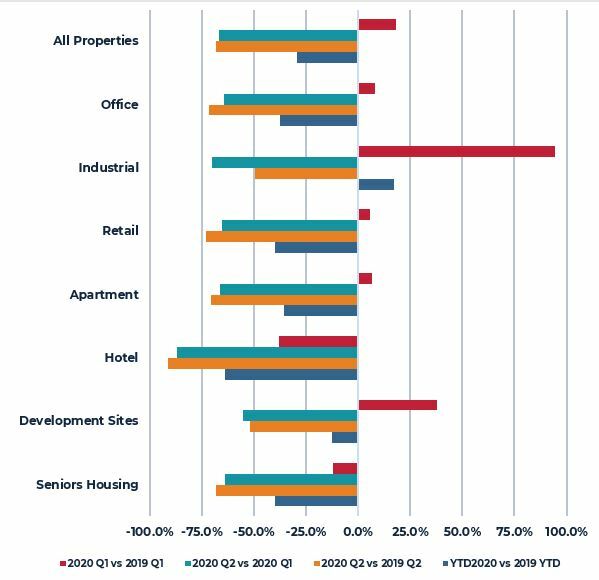
Source: Real Capital Analytics (RCA)
GO-FORWARD EXPECTATIONS
The abrupt seizure of transactions clouds visibility into price discovery and the potential impact on property valuations. For its part, the PREA 2020 Q2 Consensus Survey suggests that investors expect virtually no price appreciation across the NCREIF universe over the next five years with modest gains in industrial and apartment properties being largely offset by declines in retail and office property valuations. Further, the year-by-year breakdown in the consensus results suggests peak-to-trough value declines of slightly more than 20% for the average retail property and slightly more than 10% decline for the average office property. In contrast, apartment properties are expected to show a peak to trough decline of slightly more than 5% followed by a fairly robust recovery. For its part, industrial properties are expected to show little or no decline in value.
Source: PREA 2020 Q2
This material is intended for information purposes only and does not constitute investment advice or a recommendation. The information and opinions contained in the material have been compiled or arrived at based upon information obtained from sources believed to be reliable, but we do not guarantee its accuracy, completeness or fairness. Opinions expressed reflect prevailing market conditions and are subject to change. Neither this material, nor any of its contents, may be used for any purpose without the consent and knowledge of AEW.
