Seniors Housing Research Perspective
Seniors housing continues to expand its footprint across the commercial real estate investment landscape both from an equity and debt perspective with a healthy flow of capital continuing to enter the space through both established players and new entrants. As has been the case across the entire real estate spectrum, returns and cap rates have compressed, but seniors housing has maintained an attractive relative spread to other property sectors from both a stabilized and development basis. Long-term fundamentals, anchored by the demographics of an aging population haven’t changed, while the near-term dynamics between supply and demand have improved with the pace of new building slowing and demand for units moving higher. Occupancies have stabilized, but remain roughly 250 basis points below their cyclical peak creating some lease-up challenges in markets where new supply has been more pronounced. Still, stabilized assets continue to achieve healthy rent increases supporting top line revenue growth. Pressures remain on the expense side, but net operating incomes continue to expand albeit at a slower pace than earlier in the cycle with the value of a strong operator becoming more apparent. In aggregate, seniors housing continues to deliver attractive absolute and relative returns, trailing only the industrial sector over the most recent time periods.
From a fundamentals perspective, demand for seniors housing units notched another strong quarter and a record year for the number of units absorbed helping solidify the trend of stabilizing occupancies. According to the National Investment Center for Seniors Housing and Care, (NIC) net absorption of 7,421 units in the fourth quarter of 2019 brought the annual total to just shy of 24,300 units representing demand growth of 2.9%. Net absorption has been sufficiently strong to offset pace of new supply lifting occupancy 10 basis points over the previous quarter to 87.9%, in line with year-ago levels across the primary and secondary markets tracked by NIC. The net addition of approximately 6,800 new units in the fourth quarter pushed inventory growth just shy of 26,800 units for the year, representing supply growth of 2.9%. While revisions may adjust these numbers slightly, market demand appears to be keeping pace the current level of new supply.
SENIORS HOUSING FUNDAMENTALS - PRIMARY AND SECONDARY MARKETS
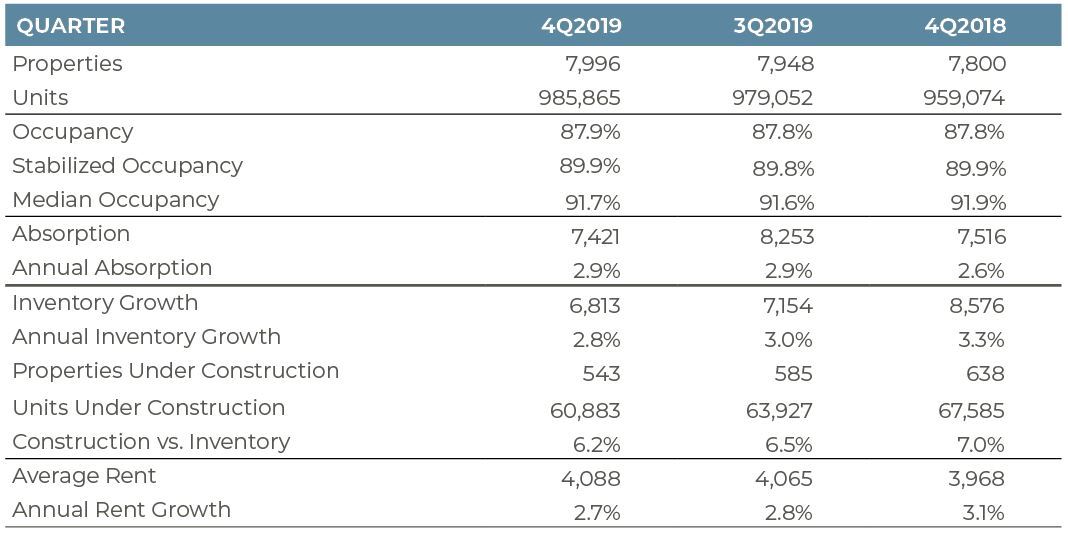
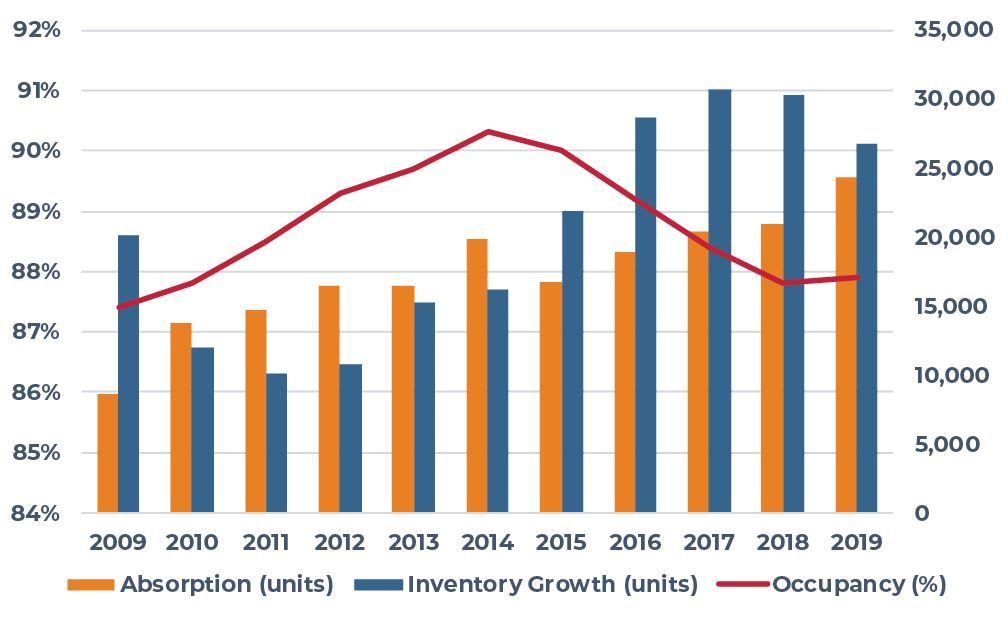
Source: NIC Map Data Service
An encouraging dynamic on the supply side has been the slowing pace of new construction starts. The annual pace of starts totaled 25,300 units in the fourth quarter, down from a peak of nearly 41,100 units at the end of 2015 and below the current pace of deliveries. While revisions to the latest quarter will likely bring the 2019 number up slightly (the typical revision has been roughly 2,500 units), the trend is clearly in the right direction. In addition to market forces, rising construction costs are also acting as a natural governor by impacting underwriting and causing delays or in some cases putting projects in jeopardy of moving forward. All told, the pipeline of new units under construction remained elevated at 60,900 units at the end of 2019 implying the pace of new deliveries will remain elevated over the near-term before marching lower. AEW has seen development timelines for most property types extend from what it was just a few years ago and seniors housing is no exception. Labor challenges and competition for good sub-contractors is one notable contributor to this dynamic, but projects have also increased in size as designs have moved toward an expanded continuum of units types and more amenities. Overall, NIC is forecasting flat to slightly higher occupancies over the course of 2020 depending on the segment type while AEW remains somewhat more cautious in its outlook based on supply side dynamics.
CONSTRUCTION AS A SHARE OF EXISTING INVENTORY
PRIMARY AND SECONDARY MARKETS
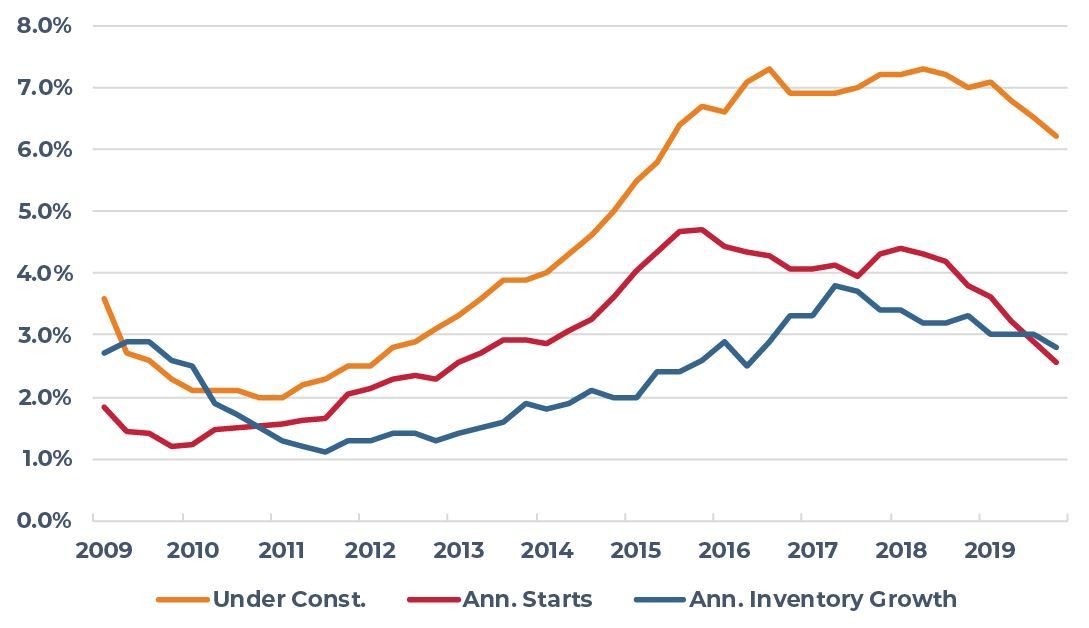
Source: NIC Map Data Service
The macro dynamics underpinning positive demand remain solidly in place including healthy employment conditions, strong housing prices, an appreciating equity market and favorable demographic trends which are supporting higher rents. Rent growth for seniors housing averaged 2.7% in 2019 outpacing aggregate inflation. Rent concessions are becoming more common for newly built assets in lease-up, especially where supply growth has been more prevalent. However, once stabilized new assets are demonstrating the ability to move rents higher supporting stronger top line revenue growth. As noted above, pressures on NOI growth are coming more from the expense side, most notably labor, although property taxes and insurance costs are other line items that have seen above average increases. Good operators have been out in front of adjusting wages where regulated minimums have increased as well as being more aggressive retaining key staff positions. Contract labor remains an expensive alternative to staffing shortages.
ANNUAL RENT GROWTH (%)
PRIMARY AND SECONDARY MARKETS AS OF Q4 2019

Source: NIC Map Data Service
Across the different components of the seniors housing continuum, the story is relatively consistent. All segments experienced flat or rising occupancies in the second half of 2019 after coming off occupancy lows earlier in the year. The higher acuity segments, namely assisted living and memory care remain in a state of elevated supply growth although the pace is trending lower. Occupancies for majority assisted living (AL) properties, which typically include memory care, rose 30 basis points in the fourth quarter to 85.5% and are now 30 basis points above year ago levels. Median occupancies also moved higher reaching 91.0% at year-end with a 40-basis point increase over last year bringing occupancies to within 20 basis points of year ago levels. The pace of annual net absorption (rolling four quarters) remains on a healthy footing at 3.7% growth eclipsing the pace of new product entering lease-up (3.3% inventory growth). Overall, we remain comfortable with our expectation that demand should maintain its pace of gradual acceleration as acceptance of the product and demographics provide support. The backlog of projects in the pipeline is a larger challenge although sufficient evidence of a slowdown in new projects starting construction is in place. The total number of units under construction is elevated at 6.2% of existing inventory - 29,443 units - but is notably lower than the peak of 39,700 units started three years ago. Similarly, the number of new units breaking ground remained elevated in 2019, but has slowed materially from 26,100 units in 2015 to under 12,000 as of fourth quarter 2019. All told the pace of new construction starts is currently running between 2.5% and 3.0% compared to demand growth which is currently running between 3.5 % and 4.0%. The supply picture is improving, but the occupancy benefits will likely be more pronounced in 12 to 18 months with a bigger emphasis on demand driving higher occupancies.
PROPERTY TYPE FUNDAMENTALS - PRIMARY AND SECONDARY MARKETS
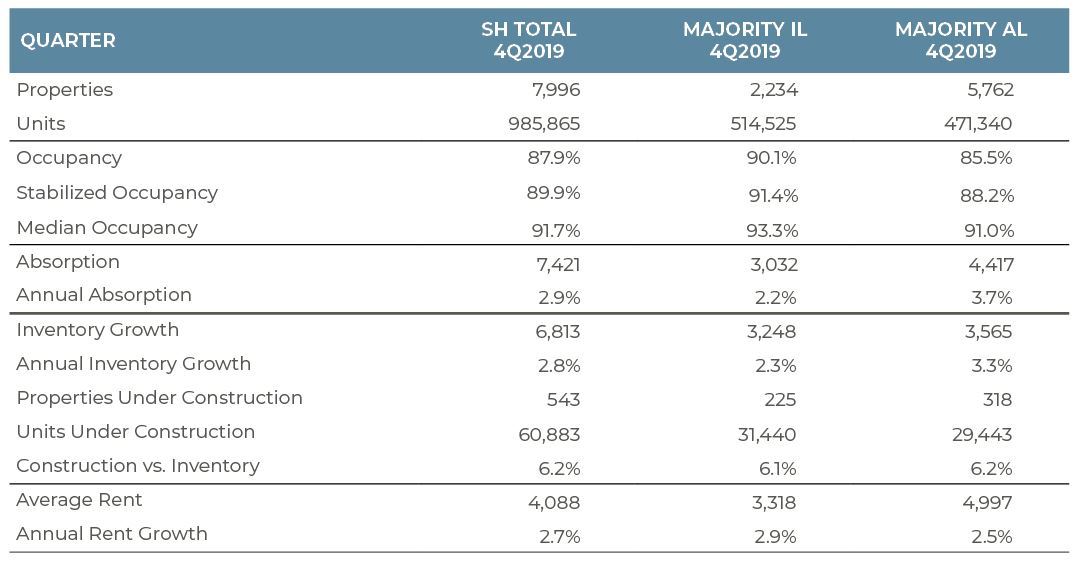
Source: NIC Map Data Service
The majority independent segment (IL) experienced a more delayed supply response than the majority AL segment coming out of the last recession although the pace has accelerated along with shift in demand toward larger assets with more amenities and a fuller continuum of unit types and services. Although not building at the pace seen in assisted living, the pipeline of assets dominated by independent living units has continued to expand with nearly 31,500 units under construction in 2019 representing 6.1% of existing inventory. Despite the pace of supply, demand for majority IL assets has been sufficiently strong to keep occupancies near 90% for several years ending 2019 at 90.1% or about 450 basis points above rates for Majority AL assets. Median occupancies remain notably higher at 93.3%. In aggregate, demand expanded 2.2% in 2019 while inventory growth averaged 2.3%. New construction starts have been trending lower and totaled nearly 11,000 units in 2019 after peaking near 15,000 units in early 2018.
Private equity capital continues to flow into health care and the seniors housing space is no exception. Much like the broader commercial real estate sector, returns have been trending lower but seniors’ housings spreads relative to other property sectors remain favorable. With an increased amount of “dry powder” on the sidelines, the market remains attractive for sellers of higher quality assets with good operators where capital is being more aggressive. In aggregate, seniors housing transaction volume increased nearly 20% in 2019 to $10.8 billion although the number of assets trading dropped from 743 to 582 properties or 22%. Buying patterns in 2019 reflected much of what we saw in 2018 with institutional and private capital each accounting for roughly one third of the acquisition activity and public REITs represented another one quarter of the activity (27%). Foreign capital and other investors made up the balance or about 6% of total dollar volume. From a net perspective, however institutions increased their relative exposure to the sector by $2 billion, purchasing over $4.2 billion while selling only $2.2 billion in assets. Newer product and larger portfolios were of primary interest to institutional investors although some investors were willing to move down the quality spectrum for higher going in yields. Net capital flows from foreign investors was also positive, increasing $300 million while public REITs were aggregate net sellers of seniors housing assets as they continued to rebalance away from triple-net lease structures with underperforming operators.
TRANSACTION VOLUME ($BILLIONS) AND BUYER COMPOSITION (%)
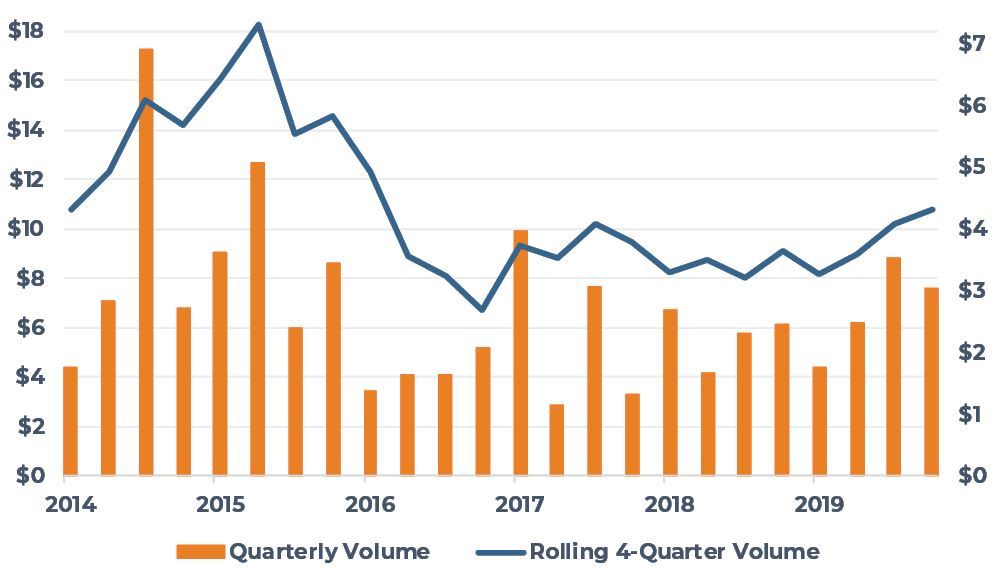
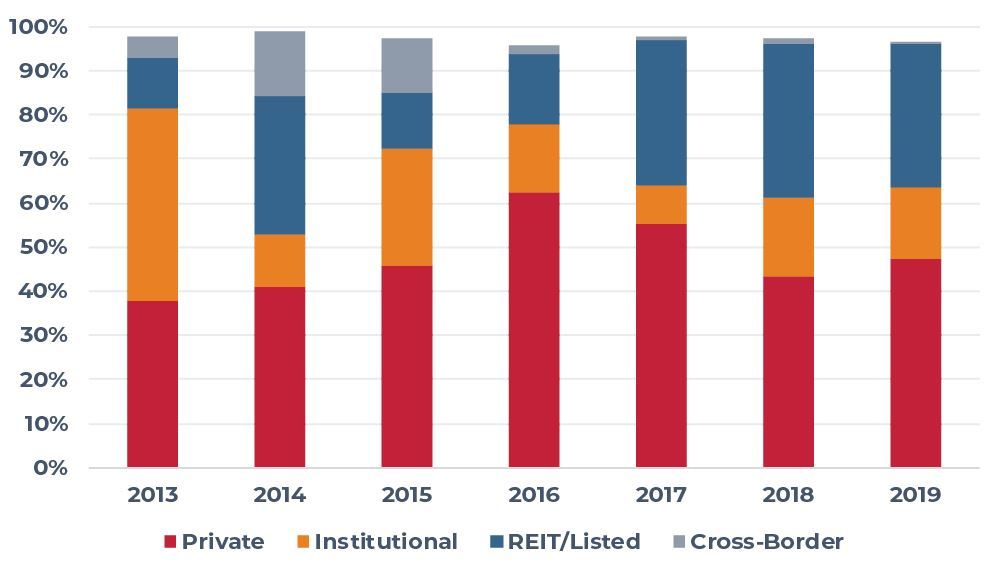
Source: Real Capital Analytics
Pricing pressure remains in place for assets managed by strong operators resulting in additional downward pressure on cap rates, particularly for portfolios managed by a single operator. Cap rates for high-quality, stabilized seniors housing assets remains in the low to mid-5s with the broader markets for good quality assets in the mid-6% range and holding firm. From a development perspective, the return-on-cost for seniors housing range from the mid-7% range to mid-8% range providing an attractive yield relative to cap rates for stabilized assets. The volume of newly built, stabilized assets coming to market remains somewhat limited. This is partially a reflection of investors willingness to sell attractive income producing assets in the current low interest rate environment, but also the lower albeit increasing volume of new stabilized product ready to bring to market. The ramp up in new deliveries did not start in earnest until 2015 with most of the increased volume delivering over the past three years. Most of this new product has leased up well. The expectation is that more high-quality product will be coming to market over the next few years.
Lending remains competitive, but disciplined for both permanent financing and construction loans based on current market fundamentals, especially relative to the apartments sector, where pricing appears much more aggressive with relaxed covenants. Debt terms remain attractive with spreads essentially in line with where the year started. In many cases, refinancing provides an attractive option to selling assets in an environment where there are fewer investment alternatives at comparable current yields. Quality of both the sponsorship and the operating partner are at the forefront of lenders’ minds given current supply-demand dynamics. New supply continues to be an area of concern over the near-term in select markets, but most lenders (and equity investors) are looking at the longer-term demand dynamics and relative yields as offsetting factors.
TOTAL RETURN BY PROPERTY TYPE: NCREIF
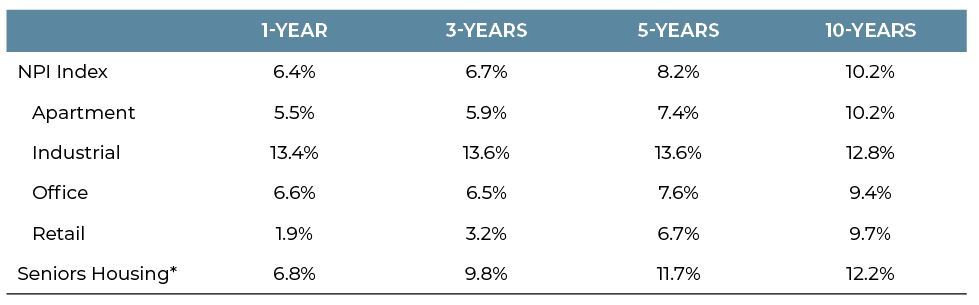
Source: NCREIF; Note: seniors housing is not included in NPI.
* Reflects 127 SH properties totaling $6.2 billion tracked by NCREIF
Barring any dramatic changes to the macro economy or the broader capital markets, it is difficult to see flows into the sector easing in the near-term. While returns have come down across the real estate spectrum, seniors housing continues to deliver an attractive spread relative to the other property types apart from industrial, which has significantly outperformed of late. The underlying fundamentals appear to have stabilized with supply adjusting from the more aggressive pace of building over the past few years while demand continues to march gradually higher. Specific markets where supply issues are more pronounced should be viewed with caution, but many markets remain above the 90% occupancy level with more limited supply pipelines. Site selection, localized market analysis (incl. resident demand and competitive supply) and most importantly operator selection are critical elements for success in today’s environment. From a capital markets perspective, lenders remain competitive yet disciplined in terms of both permanent and construction loan financing with more attention being paid to the strength of both the operator and sponsorship. From an equity perspective, capital continues to flow into the sector with more willing buyers than sellers at pricing that continues to provide an attractive relative spread. In aggregate, 2020 is shaping up to be a year of continued positive capital flows into the sector with fundamental maintaining their relative stability.