STRONG RESILIENCE FOR REGIONAL EUROPEAN OFFICES
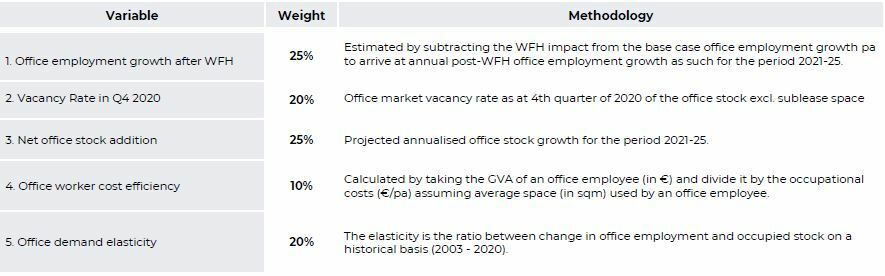
- During the Covid-19 lockdowns, the share of office employees working sometime or usually from home (WFH) more than doubled from 28% in 2018 to 67% in July 2020 across the EU 27 region. To measure the possible impact from WFH we develop a data driven market resilience ranking measures across our 25 office markets using five key variables.
- First of all, our resilience ranking starts with our assumption that, post lockdowns, WFH will return to normal levels but continue its long term upward trend. This is the basis for our estimate that 37% of office workers will WFH sometimes or usually by 2024 across the EU-27 region.
- To arrive at a local market impact from WFH we consider traffic congestion data. Despite a 51% decline in congestion during the lockdowns, we assume that when the lockdowns are being lifted city congestion levels will return to normal. These levels are used to adjust the WFH impact for each market.
- But, the WFH impact on the demand for office space is muted, as we assume that employees will still be attending the office half the time. This means that the need for space compared to current levels will only reduce due to WFH by 5% over the next six years -- less than 1% per annum.
- Separately, the reduction in the office space per employee over the last decade is a confirmation of the long term viability in WFH, supporting the increased conversion of traditional office to flexible and serviced office services.
- Secondly, each market’s year-end 2020 vacancy rate is taken into account. It is assumed that markets with a high vacancy rate have a higher vulnerability to WFH compared to markets that start with a low vacancy rate as they are able to absorb a decline in demand better.
- As the third variable, office stock is expected to grow by an average of only 1.1% across our 25 markets over the next five years. Results vary widely, as CEE markets show much higher increases in stock amplified by above average vacancy rates as well.
- Fourthly, office occupiers are likely to consider office worker cost efficiencies, which show that Nordic and Dutch markets look attractive while London and Paris are vulnerable due to very high prime occupancy costs per worker.
- As the fifth driver, the demand elasticity shows how sensitive occupied stock has been to changes in office related employment in the past. The higher this elasticity the bigger the possible negative impact from declines in demand. London has the lowest elasticity across our markets.
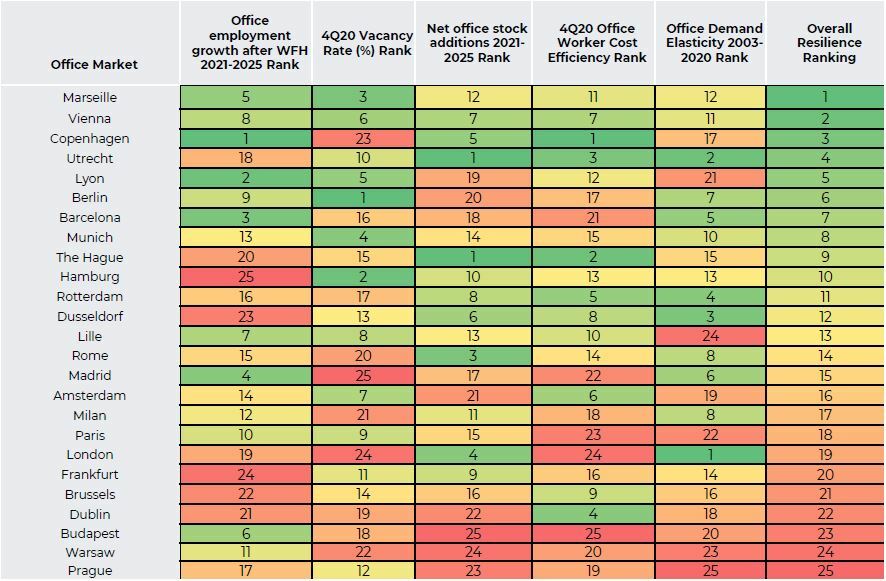
- Finally, bringing all these five demand and supply drivers together in a single office market resilience ranking shows the strength for regional core markets like Marseille, Vienna and Copenhagen and weakness for most CEE markets.
EUROPEAN OFFICE MARKET RESILIENCE MAP (MOST RESILIENT = GREEN & LEAST RESILIENT = RED)
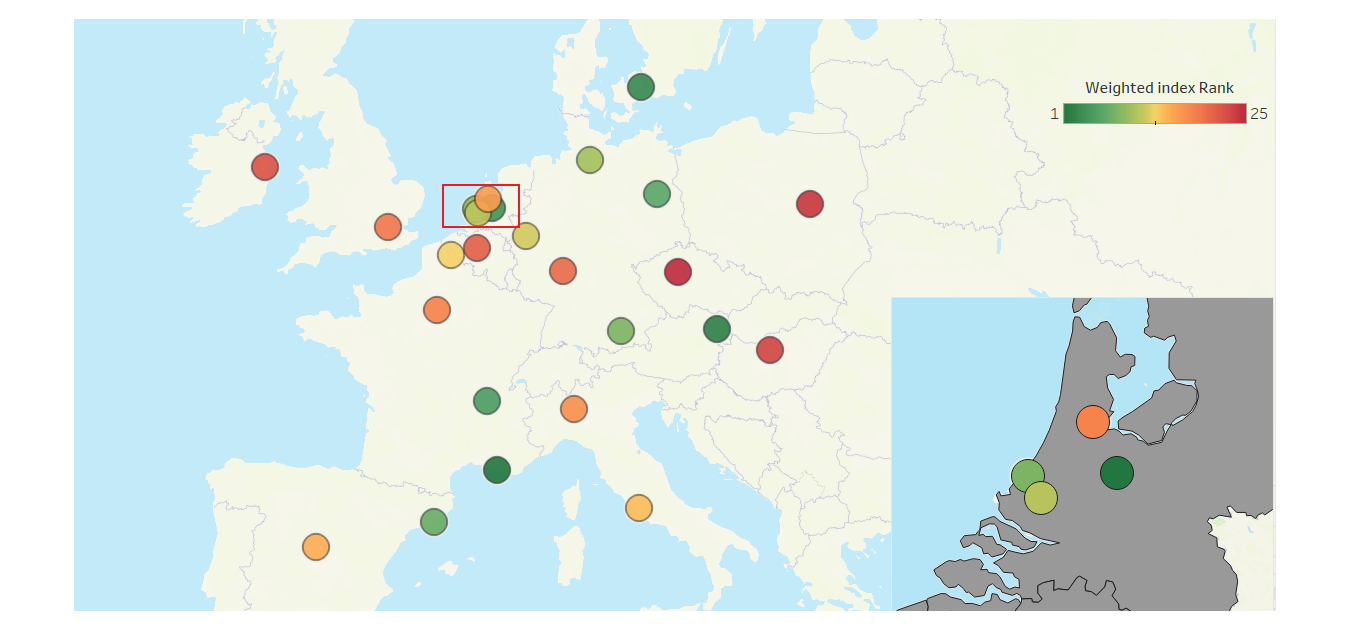 Source: AEW Research & Strategy
WORK FROM HOME FUNDAMENTALS
COVID-19 WFH DRIVEN BY NATIONAL LOCK-DOWNS
- Some historical perspective on working from home (WFH) and the much debated death of the office might help to provide some context on the impact of WFH on the office market.
- About 11% of employees worked sometimes or usually from home in 2019 across the European Union (EU-27). But, there was a wide range across individual countries with 34% in Sweden and only 2% in Italy.
- The Covid-19 impact on WFH is shown by the July 2020 EU-27 level of 45%. The range across countries was between 37% for Sweden and 59% for Denmark. Based on this, it seems that the severity of the national lockdown played a big role in WFH changes.
- Therefore, as the lockdowns are being lifted going forward and vaccination roll-outs progress, a return to national variations as well as a step change increase in the share of WFH to approximately 15% in 2024 seems reasonable.
Employees sometimes or usually working from home by country (as % of total)
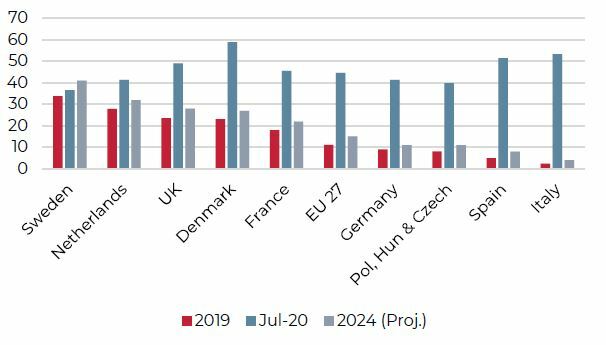
Sources: Eurofound, Eurostat, AEW Research & Strategy
37% OF OFFICE WORKERS PROJECTED TO WFH BY 2024
- 28% of EU-27 office-based employees worked sometimes or usually from home in 2018. This is based on actual WFH data for government (11%), IT (41%), financial (22%) and other business services (35%) and their assumed share in the office employment mix.
- Again, the Covid-19 impact on WFH is shown by the July 2020 EU-27 level of 67%, up nearly 40% from pre-Covid levels. The range across sub-sectors was between 55% for other business services and 73% for IT and financial services.
- Similar to our national WFH projections, as the lockdowns are being lifted going forward and vaccination roll-outs progress a return to pre-Covid sub-sector variations as well as a step change increase in the share of WFH to say 37% in 2024 is projected and used as a basis for our further analysis.
EU-27 Office-based employees sometimes or usually working from home (as % of total)
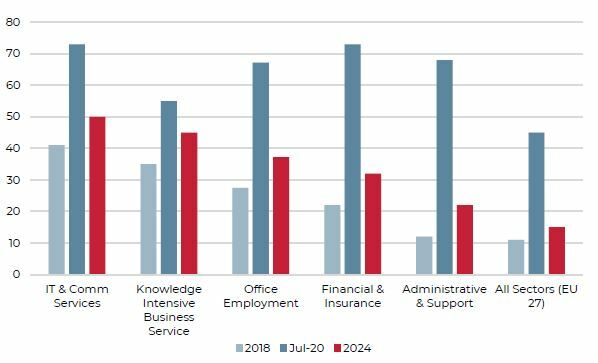
Sources: Eurofound, Eurostat, AEW Research & Strategy
CONGESTION TO DRIVE WFH IMPACT ACROSS CITIES
- City level traffic congestion is seen as a key driver for both employers and employees who can save more time and money by WFH in more congested cities. Therefore, it is used as an adjustment factor.
- Again we start with some historical perspective on traffic congestion and normalise the 2016 IRIX congestion impact factor, which shows Dublin, London and Rome as most and Berlin, Copenhagen and Amsterdam as least congested cities.
- During the last 12 months, IRIX data shows a reduction in congestion of 51% across the 25 cities on our sample. But, there was a wide range across individual cities with only -25% in Munich and a whopping 85% in Barcelona. We suspect that the severity of city lockdowns played a significant role.
- Ultimately, as the lockdowns are being lifted going forward a return to normal congestion levels can be used as a basis to adjust our overall EU-27 WFH impact for each individual city. We notice that Berlin, Copenhagen and Amsterdam are least impacted while Dublin, London and Rome will be more impacted.
Pre-Covid 2016 Congestion Impact Factor & 2020 Covid Congestion Reduction Factor per City
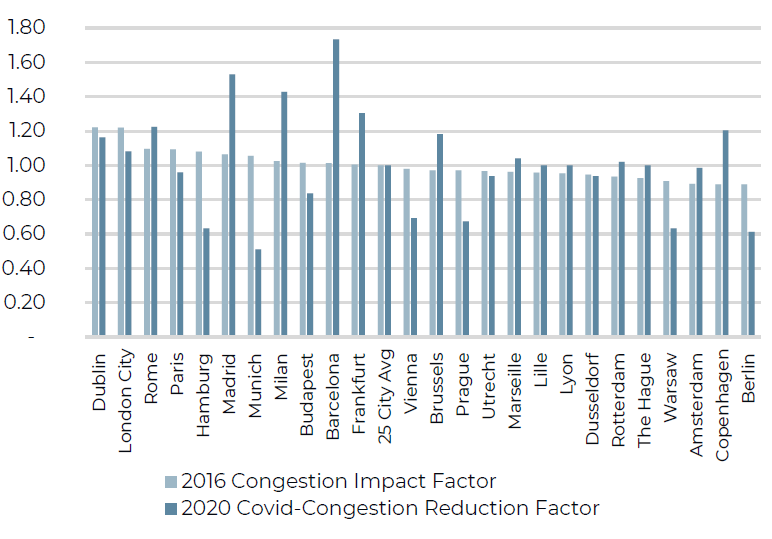
Sources: IRIX, AEW Research & Strategy
OCCUPIER MARKET – DEMAND & SUPPLY
DUBLIN & LONDON OFFICE EMPLOYEES WFH TO INCREASE BY 2024
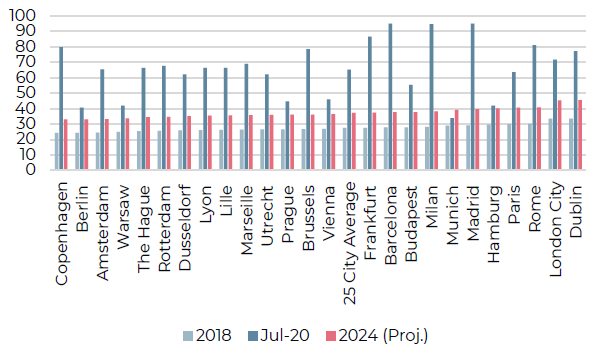
- An increase from the 2018 level of 28% to 37% is anticipated by 2024 in the EU-27 office-based employees working sometimes or usually from home.
- Applying our specific city level traffic congestion factor to the EU-27 WFH office employment impact, the range across cities comes out between a low of 33% for Copenhagen and high of 45% for Dublin.
- This assumes that there is no long term impact from WFH on city level congestions by 2024 from those reported in 2016.
- Across the biggest European office markets, we estimate WFH levels at 45% for London, 41% for Paris, 33% for Berlin, 36% for Brussels and 33% for Amsterdam by 2024.
Office-based employees sometimes or usually working from home by City (as % of total)
Sources: Oxford Economics, Eurofound, Eurostat and AEW Research & Strategy
WFH SHAVES OFF 1% PA FROM EUROPEAN OFFICE DEMAND TILL 2024
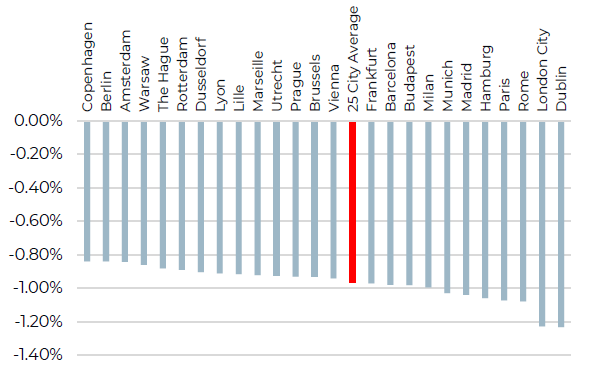
- Despite the near 10% increase in WFH share of office workers from 2018 to 2024, we assume that workers who sometimes or usually work from home will still be attending the office half the time. This means that the need for space compared to current levels will only reduce by 5% over the period.
- As a result, this means that over the six year period there will be reduction in office space requirement from WFH of 1% pa to offset the normal growth in office employment across our 25 European office markets.
- Before considering other factors and solely based on their high levels of traffic congestion on a city level basis, Dublin and London are among the office markets impacted most from WFH. High traffic congestion incentivises both employers and employees to allow for more WFH in the future.
- The most WFH resilient office markets are expected to be Copenhagen, Berlin, Amsterdam and Warsaw as their local traffic congestion is expected to remain low.
WFH-implied reduction in office-based employees from 2018 to 2024 by City (as % pa )
Sources: Eurofound, Eurostat & IRIX, AEW Research & Strategy
REDUCED SPACE PER OFFICE EMPLOYEE CONFIRMS WFH TRENDS
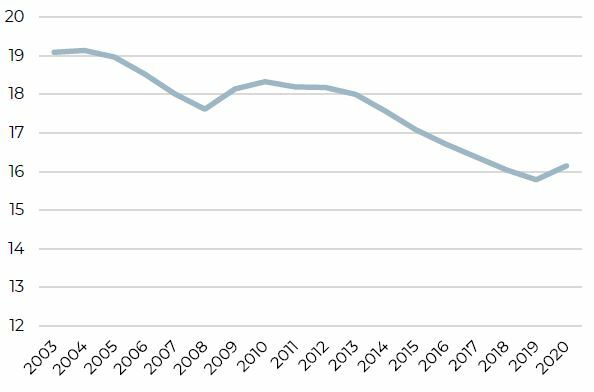
- The continued reduction of the office space per office employee since the early 2000’s can be seen as a confirmation of the long term viability in WFH.
- This has also supported the increased conversion from traditional offices to more flexible and serviced office services.
- Based on historical data across our European office markets, the average space per employee has declined from 19 in 2003 to 16 square meters in 2020.
- This clear downward trend is only interrupted when a recession triggers a sudden decline in workers while the office stock remains stable. This shows an small increase in the space per worker as the immediate post GFC years.
- Finally, it should be noted that the 1% reduction from WFH is also consistent with our 2003-19 historical data.
- There has been an average 80 bps pa gap between the 1.1% pa increase in office stock and the 1.9% pa increase in office employment over the same period. This is very similar to the WFH reduction we expect going forward.
Office Space per employee in sqm over time (25 market average)
Sources: Oxford Economics & CBRE, AEW Research & Strategy
MODERATE GROWTH IN OFFICE STOCK OVER THE NEXT 5 YEARS
- Office stock is expected to grow annually by a moderate 1.1% pa over the next five years in the 25 office markets covered by this report.
- CEE markets such as Budapest and Warsaw, with high current vacancy rates are projected to have an increase of about 4.0% pa in office stock over the period.
- On the other hand, markets such as The Hague and Utrecht are expected to show a decrease in office stock due to conversions to other uses. Such reductions in stock should moderate the impact of a decline in office demand from WFH, even at high vacancy levels.
- Finally, Berlin has the lowest vacancy in Europe but is expected to see an above average stock increase of 1.7% pa.
Future stock growth pa 2021-25 & Q4 2020 vacancy rates
Sources: CBRE, Oxford Economics, AEW Research & Strategy
BETTER OFFICE WORKER COST EFFICIENCIES IN NORTHERN EUROPE
- Northern European markets (e.g. Copenhagen or Amsterdam) stand out as they provide better office worker cost efficiency, ie higher gross value added per office employee at lower occupancy costs.
- In contrast, regional cities in France, Germany, Spain and CEE provide a lower gross value added while have equivalent occupation costs per employee as Northern Europe.
- On the other hand, markets such as London and Paris remain vulnerable due to their very high occupancy costs per employee, despite above average gross value added per employee.
- The ratio of GVA over occupancy per office employee is a good cost efficiency measure for global office occupiers to consider.
GVA per office worker and office occupier costs per sqm

Sources: CBRE, AEW Research & Strategy
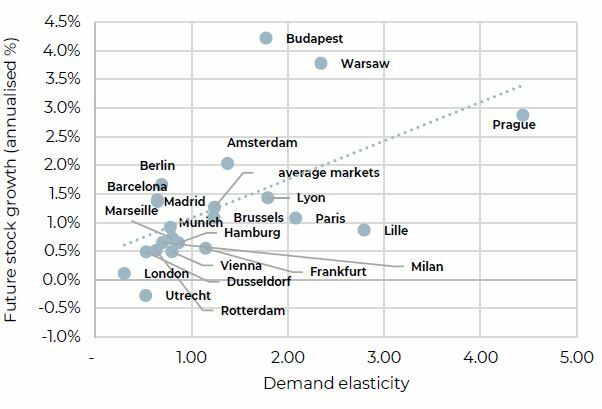
LONDON SHOWS LOWEST STOCK GROWTH AND DEMAND ELASTICITY
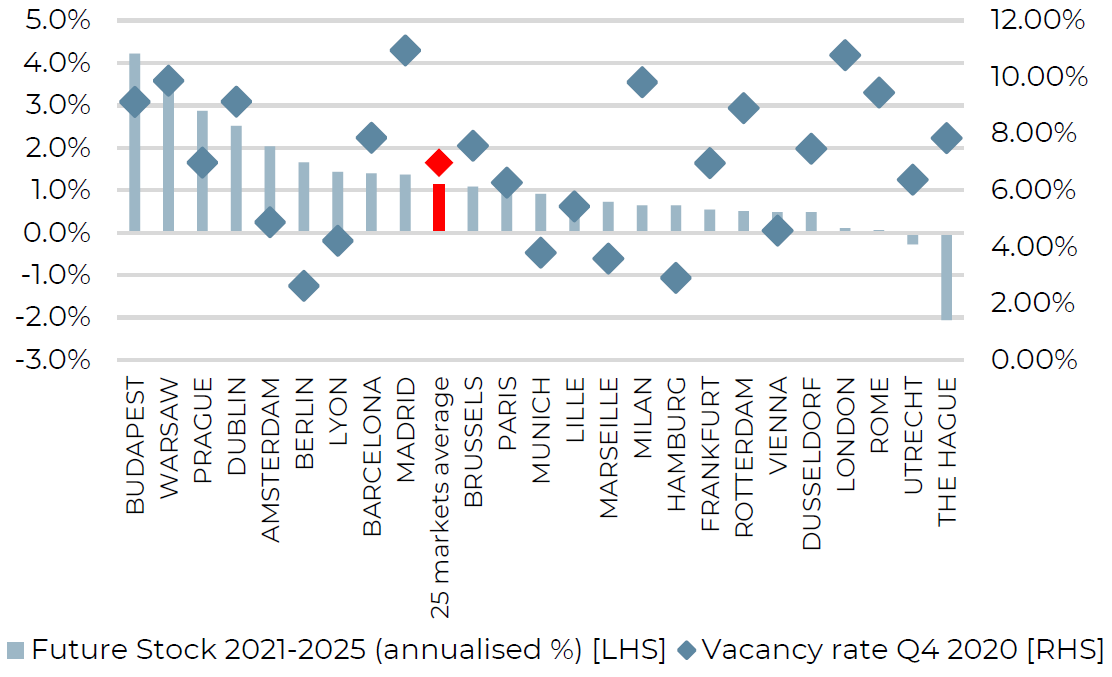
- In the next step of our WFH resilience analysis, we compare historical demand elasticity with the future supply as a percentage of stock.
- The demand elasticity shows how sensitive occupied stock has been to past changes in office related employment. The higher this elasticity the bigger the possible negative impact from declines in office based employment, i.e., growth in WFH.
- The WFH impact on demand can be amplified by markets that are expecting substantial future supply pipelines of new space as % of existing stock.
- Markets such as London, Brussels, Frankfurt and Berlin are expected to see muted future supply pipeline while also benefiting from a low sensitivity to changes in office based employment growth.
- In contrast, the higher right quadrant of the graph shows less resilient CEE markets with both, significant future supply pipelines while also being more sensitive to changes in office based employment growth.
Office Demand Elasticity and Future Stock Growth
Sources: CBRE, Oxford Economics, AEW Research & Strategy
EUROPEAN OFFICE MARKET RESILIENCE RANKING
Our resilience ranking for European office markets is based on a data-driven assessment of the possible impact from working from home (WFH) by weighting five key related demand and supply variables for each of the 25 markets highlighted below.
Sources: CBRE, IRIX, Oxford Economics, AEW Research & Strategy
The information and opinions presented in this research piece have been prepared internally and/or obtained from sources which AEW believes to be reliable; however, AEW does not guarantee the accuracy, adequacy, or completeness of such information.
