The U.S. Economy
The U.S. economy continued to slow during the third quarter of 2019 with preliminary estimates showing annualized real GDP growth of only 1.9%, down slightly from 2% during the second quarter and substantially slower than the 3.1% pace of the first quarter. Additionally, the growth rate for 2018, originally estimated at slightly more 3% for the year, has been subsequently revised downward to only 2.5%. In general, growth in consumer spending continues to surprise to the upside while trade, industrial production, residential construction and business investment disappoints to the downside. Most recently, various measures of the manufacturing sector’s health have collectively pointed to outright recession or near recession conditions in the nation’s production sectors.
Employment growth has also slowed significantly over the past year with the average monthly increase in total employment declining from slightly more than 225,000 at the end of 2018 to approximately 175,000 in September. Sectors showing the sharpest slowdown in new job creation include manufacturing, construction, mining, trade, hospitality and state government, while professional and business services and health care continue to accelerate hiring.
FIGURE 1
YEAR-OVER-YEAR GROWTH IN LEADING INDICATORS INDEX AND PAST RECESSIONS (SHADED AREAS)
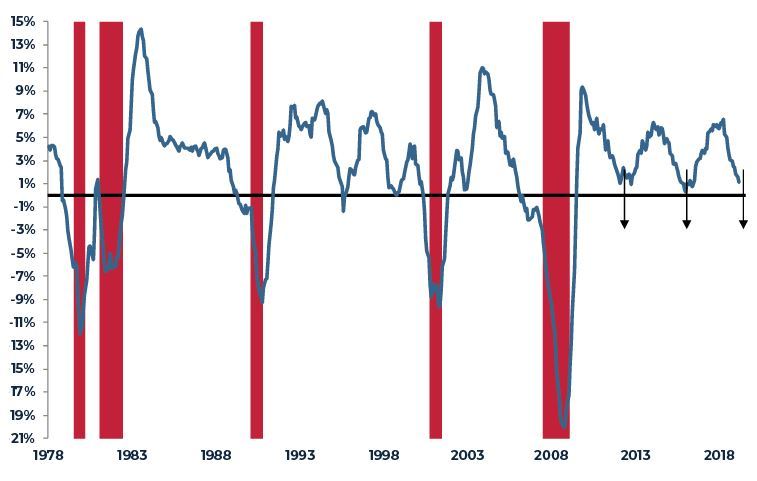
Source: Conference Board, National Bureau of Economic Research
While much has been made of the record length of the current business cycle—124 months of positive consecutive growth as of October—there has been less focus on the distinct sub-cycle slowdowns that have occurred during this period (see Figure 1). More significantly, each experience of slowing economic growth in turn triggered a policy response to stimulate the economy. Slowing growth in late 2012 and early 2013 prompted the Federal Reserve to respond with the third round of central bank balance sheet expansion (Quantitative Easing or QE III). Similarly slowing growth in late 2015 and the first half of 2016 helped bolster the political case for large tax cuts and spending increases at the end of 2017 and the beginning of 2018. With the current slowdown as pronounced as either of the two prior periods, investors and others are left to speculate as to what, if any, policy response may be brought to bear to further extend the current cycle.
Given the large structural deficit created by the 2017/2018 tax cuts and spending increases, it seems unlikely that additional near-term stimulus via these avenues is politically viable. As shown in Figure 2, the trailing 12-month U.S. budget deficit is now approaching $1 trillion (greater than 4% of GDP) at a time when the nation is enjoying the lowest unemployment rate in more than 50 years. More significantly, the nation’s debt service is now running at an annual rate of more $400 billion dollars despite interest rates remaining near historic lows. For its part, the Congressional Budget Office projects that national debt service will exceed defense budget outlays by 2029, further illustrating the significant potential crowding out effects waiting ahead for federal spending.
FIGURE 2
TRAILING 12-MONTH FEDERAL BUDGET DEFICIT AND NET INTEREST EXPENSE
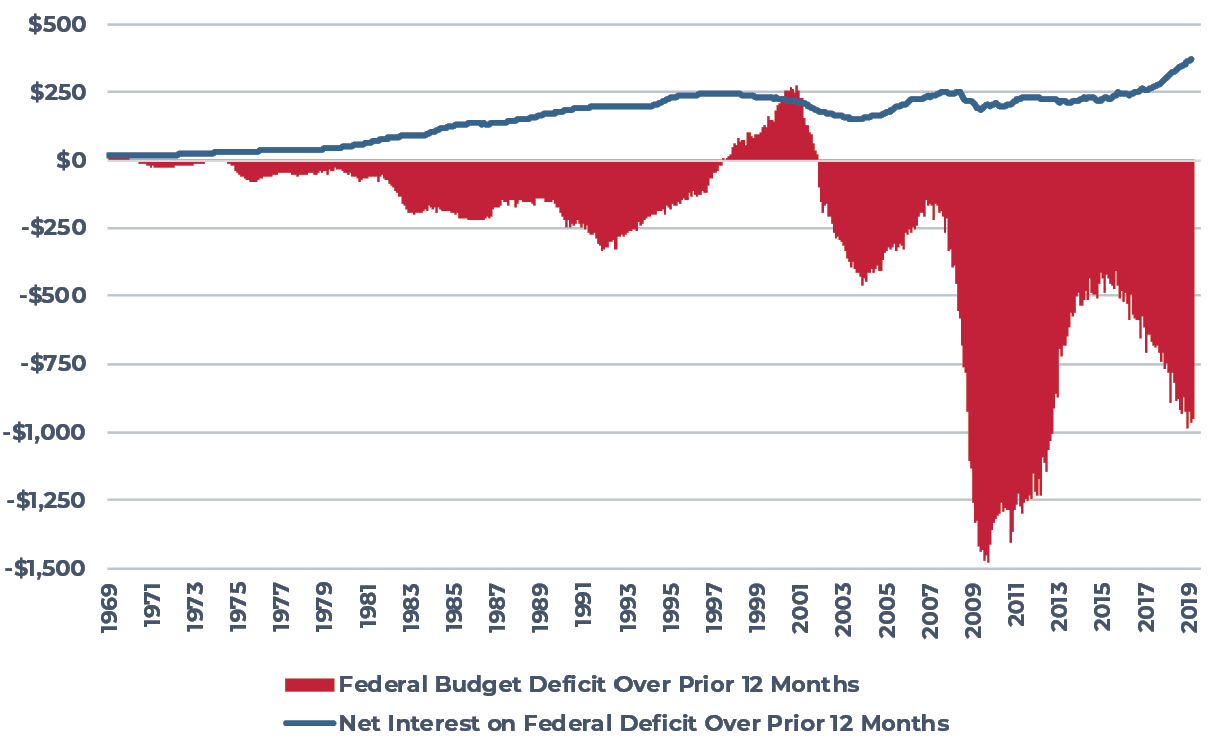
Source: U.S. Department of the Treasury
Absent a fiscal policy response, the current slowdown will again likely be combatted largely through monetary policy and, more specifically, a resumption of the so-called extraordinary monetary policies of the financial crisis period: zero interest policy (ZIRP) and central bank balance sheet expansion (Quantitative Easing or QE). Given this, the Federal Reserve Open Market Committee has abruptly reversed course on their path towards normalization of U.S. monetary policy, cutting overnight lending rates at each of their last three meetings and, beginning in September, slowly expanding their balance sheet through asset (bond) purchases.
FIGURE 3
YEAR-OVER-YEAR REAL GDP GROWTH
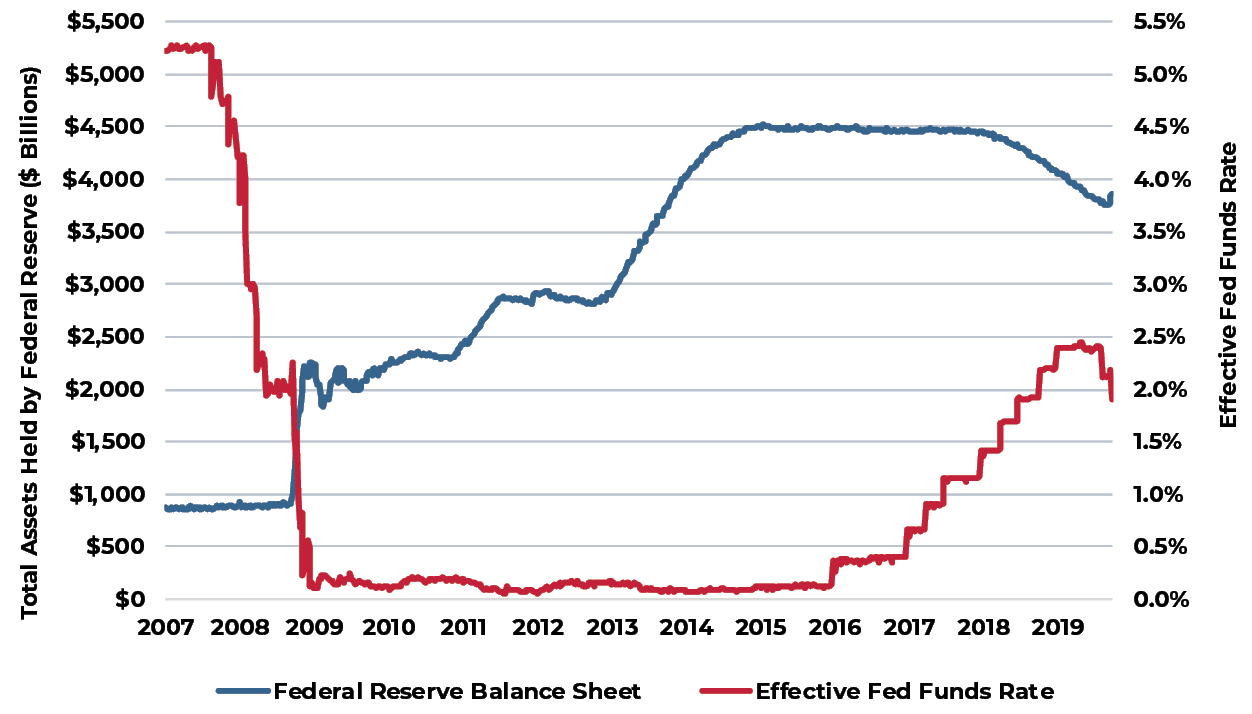
Source: Federal Reserve
Reflecting the apparent restart of these monetary policies by the Federal Reserve, investors now believe that interest rates will remain very low for a very long period. Indeed, the current ten-year Treasury bond yield forward curve shows this benchmark yield returning to only 2.2% by the end of 2029 (figure 4). In this environment, U.S. property yields will likely remain highly attractive to many types of investors both here in the U.S. and globally.
FIGURE 4
U.S. TEN-YEAR TREASURY YIELD FORWARD CURVE
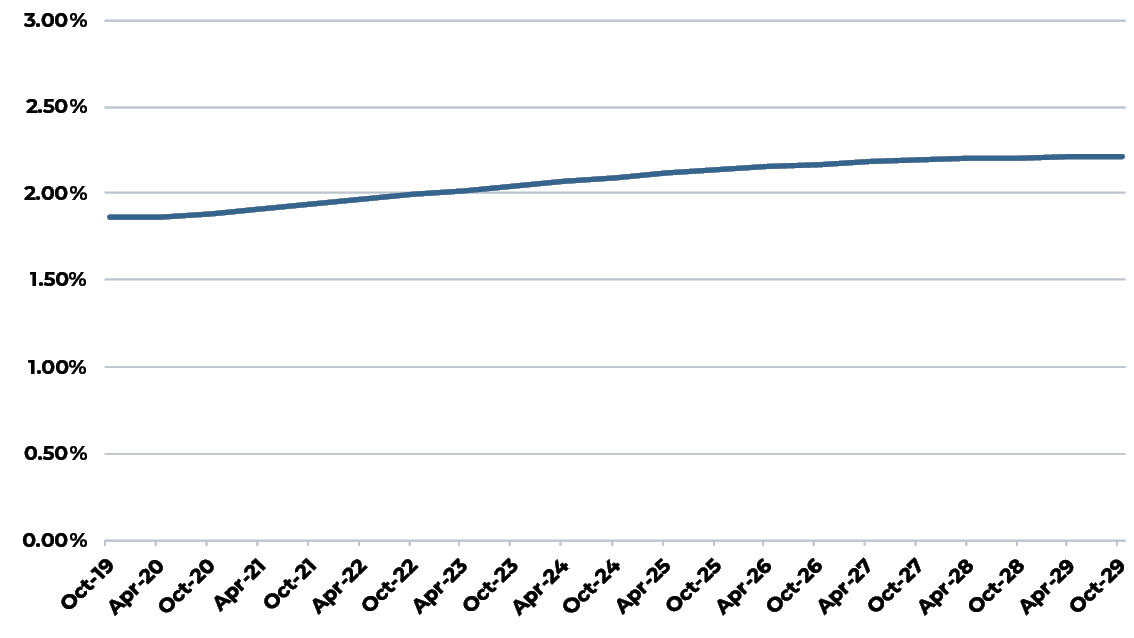
Source: Chatham Financial
The U.S. Property Market
U.S. property market fundamentals remain largely healthy with the one clear exception of weakness in some portions of the retail property segment, particularly within non-trophy regional malls as well as some fashion-oriented centers. Despite this, vacancy and availability rates across all four major property types declined or remained constant during the third quarter, continuing a prolonged period of occupancy and availability improvement resulting from broad supply and demand balance atypical of prior U.S. long-cycle experience where new supply generally surged ahead of slowing demand growth.
FIGURE 5
U.S. APARTMENT MARKET SUPPLY AND DEMAND GROWTH AND VACANCY RATE 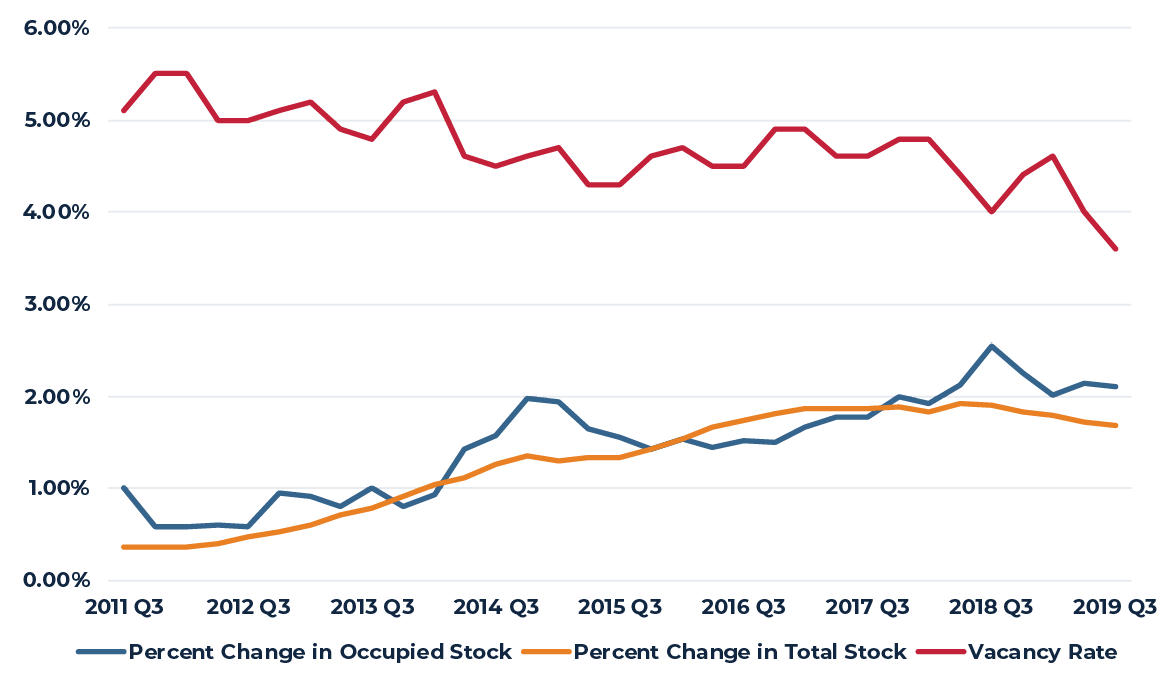
Source: CBRE-EA 2019 Q3
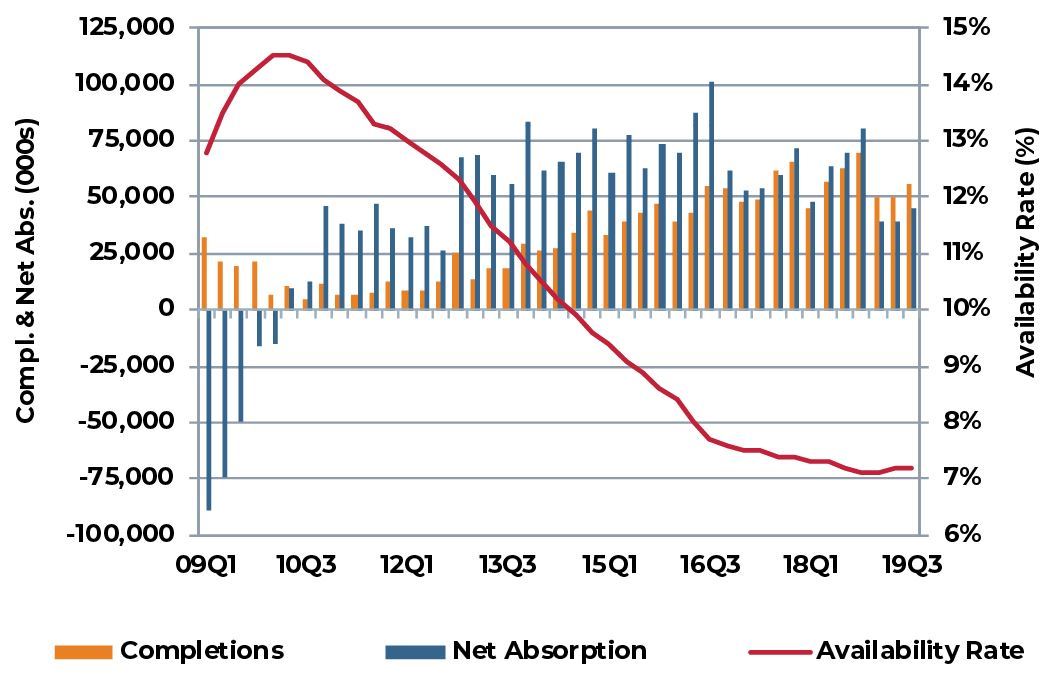
The U.S. apartment market continues to show late-cycle strength with absorption moving about 2% per year while the growth in apartment stock moderates to less than 1.7% per year (Figure 5). As a result, the national average vacancy rate now stands at the lowest level on record (3.6%).
The nation’s industrial property market also remains strong with the national average availability rate remaining near 7% and many individual markets showing little or no availability. The lack of availability has certainly contributed to the marked slowdown in absorption (Figure 6), but the measurable slowdown in global trade and the recent softening of the U.S. manufacturing sector are also contributing to slackening demand over the past 12 to 18 months. In aggregate, supply growth and absorption are broadly balanced with both growing at an annual pace of slightly less than 2%.
FIGURE 6
U.S. INDUSTRIAL MARKET SUPPLY AND DEMAND GROWTH AND AVAILABILITY RATE
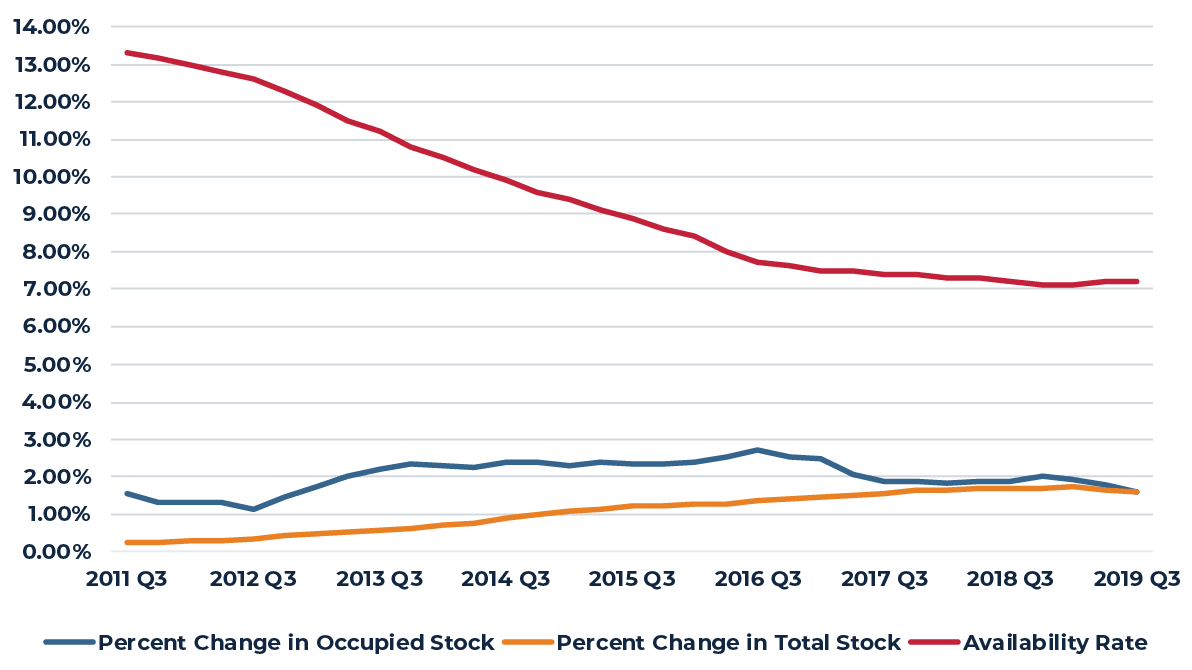
Source: CBRE-EA 2019 Q3
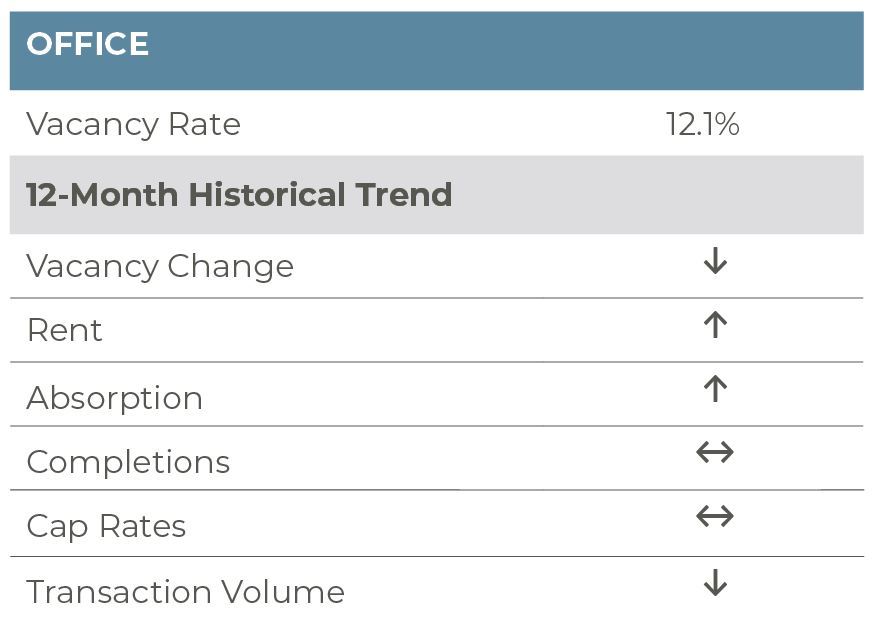
As with the apartment market, the U.S. office market has enjoyed a late-cycle surge in absorption resulting from the pick up in employment growth in 2018 (Figure 7). With employment growth slowing during 2019, we expect this recent acceleration in demand to moderate going forward. Growth in the office stock, however, remains quite tame, particularly relative to prior cycles. As a result, the national average office vacancy rate continues to edge down to approximately 12%, the lowest level since 2001.
FIGURE 7
U.S. OFFICE MARKET SUPPLY AND DEMAND GROWTH AND VACANCY RATE
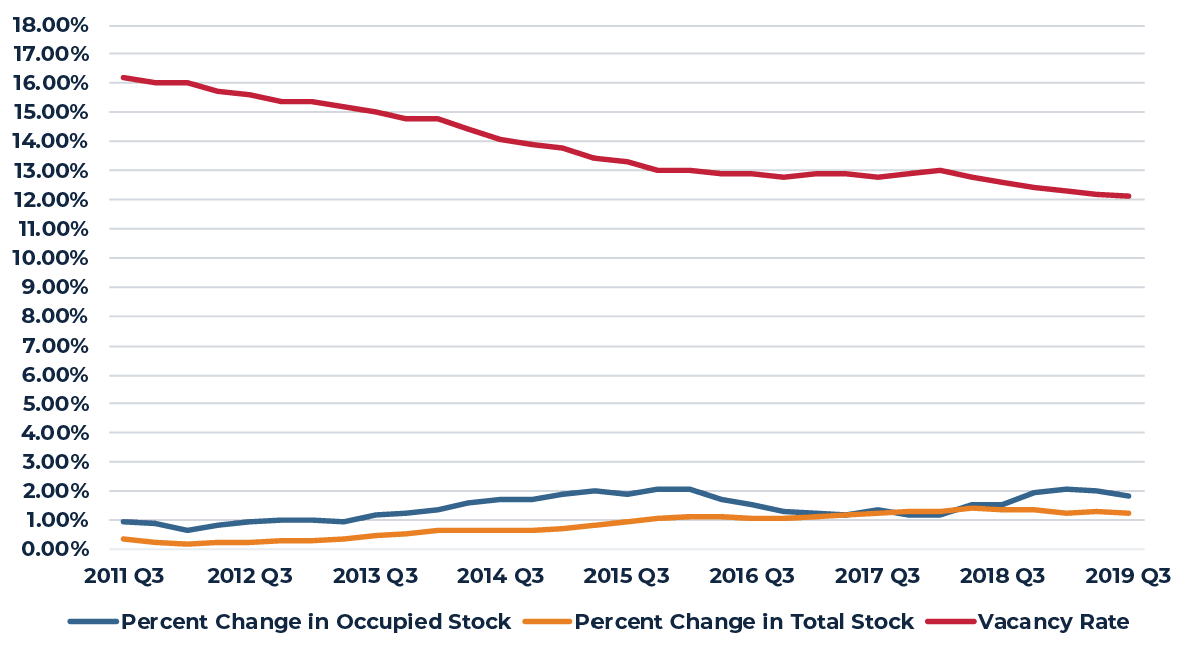
Source: CBRE-EA 2019 Q3
Despite negative headlines and sentiment, the U.S. shopping center sector continues to slowly improve with the average availability rate falling below 9% over the past three quarters, the lowest level since 2007. Both supply and demand growth remain quite weak with annual absorption of 0.8% and growth in shopping center stock of only 0.4%.
FIGURE 8
U.S. SHOPPING CENTER SUPPLY AND DEMAND GROWTH AND AVAILABILITY RATE
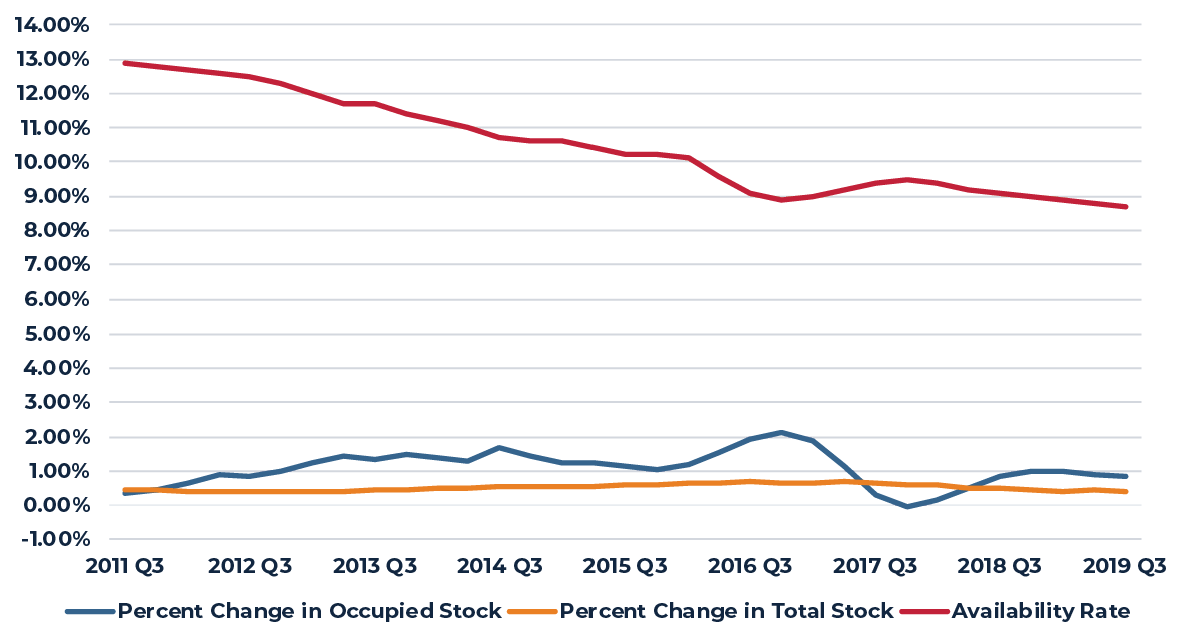
Source: CBRE-EA 2019 Q3
Reflecting the interest rate environment described above, U.S. property yields remain at or near record lows and, in some cases, may trend lower in the near term. Reflecting this, U.S. commercial property continues to produce solid, albeit somewhat more moderate, returns with the NCREIF Property Index (NPI) recording a 1.4% total return for the third quarter of 2019 and a year-over-year return of 6.2%. Performance during the quarter varied from a more than 3.1% total return for industrial properties to 0.2% for retail properties. This variation was even greater for the trailing one-year period with industrial property posting a 13.6% total return as compared to only 1.4% for retail. Going forward, valuation risk remains elevated for retail properties as limited private market trades introduce appraisal uncertainty and public market (REIT) valuations suggest more re-pricing ahead.
FIGURE 9
AVERAGE CAPITALIZATION RATES BY PROPERTY TYPE
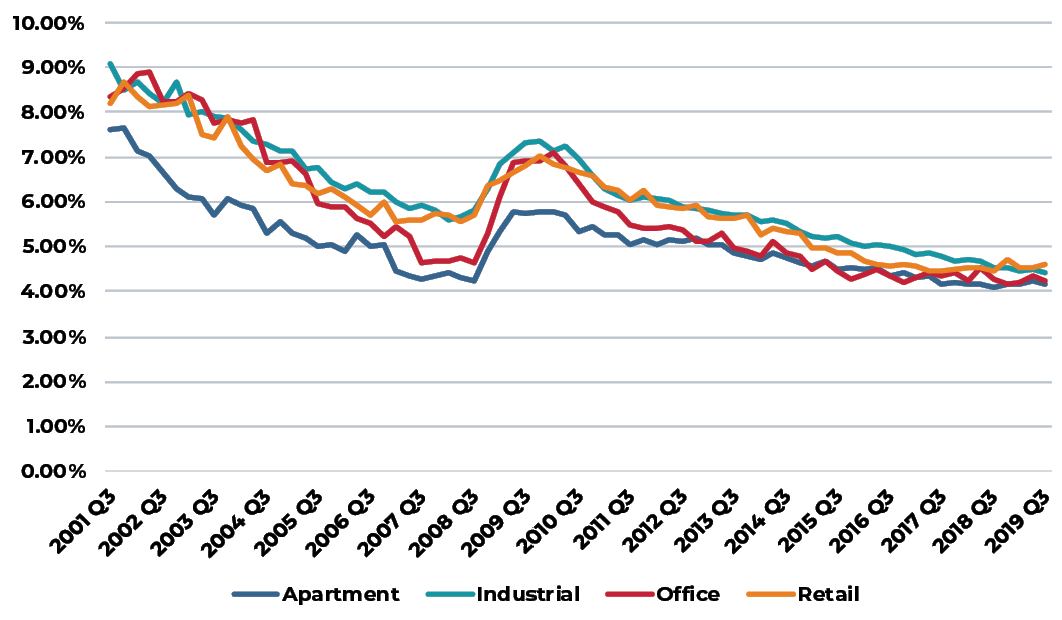
Source: NCREIF
Office
The U.S. office market continued its steady improvement in the third quarter of 2019. Vacancies dropped to 12.1%, down 10 basis points (bps) from the previous quarter and 50 bps from a year earlier. Further, today’s vacancy rate is the lowest in more than 18 years and is 30 bps below the pre-recession low of 12.4%. Remarkably, demand has remained strong during the latter stages of this expansion. Indeed, net absorption has remained over 60 million square feet (msf) over the past four quarters, a marked acceleration from 2018 and 2017 (see chart right). As demand has accelerated, new construction activity has flattened out with roughly 48 msf of new product being completed over the previous four quarters. This is essentially in line with supply growth over the previous two years.
Going forward, completions are expected to total roughly 51 msf in 2020, before trending lower in 2021 (47 msf). Demand will remain positive, although a moderation in space consumption is expected. Vacancies, as a result, many edge higher in the near term. Still, office market fundamentals will remain in equilibrium in the coming quarters, allowing for continued rent growth.
The majority of markets across the country reported tighter conditions in the quarter. Per CBRE-EA, 35 of the nation’s 63 largest markets posted a decline in vacancies in the third quarter of 2019, while five markets reported flat vacancies. Just over
one-third of all markets (23) reported an increase in vacancies, although only 10 of said markets reported a gain of more than 50 bps. Meanwhile, on a year-over-year (YOY) basis, 49 of the nation’s 63 largest markets posted flat or declining vacancies. Only five markets—Hartford (HAR, 17.7%, 100 bps), Nashville (NAH, 11.0%, 110 bps), Indianapolis (IND, 14.1%, 160 bps), Jacksonville (JAC, 14.3%, 170 bps) and Oklahoma City (OKL, 13.3%, 230 bps)—posted an increase in vacancies of 100 bps or larger YOY. Among the five aforementioned markets, demand was negative in all but JAC, where demand was flat; meanwhile, supply growth was well above average in NAH, JAC and IND at 4.1%, 2.0% and 1.6% of inventory, respectively, which also contributed to the increase in vacancies.
Sacramento (SAC, 11.6%, -270 bps), San Jose (SJ, 8.3%, -240 bps) and Austin (AUS, 7.1%, -200 bps) registered the most significant improvements in vacancy YOY. In SAC, more than 1.2 msf of space has been absorbed over the previous four quarters, driving the overall improvement in vacancy. As is typical in the state capital, various government agencies drove leasing. Of note, however, WeWork also contributed to leasing, signing its first two leases (145,000 sf) in the market. This, of course, may be a risk going forward, given WeWork’s failed IPO. In the broader picture, however, SAC is at significantly less risk than a market like New York City, where WeWork is the largest office tenant, occupying 8.9 msf of space (2.2% of the market and 62% of all coworking space). That said, AEW will continue to monitor WeWork’s leasing status in all markets. Finally, in SJ and AUS, tech remains the dominant driver with Google (SJ, AUS), Uber (SJ), Indeed (AUS), and Apple (AUS) taking down large blocks of space. Robust demand in these tech markets is leading to outsized rent growth.
DEMAND IS SURPRISINGLY STRONG LATE CYCLE
(Four-quarter moving average, millions of square feet)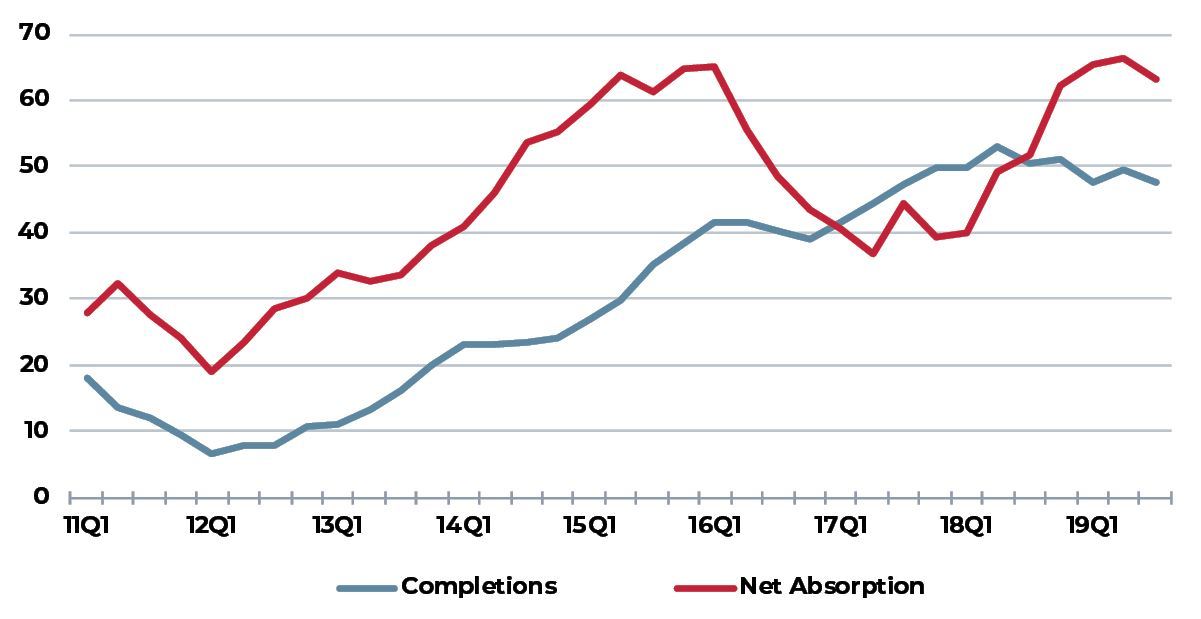
Source: CBRE-EA
MARKETS WHERE DEMAND IS OUTPACING SUPPLY BY A WIDE MARGIN
(Four-Qtr Suppy & demand as a share of RBA, Blue cells supply is below the U.S. avg.; red cells demand is greater than avg.)
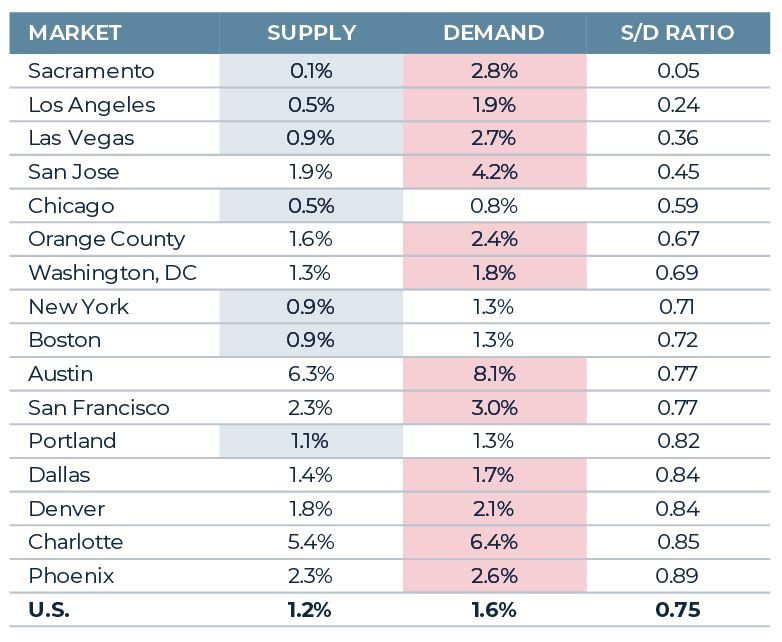
Sources: CBRE-EA, AEW Research
Apartment
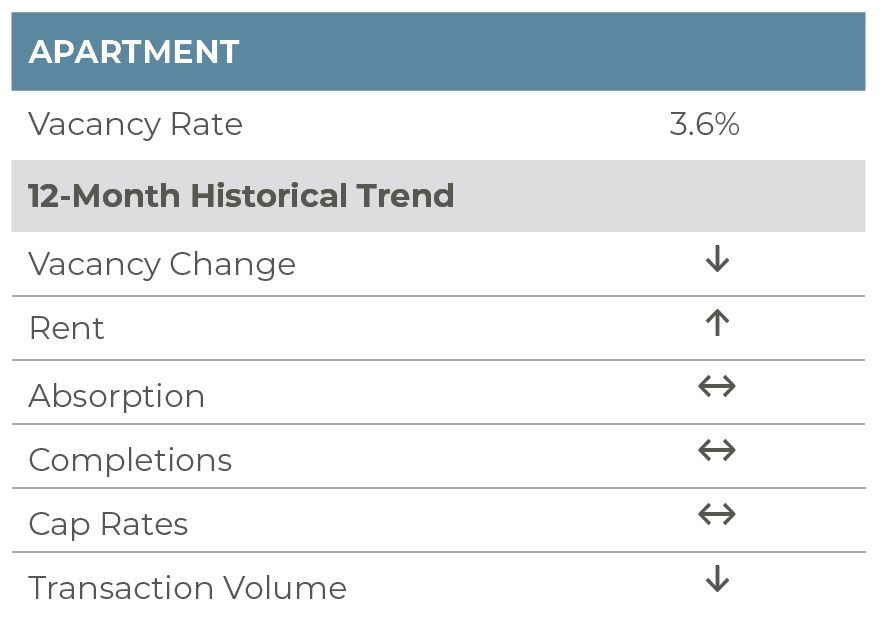
The strong second-quarter performance in the apartment market carried over into the third quarter of the year. Vacancies dropped to 3.6% in the quarter, down 40 basis points (bps) from the second quarter and a year earlier. Remarkably, this is the first time vacancies have been below 4% since mid-2001. Nearly 116,000 units were absorbed in the quarter on a net basis, slightly less than the 127,000 units absorbed in the third quarter of last year, but more than double the average third-quarter performance over the 2009-2017 period. Further, demand remains well ahead of new supply. Roughly 66,000 units were completed in the quarter while 256,000 units have been delivered over the previous four quarters, well below the 115,000 (2019Q3) and 308,000 units (past year) absorbed over the same periods. Given the strong demand performance, rents continued to climb in the quarter, reaching a new peak of over $1,700 per unit per month. Year-over-year (YOY) rent growth totaled 2.9% in the quarter, an acceleration from the 2.6% and 2.2% growth recorded in the third quarters of 2018 and 2017, respectively.
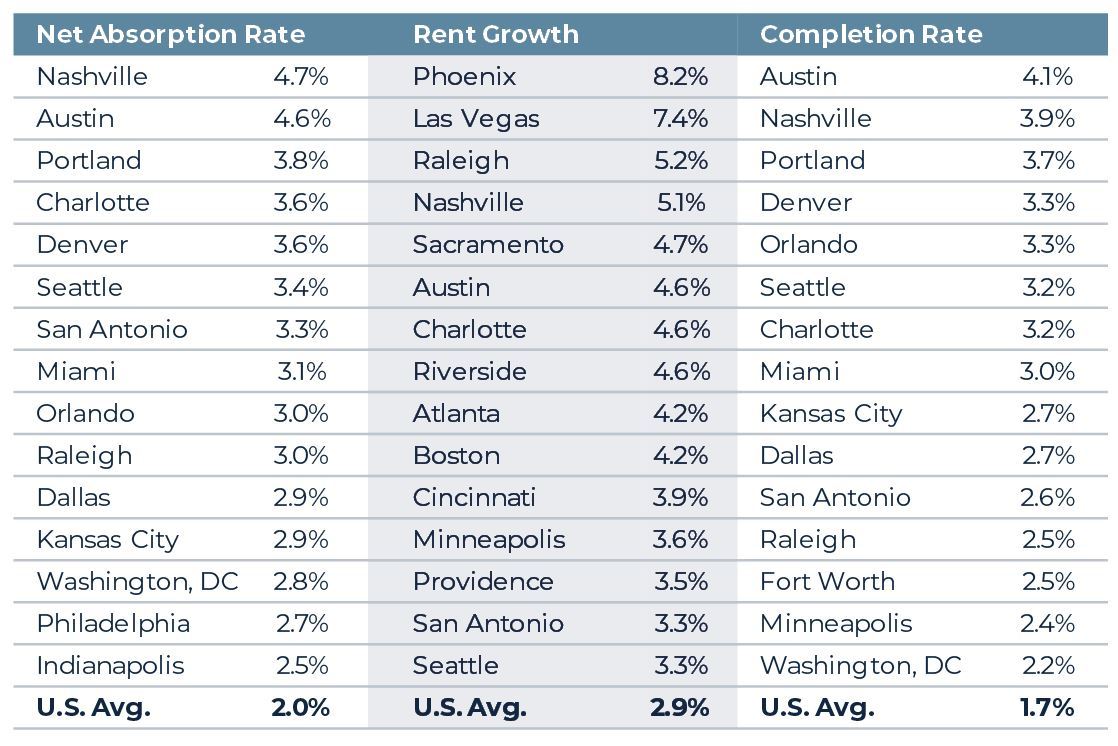
Apartment demand and rent growth have been strongest in the South and among tech markets. In the South, Nashville, Charlotte, San Antonio, Miami, Orlando and Raleigh posted YOY net absorption rates of 3.0% or better, ranking in the top ten markets for demand and far outpacing the national average of 2.0%. Austin, Portland, Denver and Seattle were among established and emerging tech markets in the top ten for demand strength with net absorption rates ranging from 4.6% in Austin to 3.4% in Seattle. YOY rent growth in Raleigh (5.2%), Nashville (5.1%), Austin (4.6%) and Charlotte (4.6%) were again in the top ten, besting the U.S. average (3.4%) by 120 bps or more. Also showing strong performance and ranking in the top ten were Phoenix (8.2%), Las Vegas (7.4%), Sacramento (4.7%), Riverside (4.6%), Atlanta (4.2%) and Boston (4.2%).
Noticeably absent from the top ten in terms of demand and rent growth are the larger California markets, specifically Los Angeles (LA), Orange County (OC), San Jose (SJ), San Francisco (SF) and San Diego (SD). All of the aforementioned markets reported below-average demand and rent growth on a YOY basis; however, both demand and rent growth were positive. We believe the slowdown in rent growth is temporary and is not attributable to California’s recently enacted rent control legislation as the slowdown is largely centered on newly delivered product, which would be exempt from rent control. California’s rent control law is fairly watered down relative to New York’s, where we have more concern regarding future rent growth. Instead, we believe the slowdown is likely the result of properties moving through lease up. Overall, all of the aforementioned markets remain healthy with low vacancies. Indeed, vacancies in LA, OC and SD were a mere 3.3% in the third quarter, while SJ and SF recorded vacancies of only 3.4% and 3.6%, respectively. Vacancies among the markets were at or below the U.S. average and all but SD reported flat or declining YOY vacancies. Overall, this points to the exceptional strength across all markets, even markets that may be exhibiting some moderation in demand and rent growth.
As a matter of fact, only two markets—Providence (2.9%, +50 bps) and Columbus (3.9%, +60 bps)—reported a YOY increase in vacancies over 20 bps.
Going forward, continued economic growth and household formation should support ongoing rental demand. Meanwhile, supply is peaking. Vacancies, as a result, should be stable to declining, which should support future rent growth. Rents in nearly half of the top 50 markets are projected to grow by 4% or better on an annual basis in 2019; longer term, growth will moderate towards 3%. Markets expected to outperform are, unsurprisingly, in the Southeast, Southwest and/or are tech markets. AEW expects Austin, Phoenix, Boston, Charlotte, Las Vegas, Orlando, the Bay Area and Raleigh/Durham to be among the top performers. Potential rent control legislation could alter this outlook; however, outside of New York, there is little risk to date, particularly in the markets highlighted above. Indeed, legislation passed in California and Oregon is fairly benign for apartment owners, as rent growth limits are generally above what owners are underwriting today.
TOP 15 MARKETS - YEAR-OVER-YEAR KEY MARKET INDICATORS
Sources: CBRE-EA, AEW Research
Note: Includes markets with 100,000 units and larger.
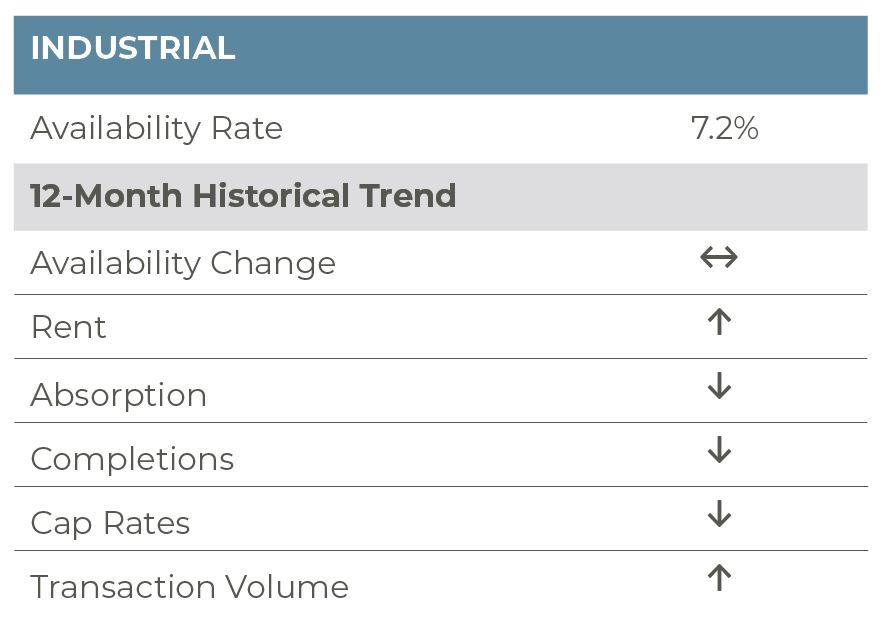
Industrial
Industrial market fundamentals remained strong in the third quarter of 2019. Availability stood at 7.2% for the second consecutive quarter; this also matched the third-quarter of 2018 level. Overall, availability has fluctuated very little over the past five quarters. As was the case in the previous quarter, demand and supply were tempered. Roughly 45 million square feet (msf) of space was absorbed in the third quarter; this is well below the 70 msf absorbed in the third quarter of 2018. Meanwhile, nearly 56 msf of new supply was completed, a meaningful reduction from the 63 msf added a year earlier. As we have stated in the past, we believe the slower leasing activity in recent quarters is the result of today’s exceptionally tight fundamentals. Availability has not been this low since 2000. Today’s tight conditions continue to support robust rent growth; industrial rents increased 6.7% year-over-year in the quarter.
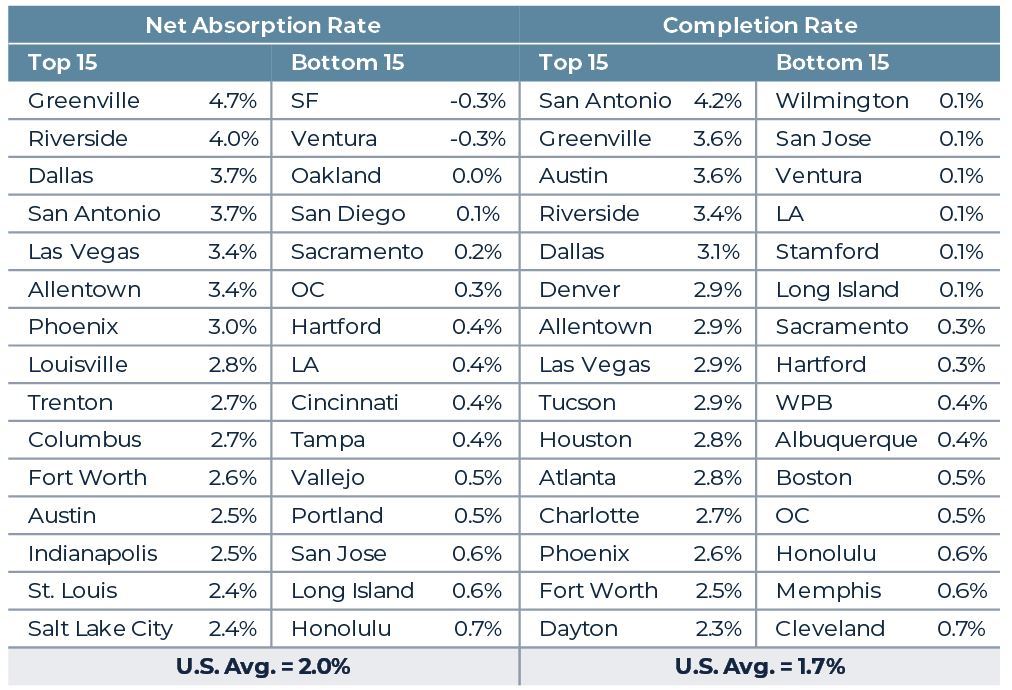
With respect to demand, the top performing markets were varied. Only two of the nation’s largest markets ranked in the top 15 based on their four-quarter net absorption rate. Riverside and Dallas, the nation’s 5th and 6th largest markets, reported net absorption rates of 4.0% and 3.7%, respectively, the second and third highest in the nation. Greenville, the nation’s 32nd largest market, reported the strongest demand rate at 4.7%. Surprisingly, Greenville was also a leader in total square feet absorbed with a one-year net absorption tally of 9.5 msf as of 2019Q3, the sixth largest absorption among the nation’s 63 largest markets. The strength of the Greenville market is being driven by the automotive, pharmaceutical and healthcare sectors and the market’s proximity to Raleigh, Charlotte, Atlanta and Charleston. The remainder of the top 15 markets for demand included only four of the largest 20 markets—Phoenix (3.0%), Fort Worth (2.6%), Indianapolis (2.5%) and St. Louis (2.4%)—while smaller markets, ranking 40th-60th in size, rounded out the top 15 markets. These markets included San Antonio (3.7%), Allentown (3.4%), Las Vegas (3.4%), Trenton (2.7%), Austin (2.5%) and Salt Lake City (2.4%).
On the supply side, Greenville posted the second largest increase in supply at 3.6% of inventory. Noticeably, many of the markets that reported the strongest demand also reported the greatest increase in supply; likewise, many of the markets that produced the smallest increase in supply also yielded the softest demand, again suggesting that perhaps the more tempered demand seen in the market today is due to a lack of available quality product.
Overall, the current supply and demand balance across markets has yielded very tight fundamentals. Indeed, all but two markets, Houston and Nashville, are reporting availability rates well below their historical averages (1990-2018). Further, 33 markets reported availability below 7%.
Going forward, industrial market fundamentals are expected to remain healthy. Both supply and demand are projected to be relatively balanced, keeping the market in equilibrium. In the near term, rent growth will likely be strongest (5%-8%) in secondary markets; however, major West Coast and East Coast markets will experience still healthy growth in the 4%-5% range. Longer term, we expect growth across all markets to moderate towards 3%.
ANNUAL SUPPLY AND DEMAND BY MARKET AS OF 2019Q3
Sources: CBRE-EA, AEW Research
CBRE-EA INDUSTRIAL MARKET FUNDAMENTALS
Source: CBRE-EA
Retail
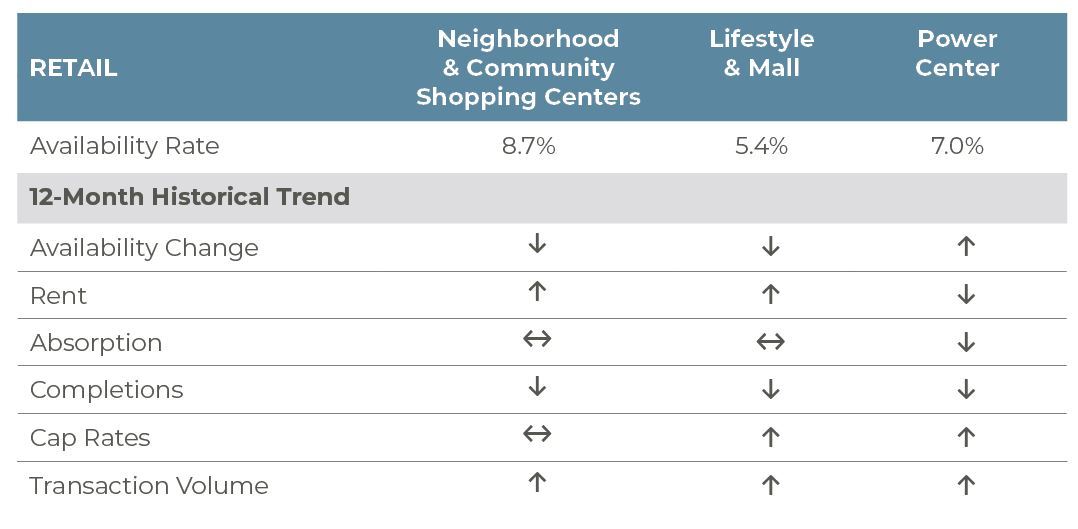
The broad retail market continued its modest improvement in the third quarter of 2019. Availability dropped to 6.1%, down 10 basis points (bps) from the previous quarter and 30 bps from a year earlier. Availability was driven lower by improving conditions in the retail market’s largest segment, the neighborhood and community shopping center sector (NCSC). The NCSC availability rate declined to 8.7%, down 10 bps from the previous quarter and 40 bps from a year earlier. Meanwhile, in welcome news, power center (PC) and lifestyle and mall (L&M) availability showed signs of stabilizing. PC availability remained at 7.0% for the third consecutive quarter while L&M availability stood at 5.4% for the second quarter in a row.
Demand in all three retail subsectors was positive in the quarter, again with the NCSC sector leading the way. Roughly 4.3 million square feet (msf) of NCSC space was absorbed in the quarter, while L&M and PC demand was more tempered at 500,000 square feet (sf) and 144,000 sf, respectively. On a rolling four-quarter basis, demand as a share of inventory has been relatively flat in the PC space while the NCSC absorption rate has lingered around 0.8%-0.9% since the fourth quarter of 2018. Within the L&M segment of the market, demand spiked in late 2018, yielding a four-quarter rolling absorption rate of 0.8% in the first quarter of 2019, the strongest demand since 2015. Since then, the L&M absorption rate has moderated to 0.5% of inventory. Meanwhile, new supply has essentially been a non-issue across the board. Overall, all three property types saw four-quarter deliveries as a share of inventory total only 0.4%-0.5%, well below the 1.1% historical average for the L&M and NCSC sectors and the 2.2% average for the PC sector.
Going forward, despite uncertainty surrounding the trade war, many analysts expect a stronger holiday shopping season (November to January) to conclude 2019 and usher in 2020. Indeed, projections for year-over-year retail holiday sales growth range from a high of 5.3% to a low of 3.8%. Forecasts from Deloitte (4.5%-5.0%), AlixPartners (4.4%-5.3%) and the International Council of Shopping Centers (ICSC, 4.9%) are on the higher end of the range while the National Retail Federation (NRF) forecast (3.8%-4.4%) is on the lower end of the range. Of note, all four forecasts exceed the 3.1% increase in holiday sales for last year. All of the aforementioned prognosticators cite a number of reasons for the stronger outlook for holiday sales this year, including the still-strong U.S. labor market, record low unemployment, favorable consumer confidence and the fact that last year’s growth was held back by the government shutdown and the weak December stock market performance.
Unfortunately, according to all projections, e-commerce sales growth is expected to outpace traditional brick and mortar growth with e-commerce sales growing between 11%-18%. Deloitte expects e-commerce sales to increase between 14% and 18% this holiday season, while the NRF is anticipating growth between 11% and 14%. Further, the NRF expects e-commerce will account for between 22% and 23% of all retail transactions this season. Despite the strength in e-commerce, we anticipate brick and mortar will have a solid holiday season. Indeed, according to ICSC’s Survey of Holiday Shopping Intentions, physical stores will continue to play a vital role for holiday shoppers. According to the ICSC survey, 97% of shoppers said they plan to shop at a retailer that has a physical presence, with 82% of those consumers saying they are likely to make an additional purchase in-store while picking up an online purchase. Given this result, ICSC expects retailers with good omnichannel strategies to fair well this holiday season.
With a healthy holiday outlook, we expect availability will nudge lower near term, with minimal new supply and positive, albeit modest, demand expected. Still, rent growth will be restrained, likely remaining below 2%, as retailers use recent bankruptcy announcements to their advantage in lease negotiations. Longer term, by 2021, rent growth should gain traction, but will likely remain in the 2-3% range, the slowest anticipated growth among the property sectors.
RETAIL AVAILABILITY BY MARKET SEGMENT
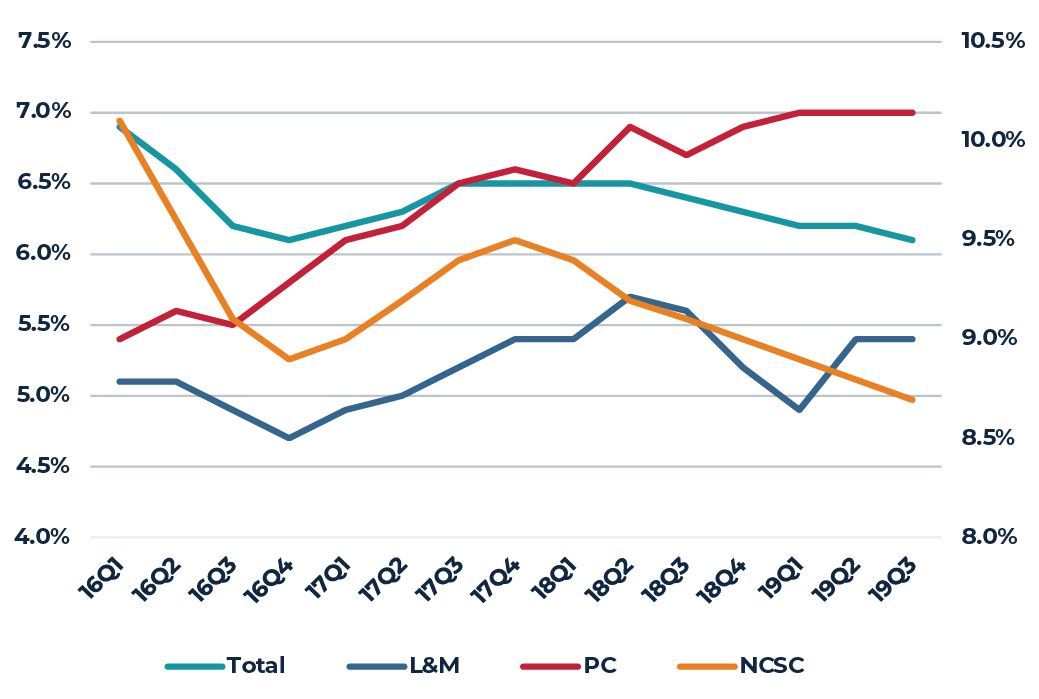
Source: CBRE-EA
Capital Markets
As the current cycle grows longer by the day, investors are being more choosy in their investment decisions and the apartment and industrial sectors are benefiting from this trend. As AEW has cautioned in the past, office is feeling the weight of high cap ex requirements, which is creating a dichotomy in the investment arena. Investors are actively bidding up properties that have been updated while shying away from properties that they perceive to have high go-forward cap ex requirements. Meanwhile, investor sentiment towards retail is perhaps not as negative as the data would indicate.
Overall, according to Real Capital Analytics (RCA), $151 billion in industrial, apartment, office, retail, hotel, development sites and seniors/health care properties changed hands in the third quarter of the year, down 6% year over year (YOY). The overall decline in transaction volume was driven by a virtual absence of entity trades as both individual and portfolio volumes increased on a YOY basis. Per RCA, entity-level sales were challenged as REIT takeovers were viewed less favorably relative to a year ago.
The industrial sector was the clear winner in terms of transaction volume with over $40.3 billion in industrial properties changing hands in the third quarter of 2019, up 63% from a year earlier. Much of the increase in sales volume was attributed to two large portfolio acquisitions by Blackstone from GLP, which totaled $18.7 billion. Still, individual asset sales increased 15.7% YOY to $15 billion, the greatest third-quarter volume ever recorded by RCA and the greatest increase in volume among the property types. Apartment, which again is a favored product type among investors today, reported nearly $46 billion in trades, down 7% YOY; however, here too, individual transaction volume was strong, increasing 8% YOY. Retail sales composition mimicked the apartment sector with increasing individual asset transactions (+2% YOY), but weaker portfolio sales. Overall, $14.4 billion in retail properties changed hands, down 55% YOY. Finally, nearly $33 billion in office properties were sold in the quarter, down 7.0% YOY; of note, all categories of office trades, i.e. individual, portfolio and entity-level, transactions were lower on a YOY basis.
Meanwhile, with respect to pricing, the RCA Commercial Property Price Index (CPPI) for all property types rose 6.7% YOY. Not surprisingly, given heightened investor interest in the industrial and apartment markets, pricing gains in both sectors surpassed all other sectors. According to RCA, the industrial CPPI increased 11.9% YOY while the apartment CPPI advanced 7.7% YOY. Office and retail repeat pricing remained positive, but more modest at 3.1% and 1.4% YOY, respectively. Cap rates across all property types remained flat or declined 10 basis points YOY, per RCA; this is slightly different than the institutional cap rates reported by NCREIF. According to NCREIF, the market value-weighted cap rates for office (4.22%) and apartments (4.15%) were roughly flat on a YOY basis in the third quarter of 2019, while industrial and retail cap rates moved in opposing directions. Industrial cap rates declined 10 bps lower YOY to 4.42%, while retail cap rates nudged up roughly 20 bps YOY to 4.60%.
Per NCREIF, property returns continued to moderate in the most recent quarter. The total NCREIF return was 6.24% over the previous four quarters, a more tempered return relative
to the 7.16% one-year return ending 9/30/2018 and the double-digit returns reported in the early stages of the recovery. Once again, the industrial sector led the way with a total one-year return of 13.64% in the third quarter. The office and apartment sectors followed with returns of 6.54% and 5.39%, respectively. The one-year retail return, meanwhile, was only 1.41%. The one-year income return across the four core property types remained in a narrow range between 4.28% and 4.73%, while the appreciation return had significantly greater dispersion. Appreciation was strongest in the industrial sector, tallying 8.61% on a one-year basis, followed by office and apartment at 2.03% and 1.08%, respectively. Retail properties, meanwhile, depreciated over the year, with NCREIF reporting a negative capital return of (3.20%).
Going forward, total returns are expected to moderate further. Indeed, the third-quarter 2019 PREA consensus survey shows an expected annual total NPI return of roughly 5.5% over the next three to five years. While this is again a marked deceleration from the double-digit returns a few years ago, we believe real estate returns will remain competitive with other asset classes.
PREA CONSENSUS SURVEY - 2019 Q3
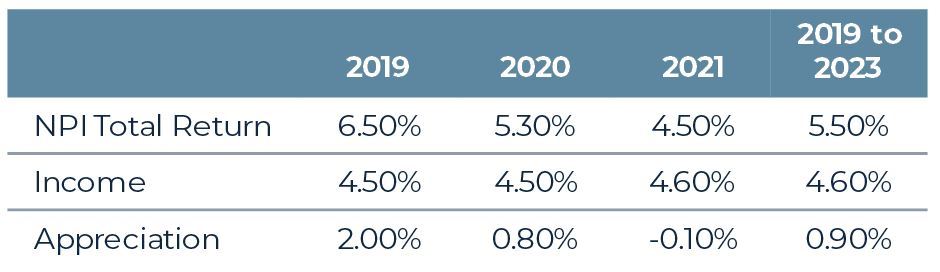
Source: PREA
RCA TRANSACTION VOLUME
(Billions of USD)
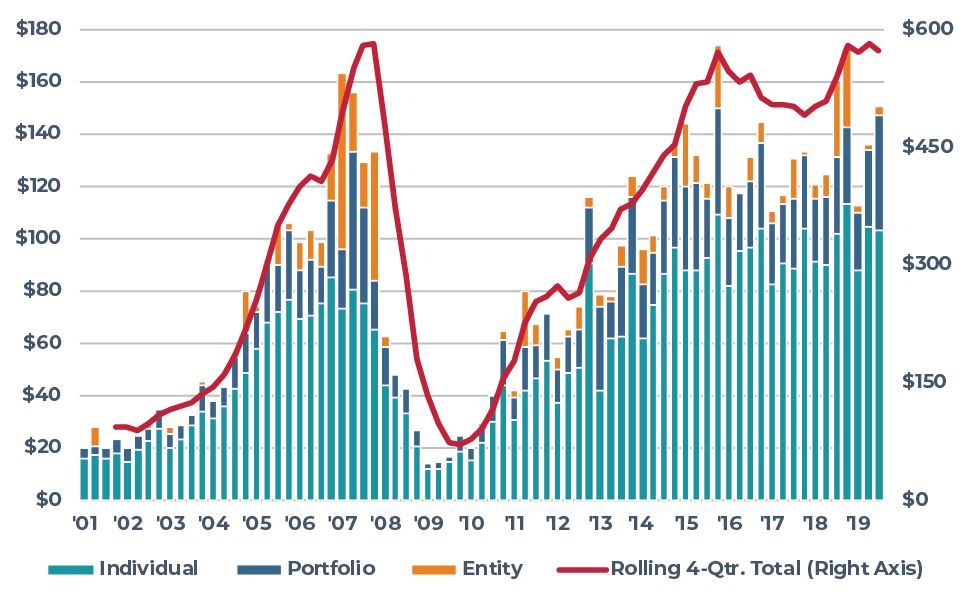
Source: Real Capital Analytics
The information and opinions presented in this research piece have been prepared internally and/or obtained from sources which AEW believes to be reliable; however, AEW does not guarantee the accuracy, adequacy, or completeness of such information.