2020 Q1 – The Quarter When Everything Changed
At the beginning of March, the U.S. economy was on pace to record another quarter of moderate but positive growth. Total employment had increased by 214,000 in January and 275,000 in February and the Atlanta Federal Reserve’s real-time model (GDPNow) suggested annualized real GDP growth of 2.5% for the quarter. Within a span of just a few weeks, that assessment was radically upended as more than 30 million American workers lost their jobs in the rapid shutdown of wide swathes of the U.S. economy in response to the equally rapid spread of the novel coronavirus (COVID-19).
FIGURE 1
NEW CLAIMS FOR UNEMPLOYMENT INSURANCE
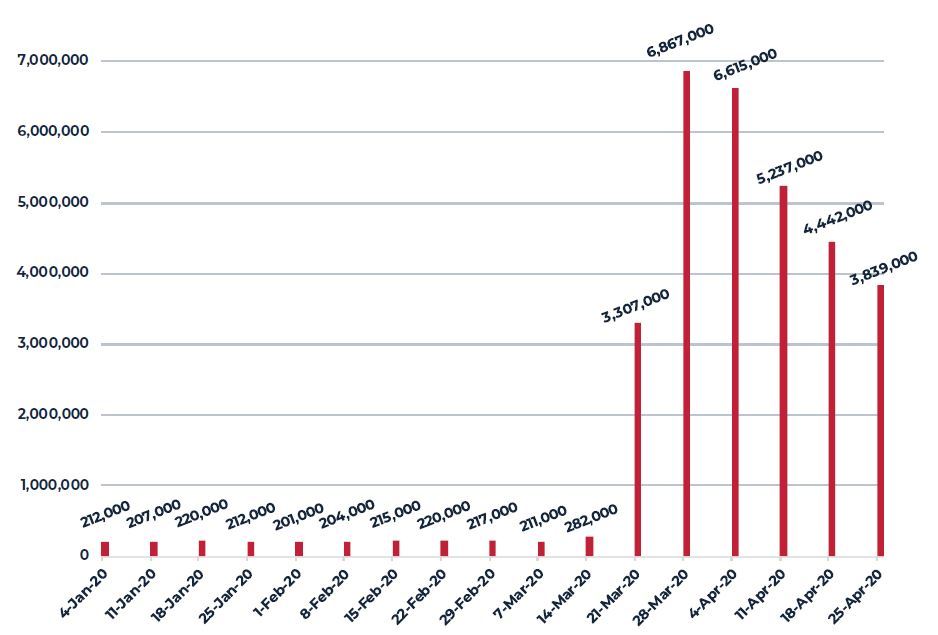
Source: Department of Labor
Reflecting this, economic projections for the remainder of 2020 and beyond have changed drastically. Preliminary estimates for real GDP show an annualized decline in the first quarter of nearly 5% with second-quarter estimates suggesting an annualized decline of 25% or more. The ultimate magnitude of job loss and the duration of the downturn will, of course, be largely a function of the efficacy of the public health system to slow and, eventually, stop the virus spread as well as the ultimate size and efficiency of the fiscal and monetary policy response. Thus far, Congress has approved nearly $3 trillion in new deficit spending to limit the damage to large portions of the economy by replacing near-term lost income and revenue.
FIGURE 2
THREE SCENARIOS OF EXPECTED EMPLOYMENT LOSS AND RECOVERY
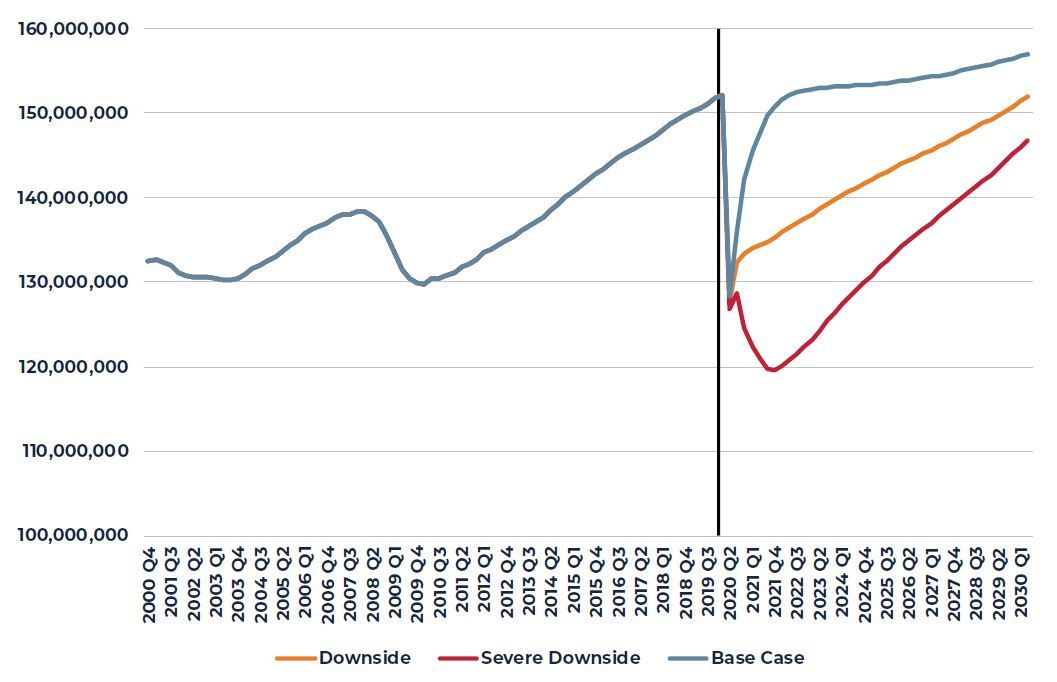
Source: Oxford Economics, CoStar
For its part, the Federal Reserve has restarted most of the capital market support programs developed during the financial crisis and have added entirely new programs to ensure broad and ample liquidity to virtually all parts of the economy and asset markets. As part of this, the Federal Reserve has restarted their bond purchase program known as Quantitative Easing (QE) and has, thus far, expanded their holdings of financial assets, primarily Treasury bonds, by more than $2.5 trillion since Christmas. Given this, Treasury bond yields are expected to remain at current low levels for the foreseeable future. Additionally, credit spreads from these low rates, which had widened sharply during March, have already begun to narrow and this is also expected to continue.
FIGURE 3
BBB CORPORATE BOND YIELD
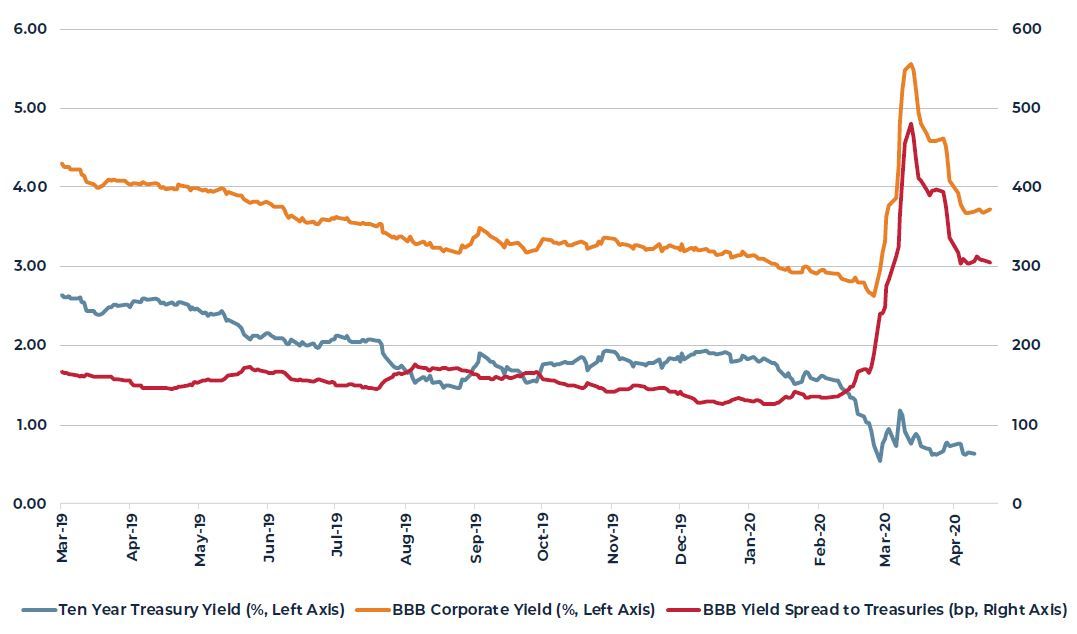
Source: St. Louis Federal Reserve (FRED)
First-quarter property market data do not reflect the rapid and severe economic contraction that has occurred. The events simply happened too late in the quarter to be captured by conventional metrics such as vacancy rates, leasing activity or rents. When we look at less traditional but real-time measures of space utilization, such as restaurant reservations, we can very clearly see the impact: a near complete shutdown of dining out beginning in the second half of March and continuing through April. While restaurants are just one component of active economic participation, they are indicative of what has also happened to hotel occupancy, shopping center foot traffic, airline travel, etc.
FIGURE 4
YEAR-OVER-YEAR PERCENT GROWTH IN U.S. RESTAURANT RESERVATIONS
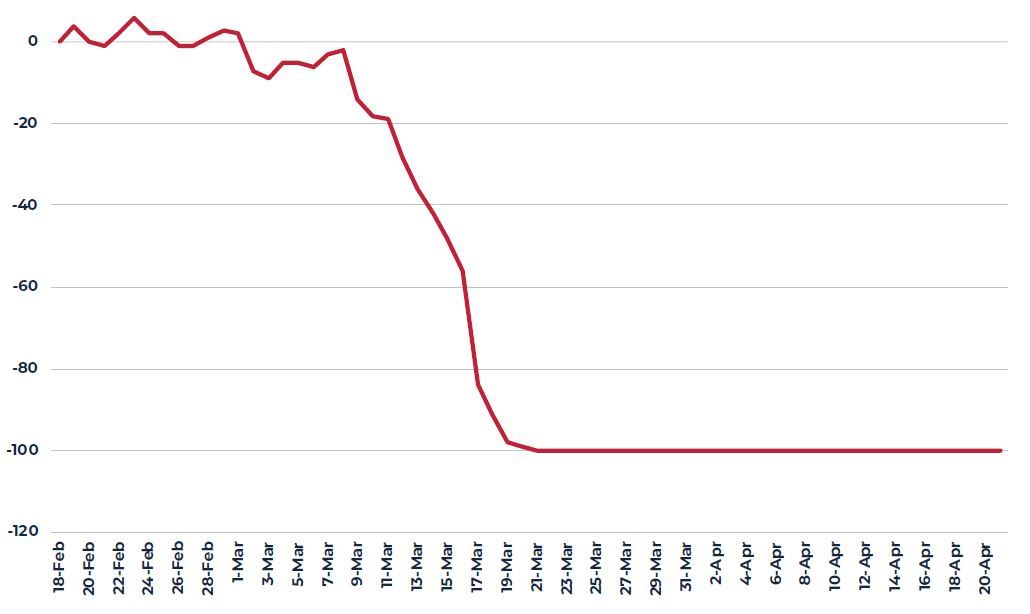
Source: Open Table
Similarly, first-quarter direct real estate capital market data such as transaction volumes, capitalization rates, etc. also do not yet reflect the severity of the social and economic dislocation. Again, the events happened so quickly and so late in the quarter that the conventional third-party appraisal processes had already largely been completed. The publicly traded REIT market does, however, show a clear impact. After peaking in mid-February, the U.S. equity REIT market suffered a 45% decline in value through March 23rd before rallying 22% during the last week of March to finish down 33% for the quarter and up more than 8% in April. For its part, the private direct property market, represented by the NCREIF Property Index (NPI), showed almost no change in value during the first quarter, but did show some small negative valuation changes in specific property sectors such as retail and markets such as Houston.
FIGURE 5
U.S. EQUITY REITS PRICE INDEX
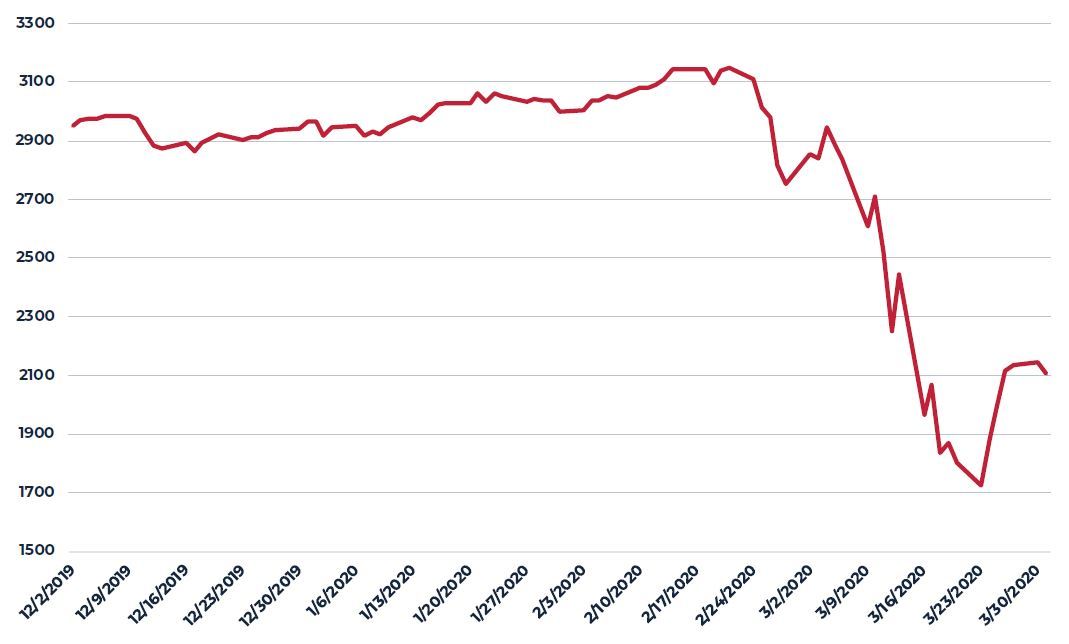
Source: NAREIT
As we contemplate valuation changes in the private direct market going forward there are several things to consider. First, until the strict social distancing requirements are eased, value visibility from completed transactions will be scarce. These requirements will be slowly relaxed beginning in May, but the process will likely be gradual and uneven across markets. Second, we know from past cycles that the composition of valuation changes can vary considerably. In some cases, the impact to net operating income (NOI) from changes in property-market fundamentals (vacancy rates, rents, etc.) can be the driving force as was the case in the moderate downturn of the period marked by the Technology stock crash and September 11th. In other periods that are more clearly related to capital market disruptions, such as the early 1990s and the Great Financial Crisis, the NOI impact was relatively small and changes in investors’ required yields and returns (capitalization rates and discount rates) had a much greater impact on values. Today, we know there will be an impact on NOI and it will likely be significant for Q2. April rent collections were off considerably in the retail sector but less significantly and variably across other property sectors. May and June are obviously expected to be worse. The full impact to NOI and the duration of the disruption to property use and cash flow will obviously be closely related to the depth, breadth and duration of the economic dislocation and this will vary considerably by state and market as each jurisdiction determines how best to move forward. Similarly, potential changes in investors’ requirements for capital market metrics (i.e. how they will price future property income) is simply unknown at this point. In an environment where Treasury bond yields are likely to be below 1% for a considerable time and credit spreads are narrowing, it is not obvious that investors will require higher yields for properties. If the ability to confidently predict future property earnings is impaired, however, it is quite possible that investors will demand a higher initial yield or will discount those earnings at a higher rate.
FIGURE 6
COMPOSITION OF VALUE DECLINE DURING PAST THREE RECESSIONS
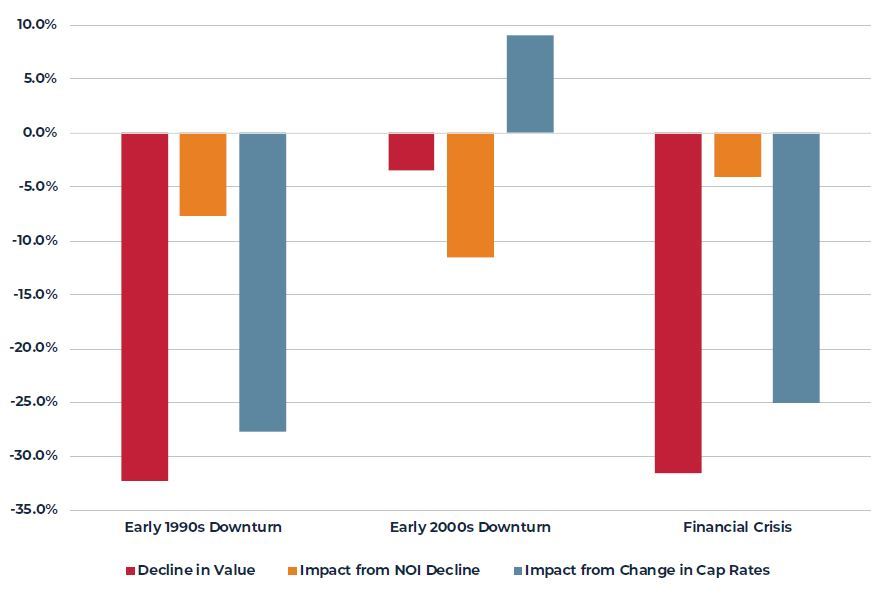
Source: NCREIF
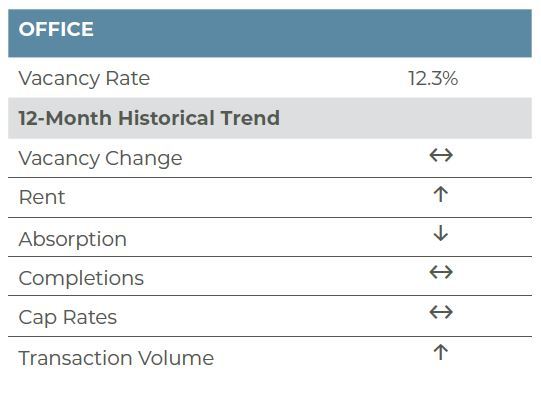
Office
The nation’s office market was remarkably healthy heading into the ongoing economic downturn. Per CBRE-EA, office vacancies stood at only 12.3% in the first quarter of 2020, unchanged from a year earlier and up only 20 basis points (bps) from the previous quarter. Demand was modestly positive (3.8 million square feet) in the first quarter, while new completions slowed to 10.2 million square feet (msf). Annual demand had begun slowing in mid-2019 and continued that trend into the first quarter of 2020; despite the slowing, demand remained roughly on par with completions. Indeed, over the twelve-month period ending on March 31, 2020, net absorption totaled 49.9 msf, roughly equal to the 53.9 msf completed over the same period. Meanwhile, 117 msf of space was under construction as of the first quarter of 2020; this space was planned to be delivered over the course of the next few years, indicating supply was beginning to slow as well.
The ongoing COVID-19 pandemic and subsequent stay-at-home orders will impact leasing and construction in the near-term. The most significant near-term impact is a broad collapse in demand with little, if any, leasing activity in the market today. While social distancing guidelines have made physical office tours impossible, the widespread halt of all economic activity has made companies pause any relocation and expansion activity. Moreover, there is great concern over coworking tenancy. According to JLL, coworking platforms lease nearly 68 msf of office space nationally, accounting for 1.6% of all office space. The most vulnerable subset of this sector are tenants or members that are month-to-month. If WeWork is an example, 60% of coworking leases are tied to month-to-month memberships; should month-to-month users cancel membership, this could push vacancies up by 100 bps, erasing all of the gains over the past five years and bringing vacancies back to their mid-2015 level.
The impact of the collapse in demand on vacancy, however, may be somewhat tempered by a slowdown in construction. Many municipalities have halted construction all together and those that are allowing construction are enforcing social distancing regulations, which will likely slow progress. Moreover, the broad shutdown of the economy has led to difficulties in obtaining materials, as many parts of the global supply chain have been disrupted. Despite this slowdown in supply, there will undoubtedly be pain in the office sector in the coming quarters, with CoStar projecting a nearly 9% annual decline in rents in 2020.
The long-term outlook for the sector, however, is significantly more murky relative to just three months ago with a number of questions that may cause long-term shifts in office use. For years, office users have been reducing their square footage per worker, with workstations getting smaller and spaces between employees shrinking. Will this now be considered a liability and will social distancing be here to stay? Will employees be wary of crowding an elevator to work in large towers? Do employers and employees flee dense urban environments? Looking to Asia as an example, we do not believe this will be the case. Parts of China are reportedly largely back to normal operations, and our colleagues in Hong Kong have reported similar conditions. Office buildings, malls, restaurants and parks have reopened and social distancing guidelines have been relaxed. Temperature scans, face masks and staggered shifts are ubiquitous; however, people are re-engaging in their pre-coronavirus life. It is likely that some distancing measures will stay in place through 2020 and perhaps 2021. As greater time passes, these restrictions may fade, particularly if a vaccine is developed and is widely available in 2021. CoStar and CBRE-EA base case scenarios project a recovery that is in line with a v-shaped or swish recovery, with a return to peak rents in 2022.
Markets with the Largest Coworking Concentration - Top 20
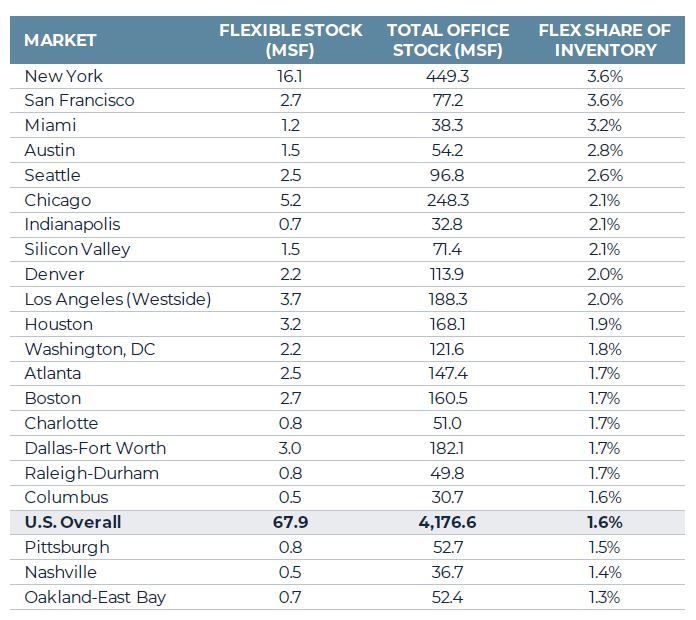
Source: JLL
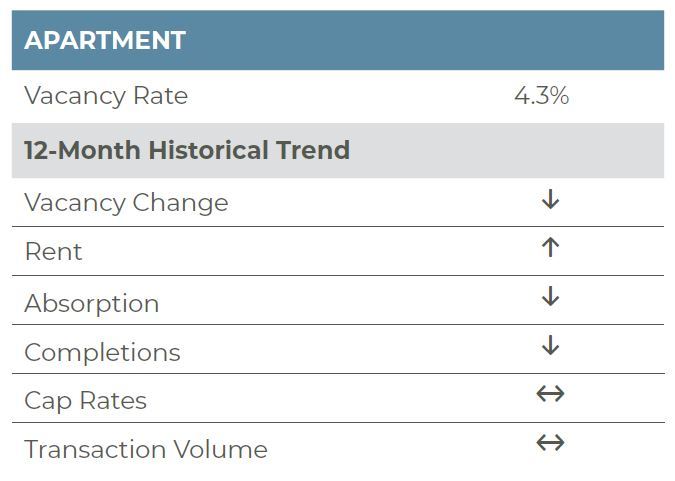
Apartment
The U.S. apartment market was exceptionally strong headed through the first quarter of 2020. According to preliminary data from CBRE-EA, first-quarter vacancies stood at 4.3%, down 30 basis points (bps) from a year earlier. The strength in the market was pervasive with 53 of 67 markets tracked by CBRE-EA reporting a reduction in vacancies on a year-over-year basis in the quarter. Further, only four markets, Minneapolis, Louisville, Richmond and Long Island, reported an uptick in vacancies of over 20 bps. Minneapolis and Long Island remained exceptionally tight, however, with first-quarter vacancies of only 3.6% (+40 bps) and 3.8% (+90 bps), respectively.
Much of the data highlighted above reflects conditions before the onset of the economic shutdown and does not represent the risk to the market that exists today due to the roughly 30 million lost jobs that have occurred to date. Indeed, the COVID-19 pandemic has dimmed the near-term forecasts for demand and rent growth for the apartment sector. Data from RealPage is revealing the degree to which the market is being impacted by the ongoing crisis. Beginning in mid-March, when many states started issuing stay-at-home orders, new leasing plummeted. According to RealPage, year-over-year same-store new leases declined by nearly 50% over the last two weeks of March. Further, new leasing remained depressed in early April, before slowly recovering through the end of April. New leasing through the final week of April was roughly on par with levels from a year earlier; however, the overall softness in new leasing has impacted rents. RealPage reports same-store rents on executed new leases were down between 4.5%-6.1% on a year-over-year basis in March and April. Not surprisingly, COVID-19 hot spots Seattle, New York and Boston experienced larger declines, in the 7% to 12% range.
The uptick in vacancies that may typically be associated with slower new leasing will be partially offset by increased renewals and cancelled move-outs. Renewal rates were already on the rise, reaching a new record high of 55.3% in March and that percentage will likely edge higher in April. Per RealPage, the share of rescinded move-out stood at 3.7% during the week of April 18th, nearly double the year-earlier level. Further, during the same period, retention rates increased by over 860 bps on a year-over-year basis.
While renter retention has picked up, the loss of jobs is a distinct risk to apartment revenue and, ultimately, NOI. Again, a record number of people, over 30 million, have filed for unemployment since mid-March, indicating job losses could be four times the level seen during the Great Financial Crisis (GFC). Enhanced unemployment benefits, however, appear to be working with rental collections holding up relatively well to date. An NMHC survey shows 91.5% of households in professionally managed apartments made full or partial rent payments from April 1st through 26th, down only 410 bps from a year earlier. However, moratoriums on evictions in many municipalities may make rental payments less of a priority going forward, thus, the upcoming May rent collections bear watching.
One positive consideration for the apartment market is a near-term slowdown in construction. Some states have halted construction activity all together in an effort to stop the spread of COVID-19. This will work to reduce completions for 2020, which were expected to total roughly 270,000 or 1.7% of inventory. In response to the construction shutdowns, CoStar is projecting a 9% reduction in total completions for 2020, compared to their pre-COVID-19 expectations. Nevertheless, the base case projections from CoStar call for a roughly 200 bps increase in vacancies, roughly double the increase during the GFC. Of note, a surge in foreclosures during the GFC forced many homeowners into rental units. The increase in vacancy, we believe, will force a 8%-10% decline in rents for 2020, with this likely occurring through increased concessions as opposed to outright declines. Longer term, favorable demographics and a continued moderation in construction should allow for a healthy recovery but with perhaps changes in location preference that are difficult to predict at this point. Millennials who were on the fence about the move to a less dense housing situation that requires a car may more eagerly consider a suburban lifestyle after three months locked in a small apartment. Again, it is simply too early to know how pronounced and long lasting any changes in housing preferences will be.
YOY DAILY CHANGE IN APARTMENT RETENTION RATES*
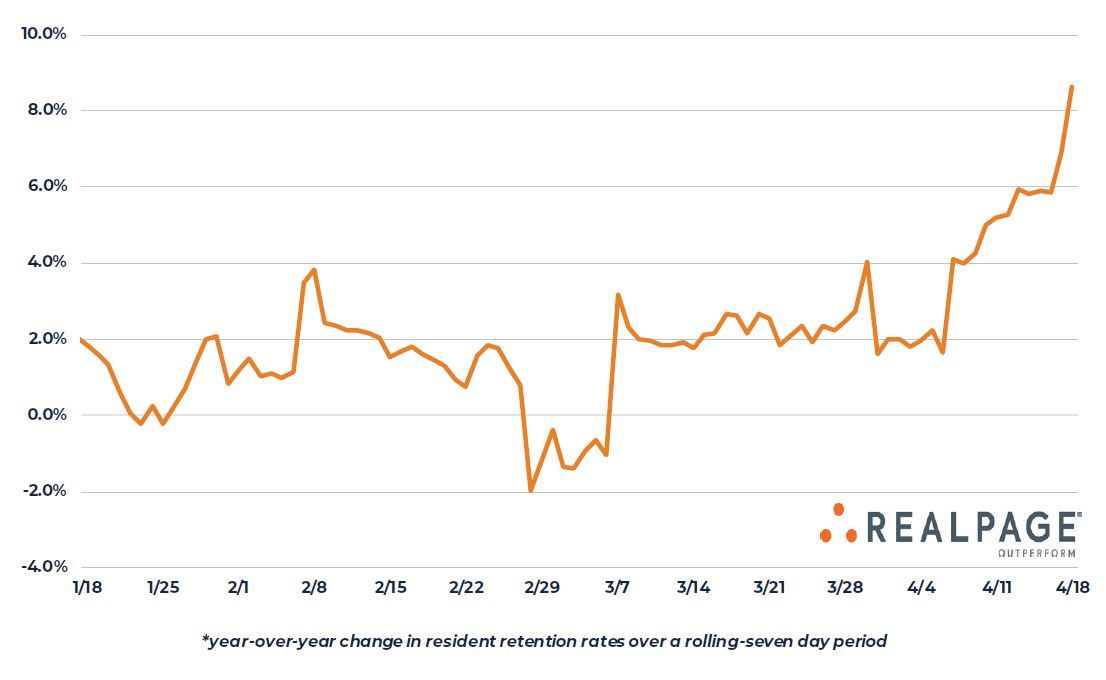
Source: RealPage, Inc.
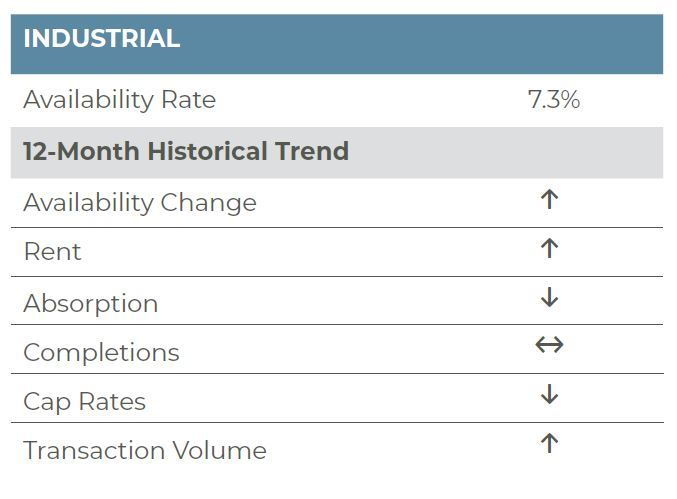
Industrial
The industrial sector is perhaps poised to withstand the pernicious effects of the ongoing COVID-19 pandemic better than other property types and may eventually emerge even stronger due to changes in online shopping, inventory management and manufacturing activity. The U.S. industrial market was exceptionally tight heading into the current downturn. Industrial availability, which has been below 7.5% since early 2017, is at the lowest level in roughly two decades and the tight fundamentals continued into the first quarter, with availability sitting at 7.3%. That said, availability did nudge slightly higher in the quarter, up 10 basis points (bps) from the fourth quarter of 2019, as new demand continued to moderate. Roughly 34 million square feet (msf) was absorbed in the quarter, down from nearly 63 msf in the fourth quarter and 48 msf in the third quarter of 2019. The uptick in availability, however, was tempered as supply growth slowed in step with demand. In the first quarter of the year only 55 msf was completed, down from 75 and 62 msf in the two previous quarters.
Heading into the second quarter and with the onset of the coronavirus outbreak, leasing across most property types has ground to a halt; however, industrial has bucked this trend with leasing continuing to occur today. The leasing that is occurring, however, is very much bifurcated with large logistics and distributions properties outperforming smaller or more flex properties. E-commerce, paper products firms and food/cold storage users in particular continue to lease space with Amazon and Walmart executing leases after the economic shutdown began. Not surprisingly too, cold storage space remains in great demand. The COVID-19 pandemic has accelerated the rate of adoption of e-grocery. Rakuten Intelligence reported online grocery orders for the March 12-15 period increased 210% from the same period in 2019. NetElixir reported similar results with online food sales jumping 183% from March 1-25, 2020 versus March 1-25, 2019. Online grocery sales are expected to remain strong in the near-term. According to a report by Business Insider Intelligence, 43% of U.S. consumers are expected to purchase groceries online by the end of June, up from 34% at the end of March and 24% at the end of 2019. While some consumers will return to in-store grocery shopping post-pandemic, it is likely that a significant portion of consumers will continue shopping online, either regularly or on a periodic basis; thus, we expect cold storage demand to be even stronger than originally projected at the beginning of the year.
Another source of increased demand will likely come from a change in overall inventory management. Just-in-time inventory management has proven to be challenging during the current pandemic with shortages of many basic consumer products and pantry staples, bottled water and now meat. Meanwhile, a halt in trade flows from Asia earlier in the year and shortages of personal protective equipment for healthcare workers have yielded calls for more diverse supply chains and reshoring of manufacturing activity. Redundancy of manufacturing capabilities will likely pick up and yield additional demand for industrial space.
Meanwhile, on the supply side, new deliveries will likely be pushed out, due to construction delays related to stay-at-home and social distancing restrictions. In general, supply was projected to slow in 2021 and beyond; we expect this will continue to be the case. The ongoing surge in demand and long-term favorable demand trends should position the industrial market well in the near-term and post-coronavirus era. The lone exception will likely be in the flex and smaller multi-tenanted properties, which will likely be pressured near-term due to small business woes and reduced credit quality.
NETELIXIR YEAR-OVER-YEAR GROWTH IN ONLINE SHOPPING
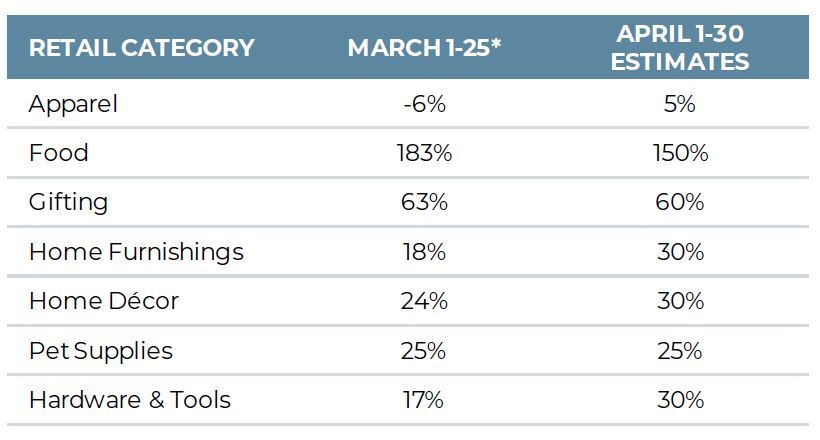
*Dataset is comprised of e-commerce retailers with annual e-commerce revenue of $20 million to $300 million. Source: NetElixir
GROCERY ORDERS & BUY ONLINE PICK-UP IN STORE (BOPIS) SURGE
INCREASE IN E-COMMERCE SALES ON MARCH 12 THROUGH MARCH 15
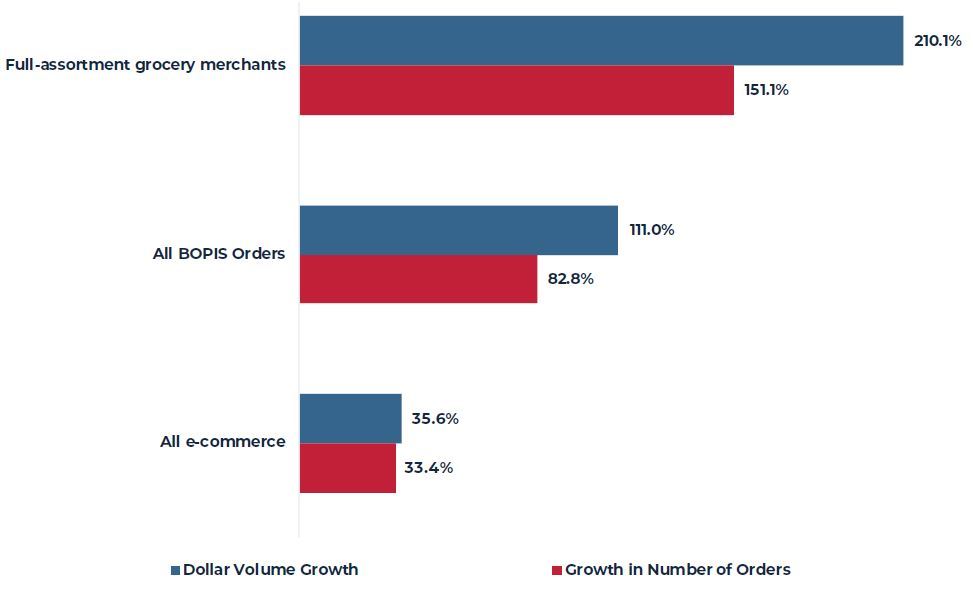
Source: Rakuten Intelligence
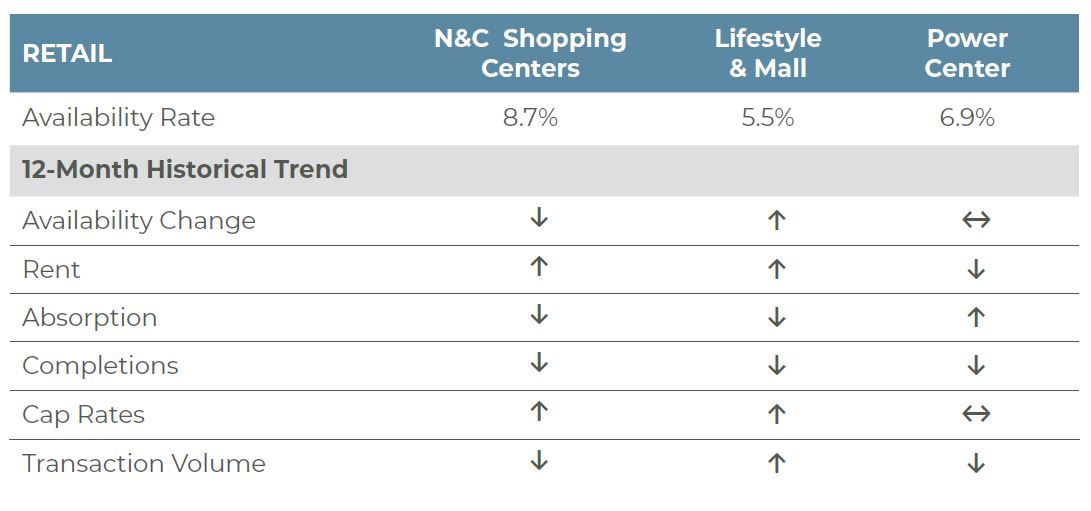
Retail
Towards the end of the first quarter of 2020, the retail sector began to see the impact of the COVID-19 pandemic; however, the true effects of the pandemic did not begin until mid-March when non-essential businesses were ordered to shut down and layoffs began. Thus, the first-quarter retail data does not reflect the impact of local shelter-in-place orders and significant national job losses. Per CBRE-EA, total retail availability stood at 6.1% in the first quarter of 2020, unchanged from the prior quarter and down 10 basis points (bps) from a year earlier. Supply and demand have been roughly evenly matched at relatively low levels over the past year. Indeed, retail completions totaled 40.1 msf over the previous four quarters while net absorption totaled 38.6 msf; both are roughly half their historical averages since 2005. By property subtype, neighborhood, community and strip retail had a first-quarter availability rate of 8.7%, up 10 bps from the prior quarter. Lifestyle and mall retail reported a 2020Q1 availability rate of 5.5%, also up 10 bps from the prior quarter, while Power Center retail availability was unchanged quarter over quarter, remaining at 6.9% in 2020Q1. As we move into the second quarter, all retail segments will likely reflect more impacts from COVID-19.
Due to the COVID-19 outbreak and subsequent stay-at-home orders, consumers have had to learn to shop differently. Many experiential-based retailers, like restaurants, bars, concert venues, fitness centers and salons have temporarily closed to increase social distancing. With slowed domestic and international travel, some shops in airports have been temporarily closed as well. In March, retail and food services sales dropped 8.7% from the previous month, which is the largest monthly drop in the last three decades (nytimes.com). Many large national retailers have had to lay off a significant portion of their hourly staff. Fitness studios like Flywheel and SoulCycle have had to furlough trainers, so consumers have turned to online work-out providers like Aaptiv or free work-outs that laid-off trainers have been posting to social media. Restaurants have been hit hard as well, with many adjusting to take-out only models, offering contactless pick-up/drive-thrus or delivery; others that have not been able to adapt or generate enough take-out volume have closed completely. Several states, including Massachusetts, Texas and New York, have been working to help restaurants by issuing temporary waivers to allow for alcohol to be purchased with delivery orders and for restaurants to be able to sell grocery staples. Meanwhile, clothing retailers have reported a 50.5% decline in sales in March, potentially because people saw no need to shop for spring wardrobes (nytimes.com).
On the other end of the spectrum, online retailers and grocery stores are seeing sizeable increases in orders. Amazon isn’t the only online retailer to benefit from this trend, as their delays in shipping non-essential items have been a logistics setback that has opened opportunities for other retailers to compete. E-grocery providers like Instacart and Thrive Market are seeing stronger sales. Sales at brick-and-mortar pharmacies and grocery stores were up in March, and meal kit providers like Blue Apron saw a boost, too. Other online retailers are offering free shipping to increase their revenues with in-store purchases restricted. Walmart has seen an uptick in online searches, with an increase of 72.2 million more searches than usual in the time since February 16th (slate.com). Consumers are dealing with a shift of their lifestyles and routines. Prior to the current pandemic situation, e-commerce was already creating a challenge for brick-and-mortar retailers. Now, e-commerce has benefitted from even more of an advantage.
The long-term impact of COVID-19 on retail is uncertain; even when retailers are permitted to open stores again, the level of demand from consumers will likely fall short of their pre-COVID-19 levels. Job losses across several sectors and economic insecurity may leave consumers reluctant to spend on non-essential goods. Additionally, consumers may be reluctant to return to restaurants or shopping malls while still in fear of contagion, or they might get used to the convenience of doing most of their shopping and work-outs at home. Further, initial re-openings will likely feature reduced capacity in restaurant dining rooms and retail stores. This may yield additional retail and restaurant bankruptcies, beyond those already announced (JC Penney, True Religion and FoodFirst Global Restaurants). Longer term, hopefully pent-up demand for restaurants and experiential retailers will support the sector more broadly, once the psychological impacts of the COVID-19 pandemic fade. If history is any guide, the 1918 Spanish Flu was followed up by the Roaring 20s, so maybe memories will be shorter than we think.
US RETAIL AND FOOD SERVICE SALES
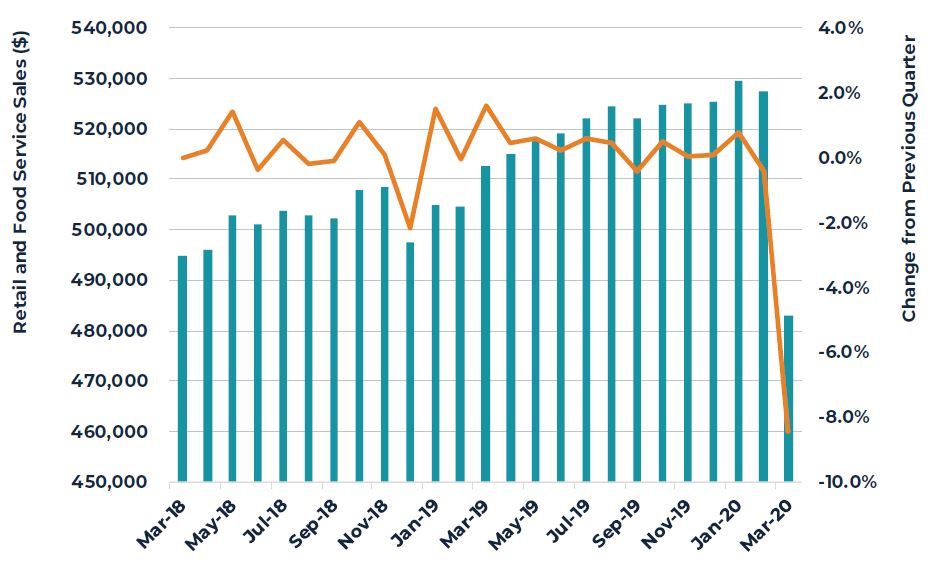
Source: Moody’s
Capital Markets
Like the property market data, first-quarter transaction volumes from Real Capital Analytics (RCA) showed continued strength in the pre-COVID-19 market. Per RCA, $125.6 billion in properties changed hands in the quarter, up 11% on a year-over-year basis. By property type, the industrial sector once again posted the largest increase in transaction volume. Nearly $33 billion in industrial properties were sold in the quarter, up 86% from the first quarter of 2019. Industrial volume was buoyed by Prologis’ nearly $19 billion acquisition of Liberty Property Trust in February. Office volumes were also boosted by the Liberty Property Trust transaction and by Columbia Property Trust’s entity-level purchase of Normandy RE Partners. In aggregate, $29.4 billion in office properties changed hands in the quarter, up 4% year-over-year. Unlike the industrial and office sectors, apartment and retail trades were down slightly on a year-over-year basis in the quarter at $39.9 (-1%) and $11.7 billion(-6%), respectively.
Not surprisingly, on a monthly basis, January and February transaction activity was healthy while deal volume began to slip in March. Indeed, total volume in March stood at only $28.9 billion, the lowest level since February 2017 and down 27% year-over-year. Further, March transactions were down 40% from January and February’s $48 and $49 billion in trades, respectively.
Despite the drop off in transaction volume, pricing through March held up relatively well. The RCA Commercial Property Price Index (CPPI) for all property types increased 7.2% on a year-over-year basis in March. The apartment and industrial price indices reported the largest gains, advancing 11.0% and 8.9% year over year, respectively. Office gains were also solid, increasing 5.7% from a year earlier, while retail gains were more modest at 2.8%.
Meanwhile, according to NCREIF, cap rates for most core property sectors were relatively flat in the quarter, again with retail being the lone exception and this likely reflects the weakness that existed in the retail sector pre-COVID-19. The market value-weighted cap rates for apartment (4.17%, +2 bps), industrial (4.35%, -10 bps) and office (4.29%, +8 bp) were roughly unchanged on a year-over-year basis, while, retail cap rates increased 22 bps to 4.75%. Again, this first-quarter data does not yet reflect the impact of the current economic downturn. The change in retail cap rates is also evident in the sector’s appreciation return reported by NCREIF, which was –3.22% for the quarter and –6.40% on a one-year basis. Given the late mid-March hit to the economy, the first-quarter NCREIF returns for the other property types do not incorporate the weakness that has since seeped into the market and was reflected in recent REIT value declines. Instead, the apartment sector showed a modestly negative appreciation return at 0.1%, while office and industrial were positive at 0.19% and 1.46%, respectively. The total return for the three aforementioned property sectors were 0.95%, 1.28% and 2.58%, respectively. On a one-year basis, the NCREIF total return continued to moderate, with a 4.5% income return and a 0.7% capital return prompting a total return of 5.3%.
As we have stated previously in our broader economic overview, clarity on pricing metrics will be difficult to ascertain given a lack of private market transactions. Instead, the more obvious metrics to assess are surrounding operations, specifically NOI growth. Without a doubt NOI will be impacted due to lower rent collections, declining rents and rising vacancies. Per NCREIF rent collections were down across all property segments but were lowest in the retail sector at around 36.1% on a value-weighted basis in April; surprisingly, industrial followed at 81.2%. Finally, office collections totaled 86.8% while apartment collections within the NCREIF universe totaled 91.7%. Meanwhile, rents across all property types are expected to decline in the coming quarters and vacancies are projected to increase. As such, we expect capital appreciation will be negative for the second quarter and the success of reopening, and subsequent shape of the recovery, will dictate how long income returns remain negative. For now, we believe cap rates will remain relatively stable as monetary and fiscal policy have ramped up quickly to hopefully stem off broader capital market disruptions.
MONTHLY TRANSACTION VOLUME
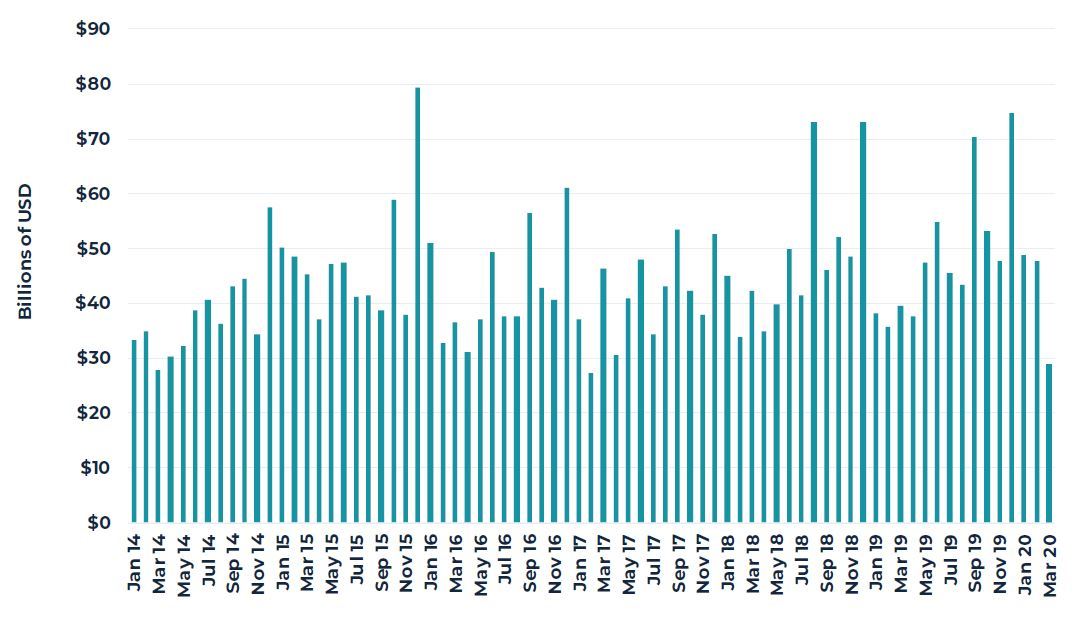
Source: Real Capital Analytics
NCREIF PROPERTY INDEX 2020Q1 RETURNS
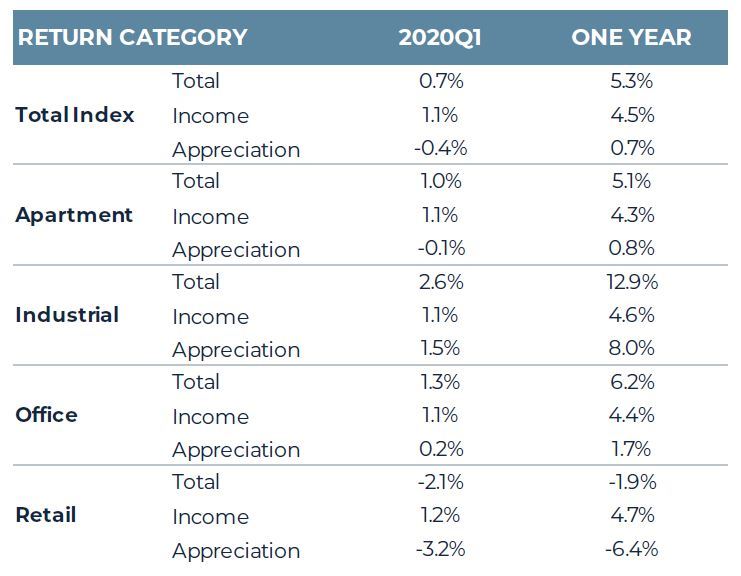
Source: NCREIF
The information and opinions presented in this research piece have been prepared internally and/or obtained from sources which AEW believes to be reliable; however, AEW does not guarantee the accuracy, adequacy, or completeness of such information.