Excuse Me, Is This Seat Taken?
America on the Verge of Returning
Despite a recent slowdown due to the temporary suspension of the use of the Johnson & Johnson one-dose vaccine, the U.S. continues to make strong progress overall in the vaccine rollout. In aggregate, more than 225 million doses have been given and more than half of the U.S. adult population has now received at least one shot. Reflecting this, COVID-related restrictions are largely being eased in most states, school systems are rapidly returning to in-person learning and office tenants that were forced to curtail using their space are beginning the conversation of when and how their employees will return.
FIGURE 1
U.S. DAILY AND CUMULATIVE COVID VACCINATIONS
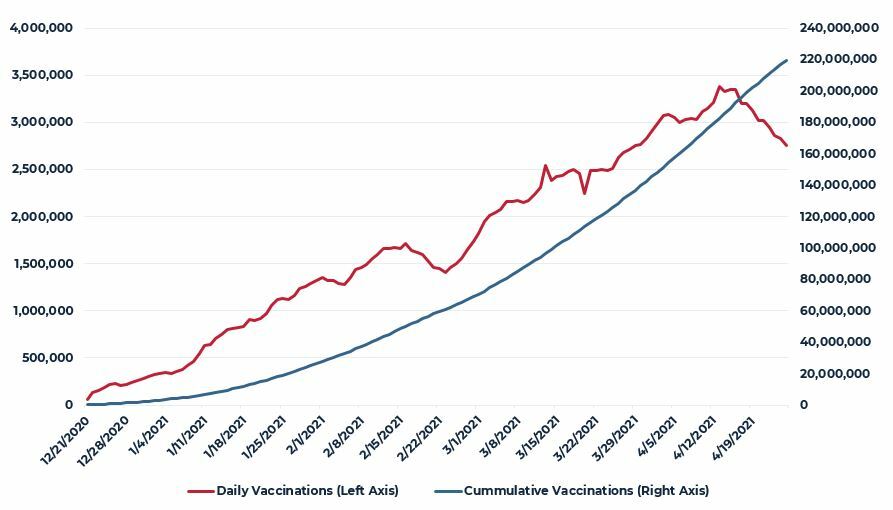
Source: Our World in Data (www.ourworldindata.org)
The turn towards pre-pandemic behavior is showing up in broad measures of economic growth. In March, the U.S. labor market recorded a net gain of more than 900,000 jobs, bringing the total increase since last April’s nadir to nearly 14 million. Similarly, preliminary data suggest first-quarter annualized growth in real GDP of 6.4%. Reflecting both the broader move towards return to normal and the stimulus effects of the $1.9 trillion American Rescue Act, consensus estimates for 2021 growth now range from 6% to 8%, quite possibly the strongest annual growth in more than 30 years.
Against this backdrop of outsized aggregate growth, there continues to be significant geographic variation in economic performance, and said performance has largely been dictated by the degree of local or regional pandemic impact and the diffuse set of state and local government policies to combat it. Broadly, higher density and colder areas experienced more significant infection rates and, consequently, employed stricter restrictions in response. These areas generally suffered steeper economic decline and slower recovery. In contrast, less dense and warmer areas generally experienced lower infection rates and largely eschewed more draconian countermeasures.
FIGURE 2
BACK TO NORMAL INDEX
FEBRUARY 2020 = 100
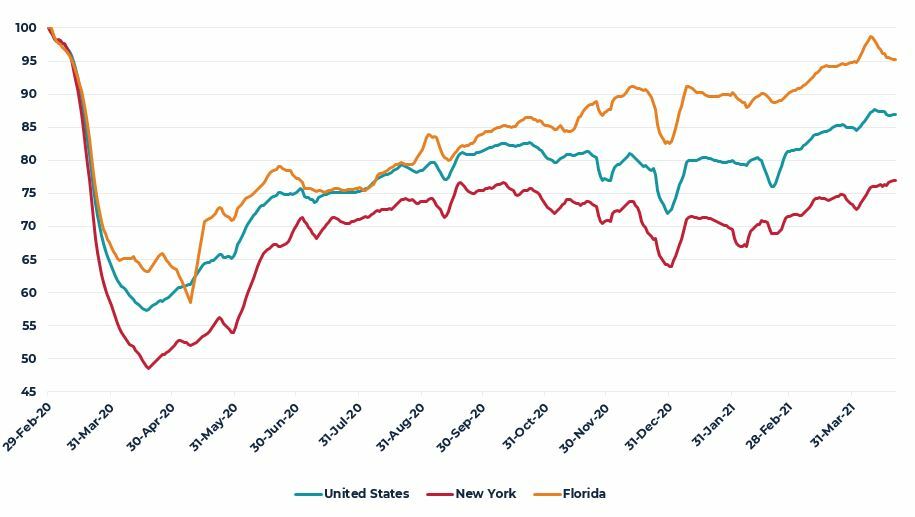
Source: Moody’s Analytics
Over the past year, a wide variety of real-time data sources have been employed to identify and track these geographical differences. For example, Moody’s Analytics has developed a “back to normal” index methodology that combines a basket of real-time measures of economic activity and normalizes them to pre-pandemic levels. By this measure, state economies such as Florida’s are shown to have experienced less severe economic contractions and much quicker returns towards normal, while states that endured more significant outbreaks and shutdowns, such as New York, continue to struggle to return to pre-pandemic levels of activity.
Despite these differences, the continued successful distribution of the vaccine means doses are expected to reach all adults who want them by mid-summer, which will likely yield a tipping point effect of rapid acceleration of broad-based economic activity for the second half of the year. This should disproportionately benefit providers and locations offering experiences and services that have been largely unavailable to consumers over the past year such as hotels, restaurants and entertainment.
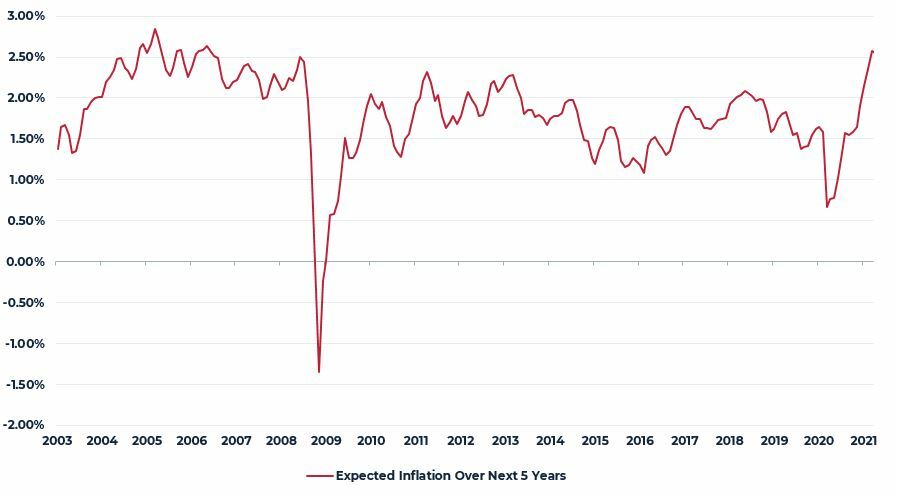
Stronger near-term expected growth is, of course, broadly positive for a wide range of stakeholders but it does also amplify investor concerns over possible higher inflation, a phenomenon that has been largely missing from the investment landscape since the Great Financial Crisis (GFC). Expected inflation over the next five years reached a cycle low of roughly 70 basis points as the COVID-19 pandemic erupted in March of last year. Since then, expected inflation has increased steadily to more than 250 basis points today.
FIGURE 3
TEN-YEAR TREASURY BOND FORWARD CURVE
Source: Federal Reserve
Reflecting the significant increase in inflation expectation, bond market expectations for future Treasury yields have also widened significantly over the past year (see Figure 4). Today, the bond market is anticipating that the ten-year Treasury yield will be near 2.5% by mid-decade. It should be noted that if the forward markets are correct concerning both inflation and sovereign yields, the real yield on the Treasury bond would still be zero or negative five years from now.
FIGURE 4
EXPECTED TEN-YEAR TREASURY FORWARD YIELD
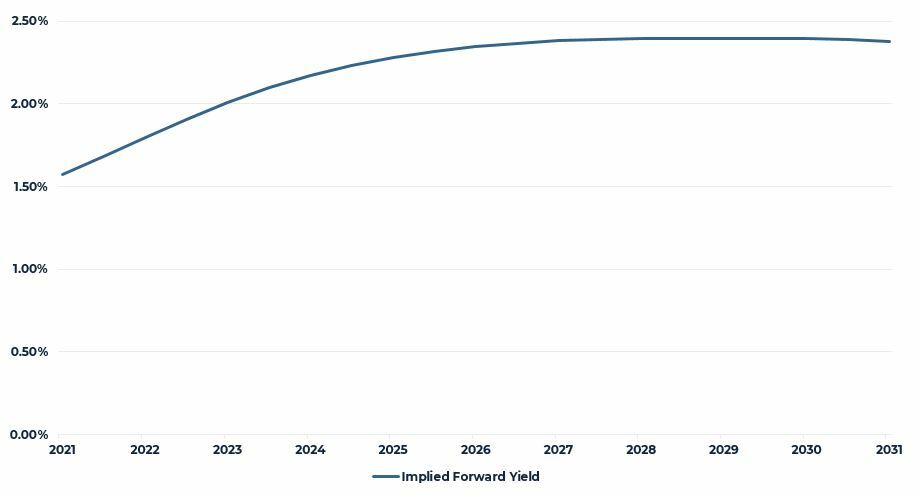
Source: Chatham Financial
U.S. Commercial Property
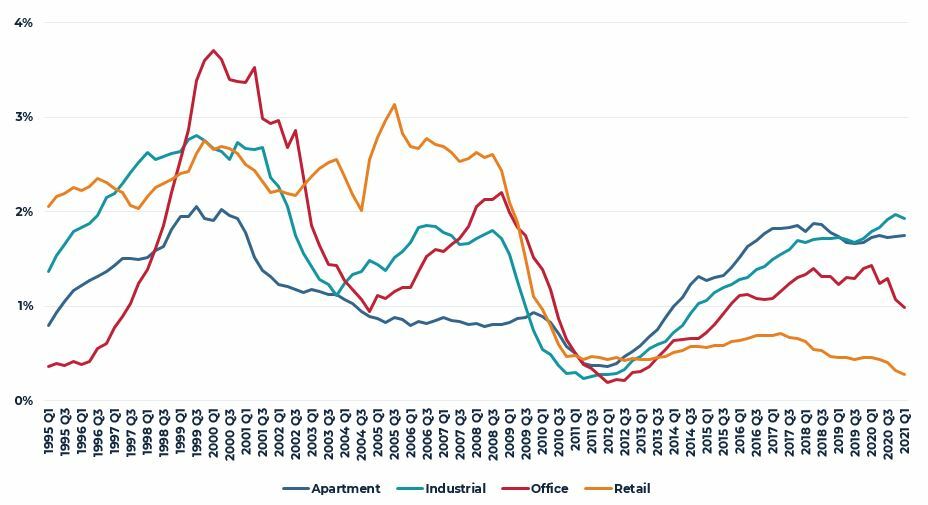
Commercial property has experienced a variety of dislocations and disruptions over the past year as tenants and landlords have grappled with the economic, social and political impacts of the pandemic. These pandemic effects have varied considerably by property type and geography with properties in the regions hardest hit economically typically impacted more. With respect to property-type distinctions, office properties have generally seen the greatest realized negative absorption followed by retail centers with greater declines in lifestyle centers and malls as compared with neighborhood and community centers. In contrast, absorption of industrial space has remained strong over the past year with more than 2% year-over-year growth in occupied space.
FIGURE 5
ABSORPTION: YEAR-OVER-YEAR PERCENT CHANGE IN OCCUPIED STOCK BY PROPERTY TYPE

Source: CBRE-EA 2021 Q1
On the supply side, the nation’s stock of industrial space and apartments continues to grow briskly with nearly 2% year-over-year growth. Growth in industrial space has accelerated over the past year, but has thus far been matched by comparable growth in demand. Looking ahead, we expect industrial development to continue to increase in response to strong investor and tenant demand for the product type. Overall, there is very little construction of shopping centers or other retail today with the total stock increasing year-over-year by less than 30 basis points. For its part, the U.S. office stock is currently growing year-over-year at a rate of 50 basis points. Given the heightened uncertainty around near-term office demand following a year of broadly remote working, development of new office space is likely to be well below average for several years.
FIGURE 6
SUPPLY: YEAR-OVER-YEAR PERCENT CHANGE IN TOTAL STOCK (BY PROPERTY TYPE)
Source: CBRE-EA 2021 Q1
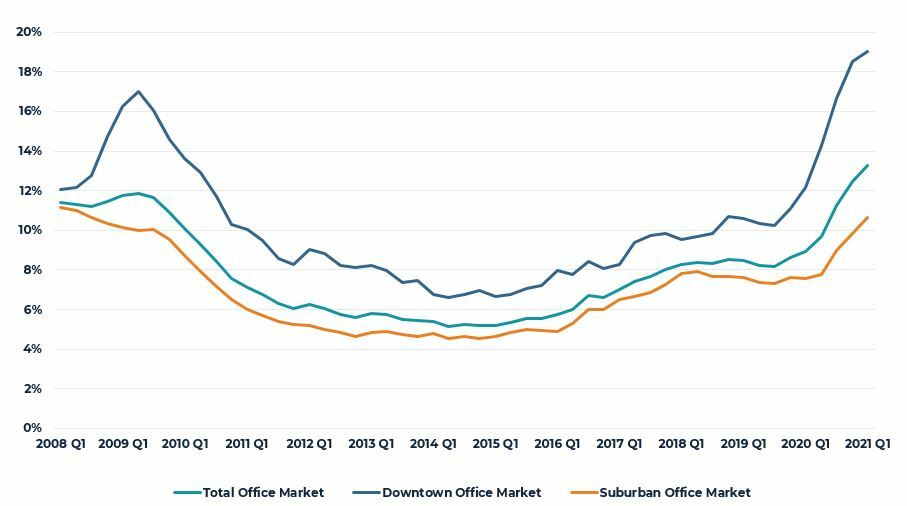
After falling for most of the past decade, U.S. property sector vacancy and availability rates largely flattened during 2019 as supply and demand moved into equilibrium. Vacancy and availability rates generally rose during 2020 as the pandemic disrupted demand and, subsequently, the markets’ equilibrium. Office property vacancy rates specifically moved up sharply, particularly in downtown (CBD) locations. More significantly, the share of available office space in CBD locations coming from sublease rather than direct vacancy moved to levels not seen since the GFC, likely suggesting continued near-term downward pressure on CBD office rents.
FIGURE 7
VACANCY/AVAILABILITY RATE (BY PROPERTY TYPE)
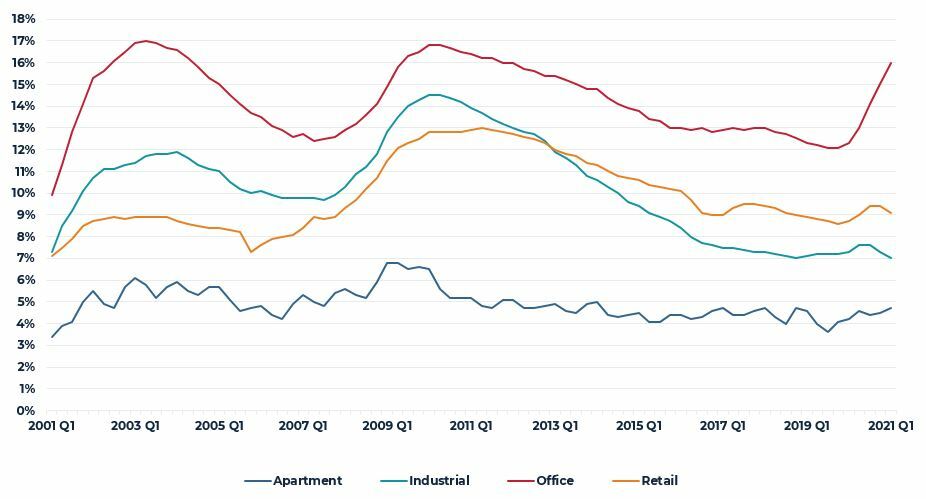
Source: CBRE-EA 2021 Q1
FIGURE 8
SHARE OF AVAILABLE OFFICE SPACE FROM SUBLEASE SPACE
Source: CBRE-EA 2021 Q1
Putting the supply and demand fundamentals together, it is not surprising that property income performance also varied greatly through the pandemic period (Figure 9). Investor positive sentiment for industrial properties is supported by strong and steady growth in industrial net operating income (NOI). Similarly, investor apprehension around retail properties is likely informed by the sharp decline in retail NOI during 2020. For its part, retail income performance is further bifurcated between neighborhood and community centers versus regional and super regional malls, with the latter posting significantly greater declines. Within apartments, there has also been a significant divergence between very peak performance by high-rise properties and relatively stable performance by garden-style apartments.
FIGURE 9
YEAR-OVER-YEAR GROWTH IN NET OPERATING INCOME
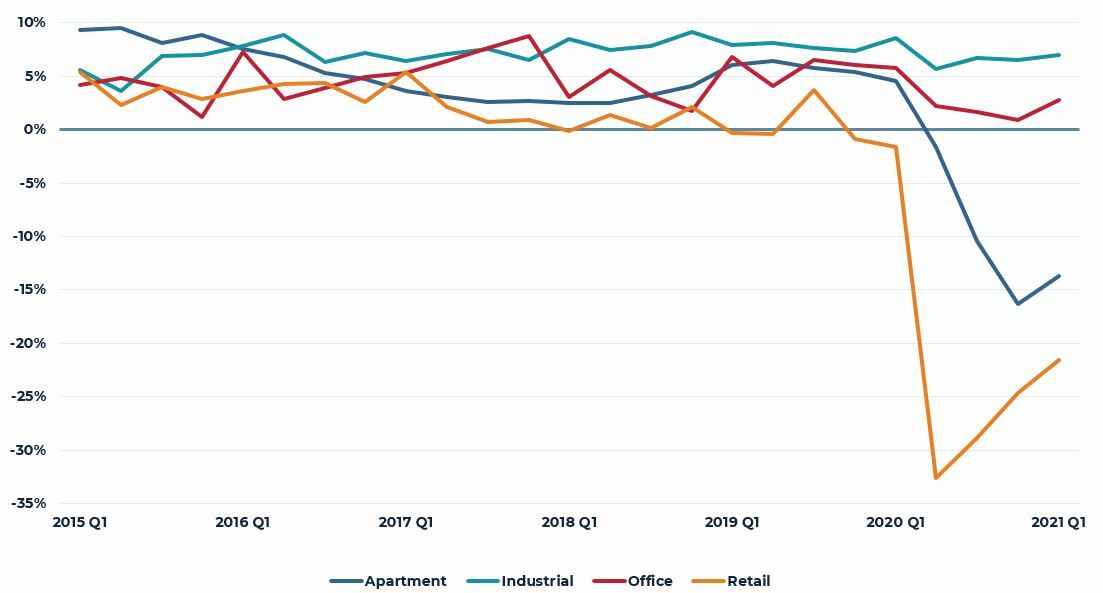
Source: NCREIF
Looking ahead, institutional property investors are expecting improving property market fundamentals as economic growth accelerates this year and into 2022. In general, investors expect continued outperformance by industrial properties, followed by a relatively quick recovery in apartments. Sentiment regarding the near-term performance of office and retail properties remains more mixed with some expectation that retail income impairment may be longer lasting and some not yet observed adjustment in office income may be forthcoming. This outlook, particularly for expected NOI growth, is central to expectations for property appreciation. As noted previously, the bond market anticipates Treasury yields rising modestly from today’s 1.6% to 1.7% range to approximately 2.3% by 2025. Some of this increase, should it occur, will likely be absorbed by a narrowing spread between property yields and Treasury yields as today’s average spread remains at or above long-term averages.
FIGURE 10
NPI AVERAGE PROPERTY YIELD AND SPREAD TO TEN-YEAR TREASURY YIELD
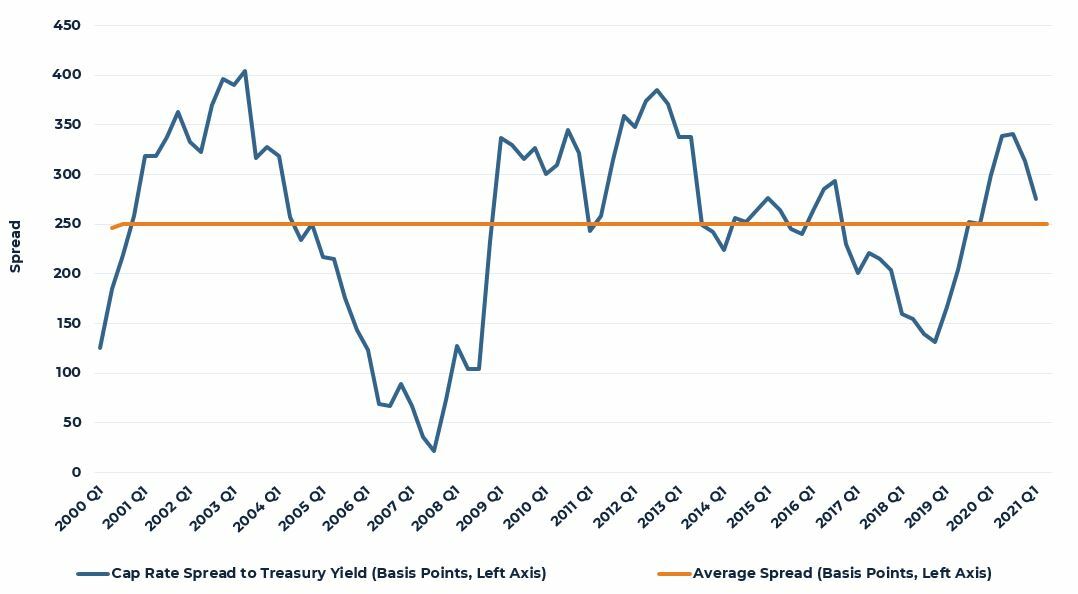
Source: NCREIF, Federal Reserve
At some point, however, investors will likely seek properties with sufficient earnings growth (NOI) to offset expected or observed increases in sovereign yields. For those properties demonstrating such growth, yields may compress even further in anticipation of future growth. Currently, investors expect to find these characteristics primarily in industrial properties, largely reflecting the significantly stronger NOI growth industrial properties have enjoyed in recent years (Figure 9).
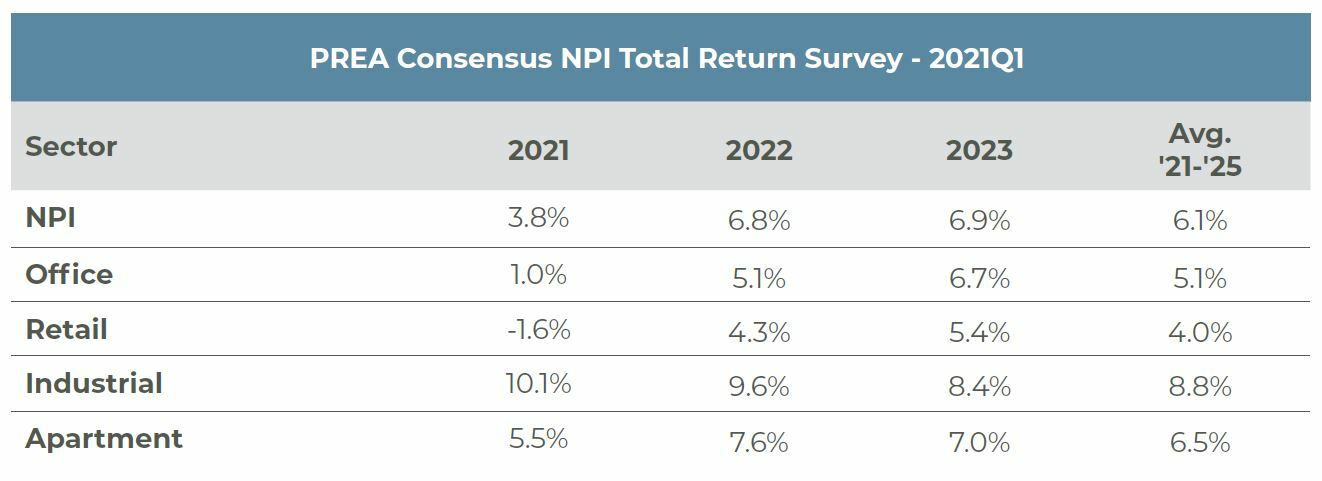
FIGURE 11
REAL ESTATE EXPECTED RETURNS 2021-2025
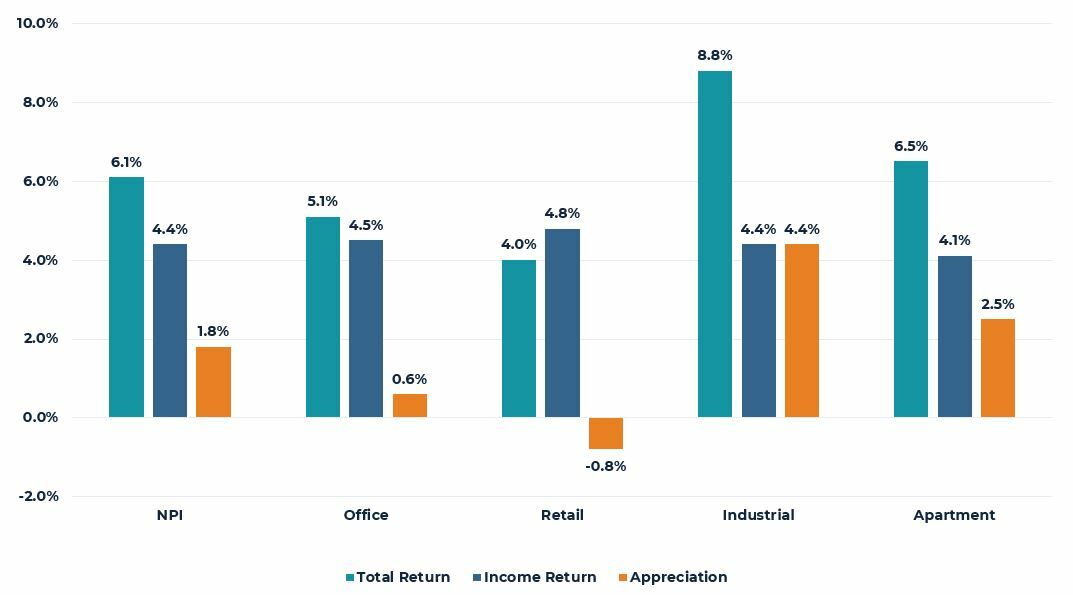
Source: PREA
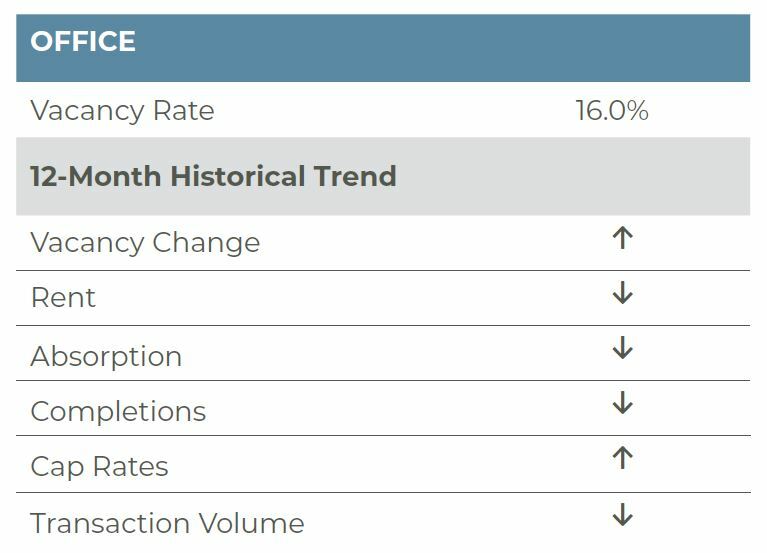
Office
Per CBRE-EA, office vacancies continued to increase in the first quarter of 2021, edging up 100 basis points (bps) from 2020Q4 and 370 bps year-over-year to 16.0%. Vacancies are now only 80 bps below the GFC cyclical high of 16.8% and are only 100 bps below the Tech Crash cyclical high of 17.0%. Total availability, however, is significantly higher at 22.1%, well above the 20.7% high during the tech downturn and nearly on par with the GFC historic high of 22.4%. As we have noted previously, performance varies greatly across markets, with dense, urban markets showing greater weakness. Dallas, Houston, San Diego, Austin, Miami, Phoenix, Fort Lauderdale, Nashville, Denver, Baltimore, Atlanta and Oakland all reported downtown availability rates above 25% while Los Angeles, San Francisco, Minneapolis, Fort Worth, Portland, Chicago and Washington D.C. reported availability between 23% and 25%. Overall, nearly half of all metro areas with a downtown cluster reported availability of 23% or more; in contrast less than one third of markets reported suburban availability of 23% or more.
While the market is currently challenged, the accelerating rollout of the COVID-19 vaccine and downward trends in positive cases, hospitalizations and deaths provides some optimism for the coming quarters. Further, after more than a year of work from home, companies appear to be firming plans for a return to the office. Amazon is leading the charge, announcing a “return to an office-centric culture as our baseline” with employees expected to be back in the office by the Fall. Fellow tech giants Google, Facebook, Microsoft and Uber all moved up their office re-openings from the Fall to the Spring (Facebook in May, Microsoft and Uber on March 29, Google in April); however, they were softer in their stances with respect to hybrid work versus the in-office mandate put forth by Amazon. JP Morgan also announced reopening plans for May 17; the bank’s offices will be limited to 50% capacity for now. It is expected the company will have some employees return full time, some hybrid and others full remote; thus, they have put 800,000 square feet of space in New York on the market for sublease. Overall, we believe most companies will still likely embrace a hybrid work environment, like JP Morgan, Google and Microsoft; however, a more near-term return to the office is a positive for the office markets and may allow for office markets to begin to stabilize.
AEW has modeled the impacts of hybrid and remote work scenarios and there is significant variation in office performance based on the assumptions used. Our base case outlook suggests as much as a 15% reduction in office demand from pre-pandemic levels. The impact on the sector will not be immediate, given the weighted-average lease term of seven years that persists in the market today. The bottom line is that double-digit vacancies are likely to persist for some time to come, limiting future rent growth.
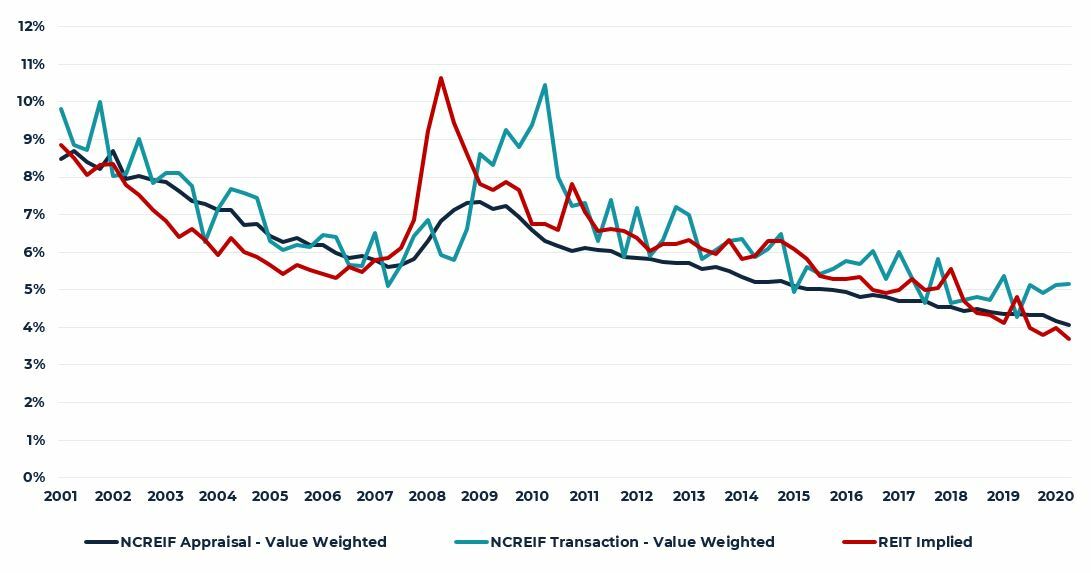
The listed REIT market has generally led the private direct market in incorporating these concerns over office space usage into valuations. As such, public and private market valuations have diverged, as shown in the chart on the following page. Private markets are lagging in their adjustment while REITs have perhaps overreacted. That said, a lack of transactions and clarity with respect to what a return to the office might look like have provided little information for value adjustments. PREA Consensus forecasts suggest a more than 3% average downward valuation adjustment in 2021. This, however, will vary by market and property subtype with some dense urban markets and older commodity product bearing the brunt of the weakness.
As we have stated in the past, in a post-COVID environment, performance will be bifurcated with the best properties, with the most up-to-date mechanical and HVAC systems, open concepts with better ventilation and access to amenities outperforming older, more commodity properties.
FIGURE 12
DOWNTOWN SUBMARKETS WITH THE GREATEST AVAILABILITY
AVAILABILITY RATES BY SUBTYPE
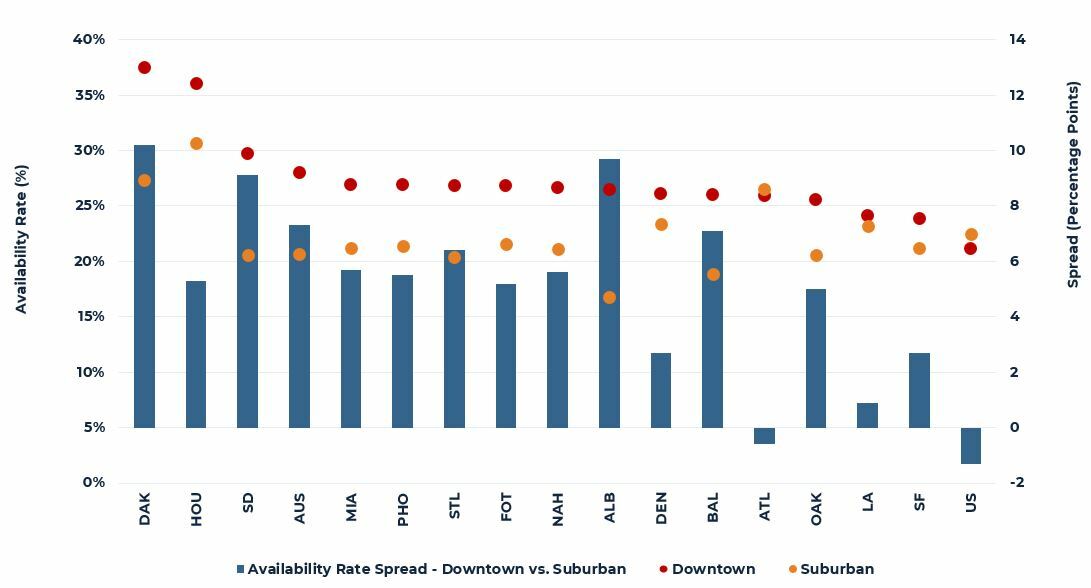
Source: CBRE-EA, AEW Research
FIGURE 13
OFFICE PUBLIC VS. PRIVATE MARKET PRICING –
OFFICE CAP RATES
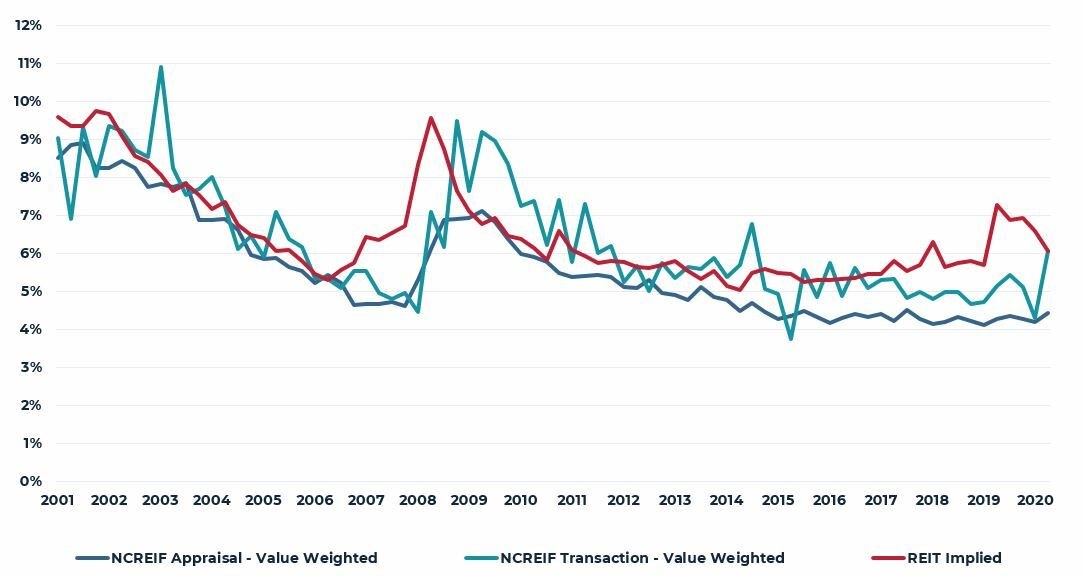
Source: NCREIF, Green Street
Source: CBRE-EA
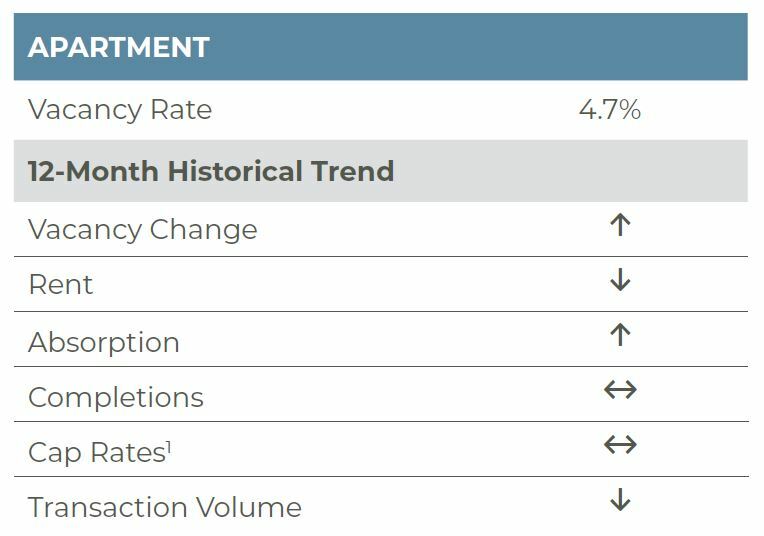
Apartment
According to preliminary data from CBRE-EA, the national apartment market vacancy rate was 4.7% as of the first quarter of 2021. This is an increase of 50 basis points (bps) year-over-year and 20 bps on the quarter. Although the vacancy rate has increased, it is still outperforming its historical average of 5.0% over the last 15 years. While the COVID-19 pandemic has certainly had a negative impact on the national apartment market, this shock has not been as detrimental as the GFC, when the U.S. vacancy rate increased from 6.1% to 7.0% in 2009.
The apartment rent collection rate has started to improve over the course of 2021. NMHC reports that as of the end of March 2021, 95.9% of apartment households have paid rent. While this is 130 bps below the pre-COVID rent payment share collected a year earlier in March 2020, this is a significant improvement from January (93.2%) and February (93.5%) 2021 rent collection rates. The rent collection rate should be monitored moving forward; however, the recently passed federal COVID-19 stimulus includes $25 billion for rental assistance plus additional funding for unemployment insurance and direct transfer payments to individuals ($1,400), which should support ongoing rent collection rates and economic recovery.
The ability to work remotely combined with curtailed cultural experiences in many urban areas has attracted renters to less dense markets where rent is less expensive. Smaller markets benefitting from lower vacancy rates as a result of this phenomenon include Riverside (1.8%), Providence (2.2%), Madison (2.7%), Detroit (2.9%), Hartford (3.1%), and Albuquerque (3.4%), all of which reported some of the lowest vacancies in 2021Q1. Of note, Sun Belt markets are outperforming traditional gateway markets; again, this is reflective of the ability to work remotely and movement towards lower cost and less dense markets. With effective vaccines developed and progressively rolling out, the apartment sector is beginning to see a steady uptick in demand broadly. Urban centers are still lagging, however, and will likely see a few more months of slower demand until reopening accelerates through 2021 in the urban core. The recovery in urban markets should be supported by young people once again forming their own households. Today, more than 50% of people aged 18-29 are currently living with a parent, the highest level since the Great Depression, per the Pew Research Center. Ultimately these young people will once again form households of their own and they will more than likely return to cities.
As those smaller, less dense markets have started to attract more tenants and see reductions in vacancies, institutional investors have caught on to the trend and are investing more in those affordable markets. Per Real Capital Analytics (RCA), Sun Belt markets are seeing increased sales volume from institutional investors. In 2021 year-to-date, markets like Dallas ($685 m), Atlanta ($571 m), and Phoenix ($454 m) are even surpassing traditional gateway markets like New York City ($430 m) or Seattle ($351 m). In 2020, Atlanta and Dallas had the largest volume of institutional investment of any U.S. metro, with those two being the only metros to surpass the $3 billion mark in institutional investment sales volume. Rent growth, demographic changes, and increasing demand are supporting the incentive to invest in these markets as the U.S. begins its economic recovery from the COVID-19 pandemic and subsequent economic shock.
Per RCA, institutional investment in U.S. multifamily had seen a dip during the start of the COVID-19 pandemic, but investment in the sector appears to be trending towards recovery. On a quarterly basis, 2021Q1 sales volume from institutional investors totaled $9.3 billion, down from the $18.3 billion seen in the previous quarter, but up from the $3.1 billion in sales seen in 2020Q2 or the $5.7 billion in sales seen in 2020Q3. On a rolling 4-quarter basis, 2021Q1 saw $36.3 billion in sales, again down from the $39.5 billion seen a quarter prior and down from the $52.1 B seen a year prior, but up from the $35.7 billion seen in 2020Q3. Overall, institutional investment in U.S. multifamily is recovering from the 2020 pandemic shock, revealing increased confidence in the long-term outlook from investors in the space.
Thus, going forward, multifamily remains a favored property type. The highest performing markets will be those with strong job growth and a combination of robust net in-migration and strong school systems, which will offer opportunities for above-average rent growth in the long-term. With this backdrop, buyers today are pricing through lease-up risk and cap rates have moved lower.
FIGURE 14
APARTMENT PUBLIC VS. PRIVATE MARKET PRICING
APARTMENT CAP RATES

Source: NCREIF, Green Street
Source: CBRE-EA
1NCREIF cap rates are lower due to weaker NOI; however, Real Capital Analytics transaction cap rates are flat.
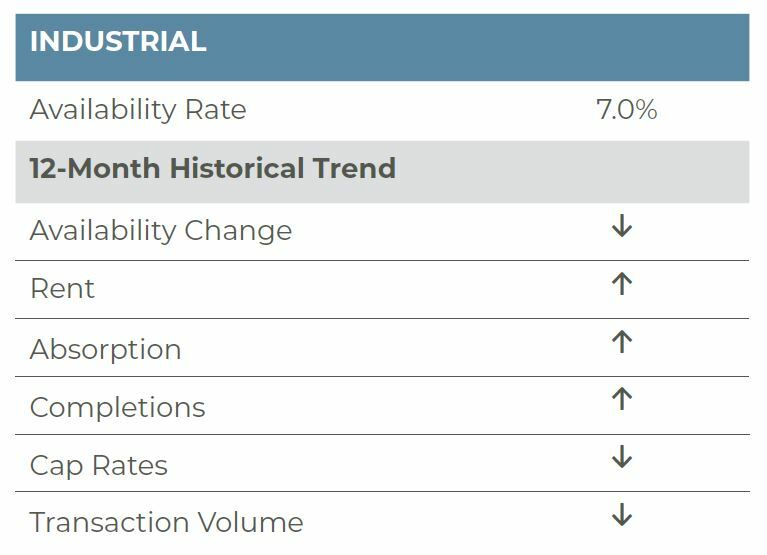
Industrial
Industrial property continues to outperform all other major property sectors. Availability has generally fluctuated in the 7.0%-7.5% range since 2017 and first-quarter 2021 performance was consistent with this. Per CBRE-EA, availability in the sector declined to 7.0% in 2021Q1, down 30 basis points from the previous quarter and a year earlier. The continued reopening of the U.S. economy and subsequent strong economic bounce back is helping to fuel demand for space. Amazon continues to be the nation’s largest lessee; however, demand is strong across the board with other e-commerce users (Wayfair, Zappos and Chewy), 3PLs (FedEx, DHL, Allen Distribution and Outsource Logistics), retailers (Wal-Mart, Lowe’s, Home Depot and Target) and goods producers (Subaru, Nike and Kohler) all contributing to demand. On the production side, several food and beverage-oriented producers and distributors have invested in their distribution infrastructure throughout the year (Gatorade, Pepsi-Cola and Kellogg’s), while others have even committed to additional manufacturing space (Briggs & Stratton, JAC Products and Merck & Co.). Per CoStar, over 15,000 leases were signed in 2021Q1 representing gross leasing of over 250 million square feet (msf); moreover, the number of leases executed year-to-date represents an increase of nearly 70% above the average leasing over the previous three years. Excluding renewals, net new leasing totaled nearly 100 msf in the quarter, well in excess of the 58 msf delivered in the quarter.
E-commerce demand, as noted above, remains strong with Amazon being a driving force behind said demand. Overall, Amazon continues to build out its distribution network, inking 19 new leases in 2021Q1, totaling 8.4 msf (445,000 sf on average) with a weighted-average lease term of 7.6 years. While Amazon was the single largest lessee of space, Amazon’s leasing accounted for 8.4% of net absorption in the quarter and 3.4% of gross leasing. Absent Amazon’s leasing, 2021Q1 net new demand would remain 1.7x the average Q1 volume over the past five years. Going forward, we anticipate e-commerce sales growth will slow from the breakneck pace of 30%+ quarterly year-over-year growth since the start of the pandemic. Still, even accounting for this expected slowdown in e-commerce sales, an additional 500 msf of warehouse space will be needed to accommodate e-commerce sales growth over the next four years.
On the supply side, the construction pipeline is active; however, construction remains relatively low by historical standards. Roughly 231 msf are currently underway for delivery in 2021. While this, coupled with the 58 msf delivered in 2021Q1, would yield the largest annual completions since 2000, it still represents only 2% growth in inventory and only slightly more than one year’s supply based on the demand trends of the previous five years. Beyond 2021, only 67 msf is underway for delivery, although we expect this will pick up further. Nevertheless, we fully expect demand will remain strong and match or outpace new supply in the future, preserving low availability and above-average rent growth in the years ahead.
With the strong fundamentals today and robust expectations for the future, industrial cap rates are compressing, and we are seeing this in both the public and private markets. Within the industrial sector, the cold storage subtype will be particularly strong, driven by growth in food consumption, production and temperature-controlled pharmaceuticals and limited supply.
FIGURE 15
STRONG E-COMMERCE GROWTH CONTINUES TO SUPPORT INDUSTRIAL FUNDAMENTALS
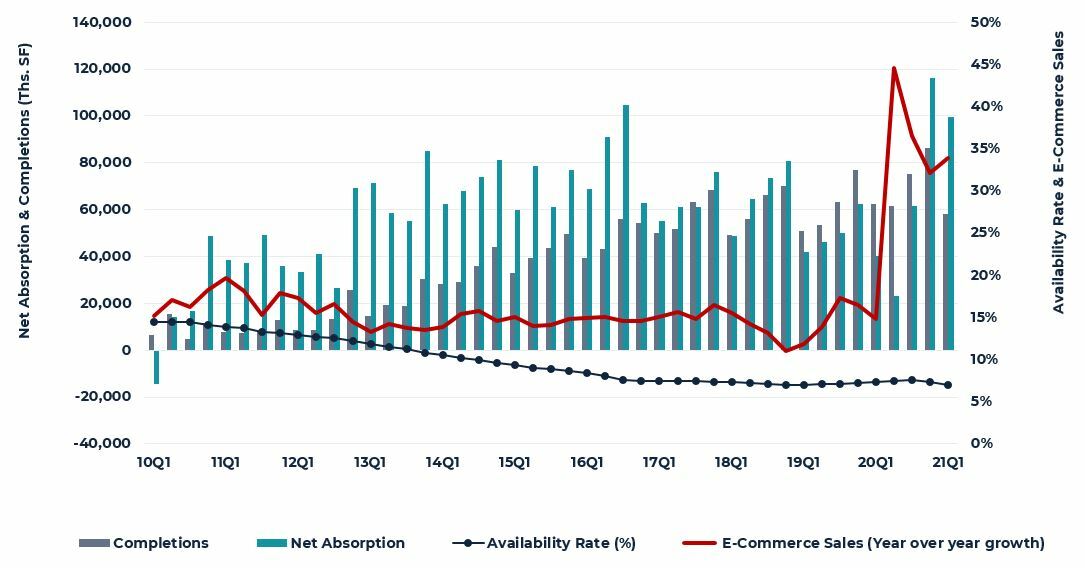
Source: CBRE-EA, Moody’s Analytics
FIGURE 16
INDUSTRIAL PUBLIC VS. PRIVATE MARKET PRICING — INDUSTRIAL CAP RATES
Source: NCREIF, Green Street
Source: CBRE-EA
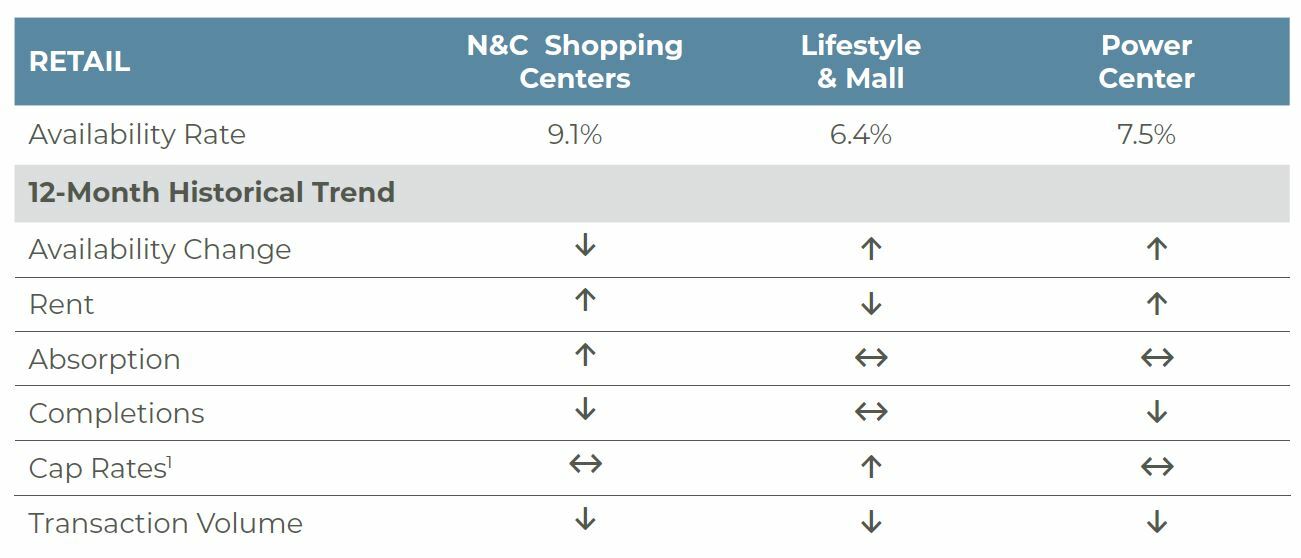
Retail
Total retail availability declined to 6.5% in the first quarter of 2021, a 10-basis-point improvement from 2020Q4 and the first decline in availability since 2019Q4. Total retail availability remains only 40 basis points (bps) above the pre-COVID low; however, this does not truly highlight the difficulties facing the retail sector. In aggregate, roughly 10.5 million square feet (msf) was returned to the market in 2020, the weakest demand since the GFC when 27.4 msf was returned to the market. Prior to the onset of COVID, however, demand had been steadily moderating, highlighting the challenges facing the sector, including increased online shopping, weak consumer and retailer finances, and competition from off-priced apparel.
These challenges have caused the most difficulty in the lifestyle and mall (L&M) and power center (PC) segments of the market. L&M availability remained at 6.4% in 2021Q1, but is up from 4.8% in early 2019. Demand within the L&M segment of the market has been negative in five of the last eight quarters, with roughly 6.4 msf being returned to the market over the period. Meanwhile, in the PC segment of the market, availability also remained flat quarter over quarter (QOQ) at 7.5%; however, this is up from a low of 5.3% in 2015Q4. Since then, demand has been negative in 12 of the last 18 quarters with 1.4 msf being returned to the market. This, coupled with the nearly 18.3 msf added to the market, pushed availability up 220 bps. Finally, the neighborhood and community shopping center (NCSC) segment of the market has not escaped COVID unscathed, but has performed better than the other market segments. While NCSC availability declined to 9.1% in 2021Q1, down 30 bps QOQ and 50 bps above the pre-COVID low. During the height of the COVID shutdown 17.6 msf of space was returned to the market; since then, however, demand has begun to accelerate. Net absorption turned positive in 2020Q4 with 1.1 msf in net new leasing, followed by 8.2 msf in 2021Q1, the largest quarterly demand since 2018Q4 and above the 7.2 msf quarterly average over the post-GFC and pre-COVID period (2012Q1-2019Q4).
The reopening of the U.S. economy and the stimulus packages passed at the end of 2020 and in March provide much needed support to the retail sector. Indeed, retail sales surged nearly 10% (8.2% ex. autos and gas) month over month and 27.7% (17.9% ex. autos and gas) year-over-year (YOY). On a YOY basis, clothing sales posted the strongest gain, increasing 101%, followed by sporting goods, hobby, musical instruments and bookstores (73.5%), and furniture (46.8%). The only category reporting a YOY decline in sales was the grocery sector (13.8%). This is likely owed to the reopening of the economy and the 36% increase in food service/drinking places sales, as well as the fact that March 2020 retail sales total included COVID-related stockpiling.
Going forward, spending is expected to slow in April, as the benefit from the $1,400 stimulus checks begins to wane, but there are plenty of tailwinds with the most notable being the ongoing rollout of vaccines. Nearly 148 million people (more than half of all U.S. adults) have received at least one dose of the vaccine while 106 million people (~40% of U.S. adults) have been fully-vaccinated, providing Americans with the confidence to get out more as the economy continues to reopen. This is likely to spur additional shifting in consumer dollars from more “at-home” categories like grocery, sporting and home goods to outward-facing categories like restaurants, apparel and travel. Overall, we still expect this will support a slow and modest recovery in the second half of 2021 and beyond. The challenges that existed in the sector pre-pandemic, including e-commerce competition and financial instability among retailers, have yet to be solved and this will weigh on the sector’s long-term prospects; however, better times are likely ahead.
With respect to valuations, the greatest divergence in public versus private cap rates is in the retail sector. Both the public and private sectors have depressed NOIs, but in the private sector this has resulted in a recent decline in cap rates. A lack of transaction activity is contributing to the wider public/private spread as private owners have little data to point to in order to assess values. Grocery anchored centers have the most clarity in pricing, as NOIs remain healthy and investor appetite continues for the product subtype based on the consumer necessity-focused tenancy. Going forward, Green Street projects better performance for the public sector relative to previous expectations due to the improved economic outlook. Green Street expects less tenant fallout than previously expected and, as such, their forecast for mall REIT NOI in 2022 has been revised higher, down 9% from 2019 levels (+300 bps from prior estimate). Mall asset values are up at the margin due to slightly higher NOI growth forecasts. Nominal cap rates by grade for both malls and outlets are effectively unchanged.
FIGURE 17
RETAIL PUBLIC VS. PRIVATE MARKET PRICING —
RETAIL CAP RATES
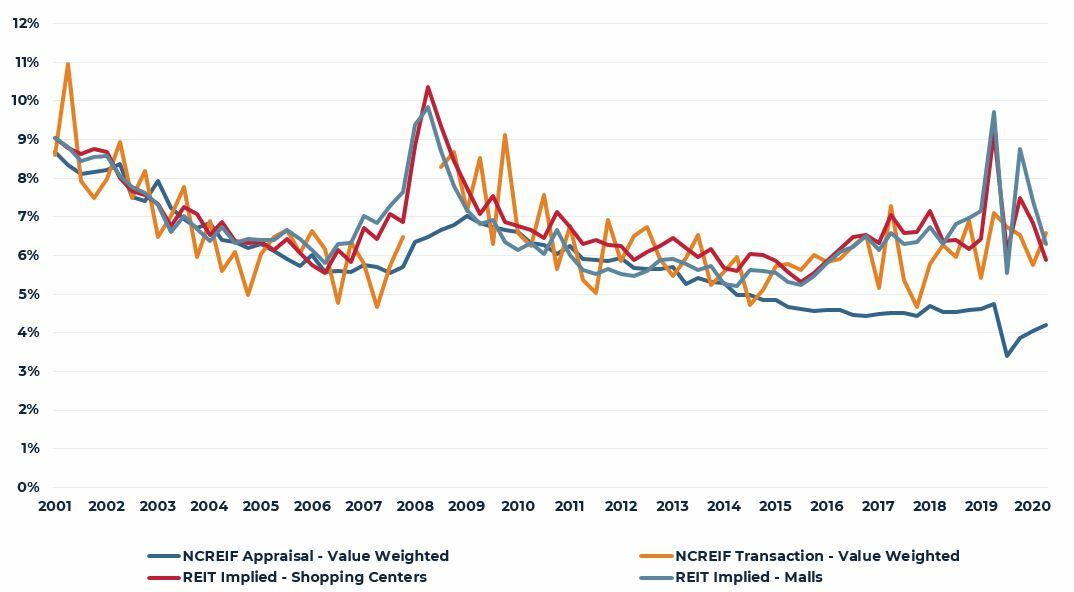
Source: NCREIF, Green Street
Source: CBRE-EA
1NCREIF cap rates are lower due to weaker NOI; however, Real Capital Analytics transaction cap rates are flat.
Capital Markets
Transaction activity remained below pre-COVID levels, but volume is up from the height of the pandemic and we except a further pick up as the U.S. economy continues to reopen. Overall, roughly $96.7 billion in properties changed hands in the quarter, down 28% YOY but up 87% from the COVID low. All property types reported lower YOY volume with the exception of hotels, which reported a 13% increase in transaction volume as $5.6 billion in hotel properties changed hands. Again, we expect volume will pick up in 2021, particularly as the vaccine continues to be rolled out, allowing for safer travel and greater property tours, and as closed-end fund investors are pressured to get investment dollars out.
By property type, $35.5 billion in apartment properties changed hands, accounting for more than one third of transaction volume. Among the remaining four core property types, office, industrial and retail followed at $20.5 billion (21.2% of all transactions), $19.6 billion (20.3%) and $7.8% billion (8.0%), respectively. Only $3.3 billion and $4.3 billion in seniors housing and development sites were sold in the quarter, 3.5% and 4.5% of volume, respectively. On a YOY basis, retail (-42%) and, surprisingly, industrial (-41%) reported the greatest decline in transaction volume, followed by development sites (-40%), office (-36%), apartment (-12%) and seniors housing (-8%). The softer volume relative to a year ago is not surprising, as the impact of the shutdown did not fully hit transaction volumes until 2020Q2. Indeed, 2020Q1 was all but over when the shutdown ensued and, as such, sales volumes had already accumulated to over $130 billion in the quarter.
While transaction volume is still somewhat soft, Real Capital Analytics (RCA) reports pricing generally remains firm. Per RCA, the National All-Property Commercial Property Price Indices (CPPI) increased 7.8% YOY in March, a continued acceleration from mid-2020. All core property sectors reported positive YOY growth in the month with even retail posting a modest 0.2% gain, the first appreciation in a year. The only subtype showing weakness was the CBD office sector where prices declined 2.4% YOY; suburban office price gains of 3.6% outweighed the CBD weakness yielding total office price appreciation of 2.9%. Industrial and apartment pricing remained robust, advancing 9.1% and 7.1%, respectively. By market segment, non-major market price growth continued to far outpace growth in major markets (Boston, Chicago, Los Angeles, New York, San Francisco and Washington, DC). The non-major market CPPI advanced 9.4% YOY versus 2.2% growth in the major market CPPI.
NCREIF return performance by sector remained unchanged in that industrial, apartment and office reported a positive quarterly return while retail posted its fifth consecutive negative quarterly return. Per NCRIEF, the industrial sector continued to lead all other property types with a total return of 4.72% in the quarter, driven by an income return of 1.08% and appreciation of 3.68%. On an annual basis, the total industrial return remained in double-digit territory at 14.11%, driven by income of 4.46% and appreciation of 9.34%. The apartment performance followed industrial with total quarterly and annual returns of 1.69% and 2.57%, respectively. Apartment appreciation was negative on an annual basis at -1.15%, but the sector is recovering with quarterly appreciation of 0.79%, a marked acceleration from 2020Q4 (0.11%), 2020Q3 (-0.40%) and 2020Q2 (-1.64%). Office and retail appreciation remained negative at -0.14% and -1.51%, respectively, in the quarter. Still solid office income (1.13%) yielded a total office return of 0.99%, outpacing the total returns of 0.48% and 0.31% in the previous two quarters. On an annual basis, the office sector return was 1.28% (-3.05% appreciation and 4.43% income) while retail again remained decidedly negative at -5.96% (-9.06% appreciation and 3.93% income). All retail subtypes reported meaningful depreciation; however, the capital value corrections in the super-regional and regional subtypes remained in double-digits at -11.99% and -12.78%, respectively.
NCREIF value-weighted cap rate movements were modest quarter-over-quarter, with office (24 bps), retail (15 bps) and apartment (7 bps) reporting a slight expansion and industrial reporting an 11-bps contraction. Industrial cap rates dropped to 4.07%, while office, retail and apartment cap rates stood at 4.45%, 4.20% and 3.53%, respectively. The exceptionally low apartment cap rate is partially the result of softer NOI, while the industrial cap rate movement is reflective of the strong fundamentals and investor interest in the sector. Going forward, we do not expect any significant movement in cap rates in the near-term, with the possible exception of non-gateway industrial markets, which may decline modestly.
FIGURE 18
TRANSACTION VOLUME & PRICING
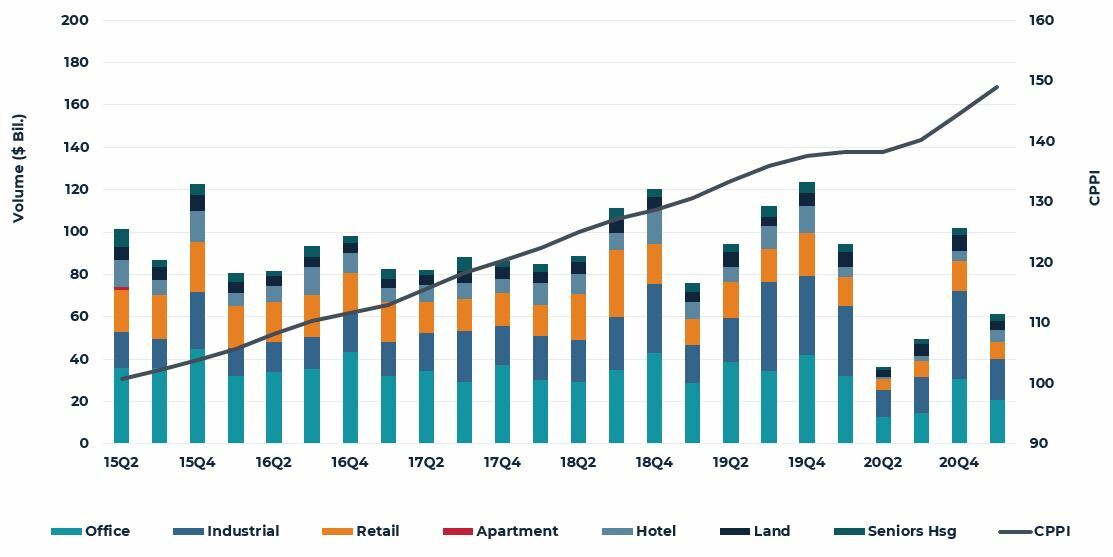
Source: Real Capital Analytics
Source: PREA
This material is intended for information purposes only and does not constitute investment advice or a recommendation. The information and opinions contained in the material have been compiled or arrived at based upon information obtained from sources believed to be reliable, but we do not guarantee its accuracy, completeness or fairness. Opinions expressed reflect prevailing market conditions and are subject to change. Neither this material, nor any of its contents, may be used for any purpose without the consent and knowledge of AEW.