2020 Q2 – The Great Re-Opening Begins
The U.S. economy contracted at an annual rate of nearly 33% during the second quarter, marking the sharpest and most severe economic contraction in the United States since the 1930’s Great Depression. More significantly, the second-quarter contraction marks the first time since the 1930s that both real GDP and total employment declined at an annual rate of more than 5%. Indeed, both real GDP and total employment declined by roughly 10% (year-over-year) during the second quarter.
FIGURE 1
YEAR-OVER-YEAR GROWTH IN REAL GDP AND TOTAL EMPLOYMENT 
Source: Bureau of Economic Analysis (BEA)
As dramatic as the contraction was during March and April, the resurgence of growth during the latter part of the second quarter has been equally stunning as economic re-opening played out during May and June. Payroll data shows more than 22 million jobs lost during March and April and 7.5 million regained during May and June. While significant, this surge in hiring still leaves U.S. total employment more than 14 million below the February (pre-COVID shutdown) level. For perspective, the entire peak-to-trough decline in total employment during the financial crisis was only 8.7 million and that decline took 25 months. Also, prior to this year, the largest monthly decline in total employment was 1.9 million at the very end of World War II (September 1945) and the largest monthly gain was 1.1 million at the end of the 1982 recession (September 1983).
FIGURE 2
TOTAL EMPLOYMENT AND MONTH-TO-MONTH CHANGE (000s)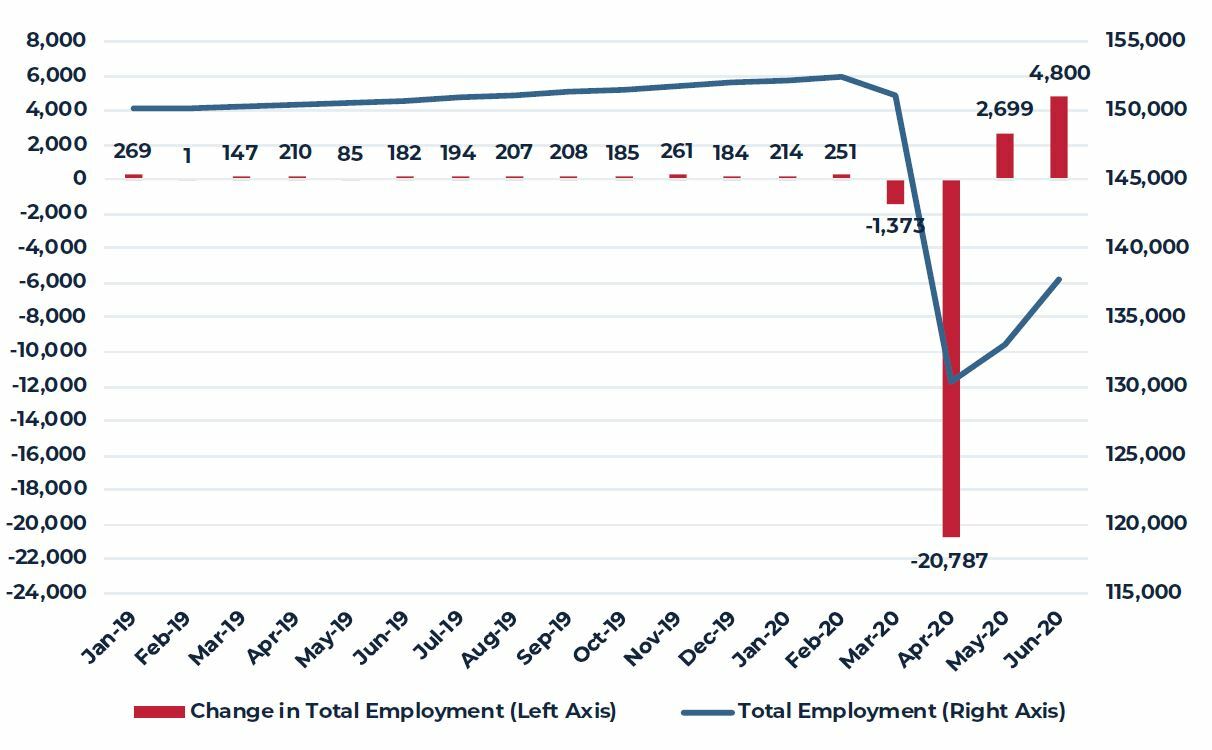
Source: Moody’s Analytics
Thus far, much of the economic data corresponds with the widely hoped for “V-shaped” recovery following the notion that the economy was in fairly good shape prior to the coronavirus outbreak and therefore should be able to quickly return to prior form after the virus is no longer a threat. While this outcome would clearly be desirable for nearly everyone, it increasingly seems less likely for several reasons. First, following a prolonged period of improving infection data from the earliest impacted states of the Northeast, new cases are now accelerating rapidly across the Southeast, Southwest and Pacific states. Reflecting this, economic growth is already slowing in many of these states as voluntary or mandated economic restrictions increase. This slowdown is illustrated by any one of several real time data sources. For example, daily restaurant reservations compared to the same day in the prior year are an easy to understand measure of overall sentiment as consumers need to be both economically and virus confident to dine in an establishment rather than at home. Figures 3 and 4 together show the acceleration in new infections across Florida, Texas and California as well as the subsequent slowdown in economic activity as represented by restaurant activity.
FIGURE 3
DAILY INCREASE IN COVID-19 CASES – 7-DAY MOVING AVERAGE 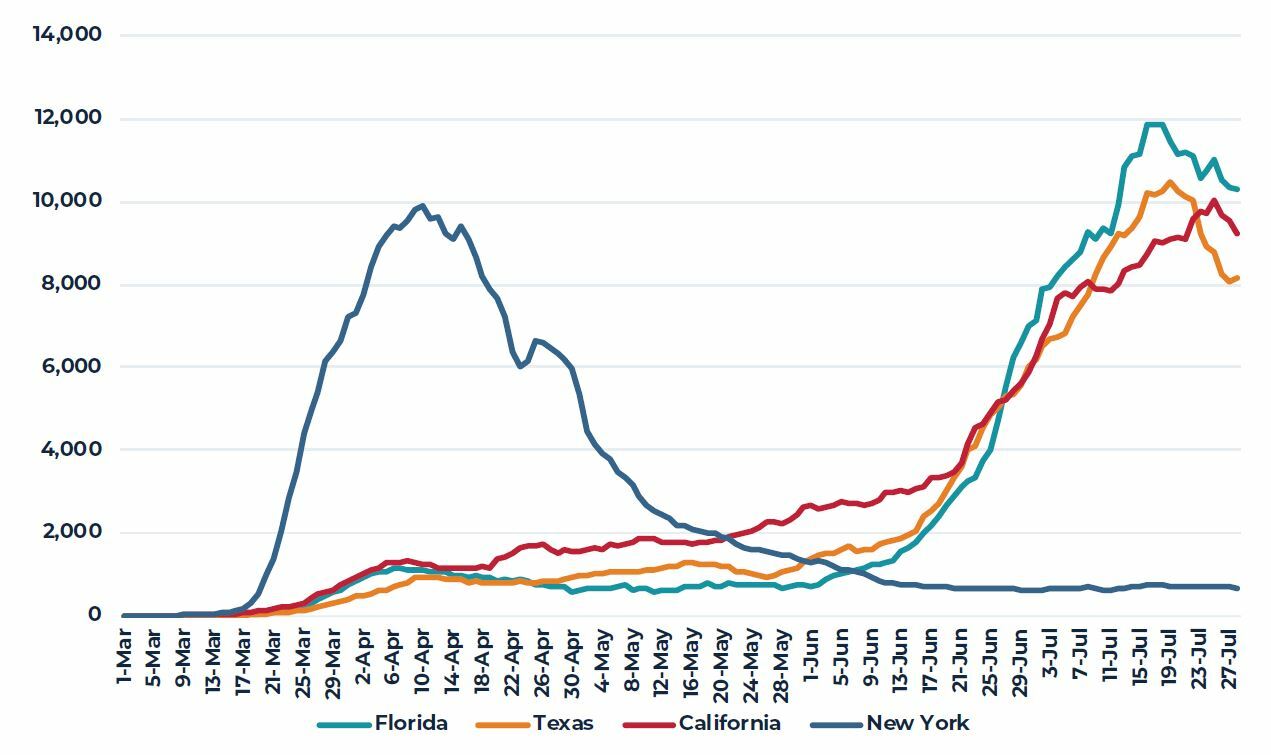
Source: New York Times (GitHub)
FIGURE 4
DAILY RESTAURANT RESERVATIONS – PERCENT CHANGE FROM YEAR PRIOR
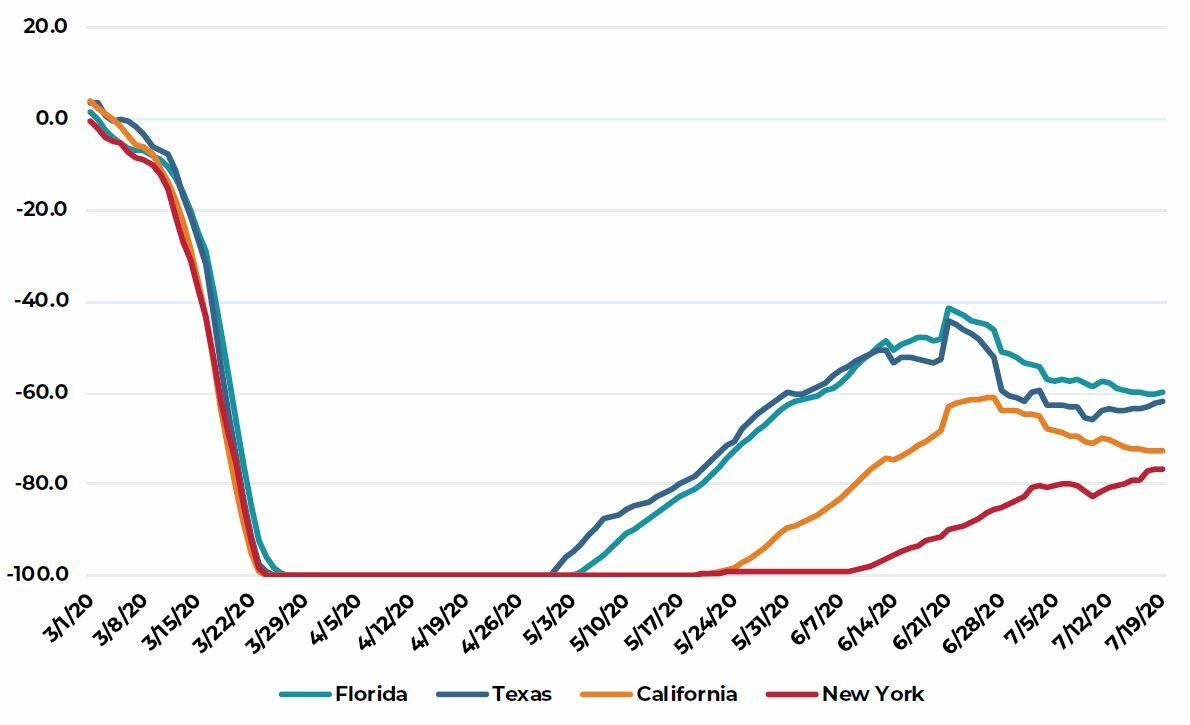
Source: New York Times (GitHub)
Additionally, the abrupt shutdown of economic activity during March and April has negatively impacted state and local government finances as all manner of tax collections plummeted (sales tax, income tax, property tax, toll collections, etc.). As a result, state and local government employment has already fallen by nearly 1.5 million and did not rebound at all during May and June as private employment began to recover. Absent significant fiscal infusions from the federal government, many state and local governments across the country are expected to cut more jobs through the remainder of this year and, perhaps, into 2021. Similar cuts are also expected across numerous college and university systems, particularly if students are not able to fully return to campus in the fall. Currently, data from the Institute of Higher Learning shows that nearly all colleges and universities have announced their plans for the upcoming semester and only slightly more than half (52%) expect to be fully in person on campus this fall with roughly one-third planning for a hybrid model (in person and online) or fully online (11%).
Reflecting the second-order employment effects discussed above as well as the expectation that some portion of impacted businesses (e.g. restaurants, retail stores, gyms, etc.) simply never reopen, the current near-term outlook for the U.S. economy is best described as an initial but short-lived period of V-shape recovery, which restores some but not all of the lost jobs and output (GDP), followed by a longer protracted period of slower recovery (Figure 5). In this scenario, the U.S. economy returns to pre-COVID levels of employment and GDP during 2023. Obviously, anything that accelerates the diminution of infection concerns, such as effective vaccines or greatly improved therapeutics, would likely shorten this timeframe.
FIGURE 5
OUTLOOK FOR THE U.S. ECONOMY 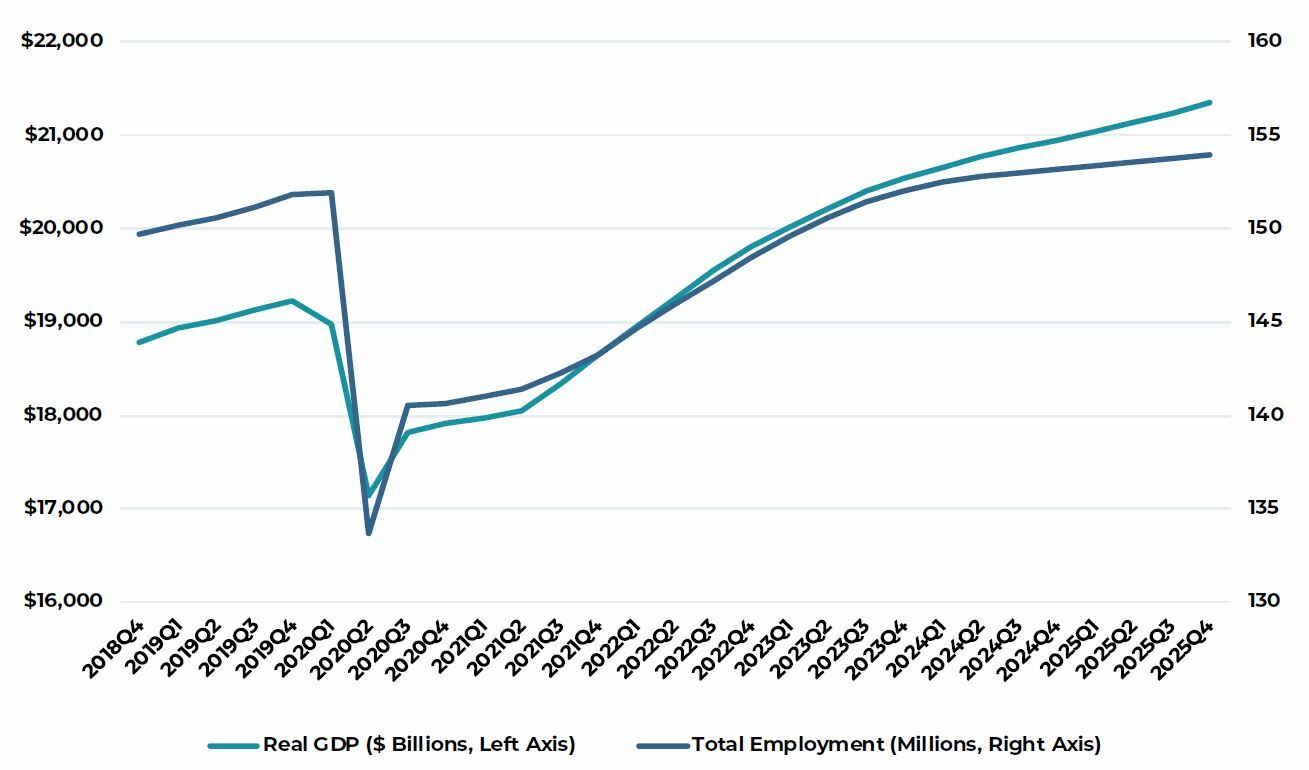
Source: Moody’s Analytics
Property Markets
First-quarter property market data did not reflect the rapid and severe economic contraction that occurred. The events simply happened too late in the quarter to be captured by conventional metrics such as vacancy rates, leasing activity or rents. Second-quarter data, however, is beginning to reveal some of the direct property market impacts. For example, vacancy/availability rates across all primary property sectors increased during the second quarter.
FIGURE 6
OCCUPANCY/AVAILABILITY RATES BY PROPERTY TYPE
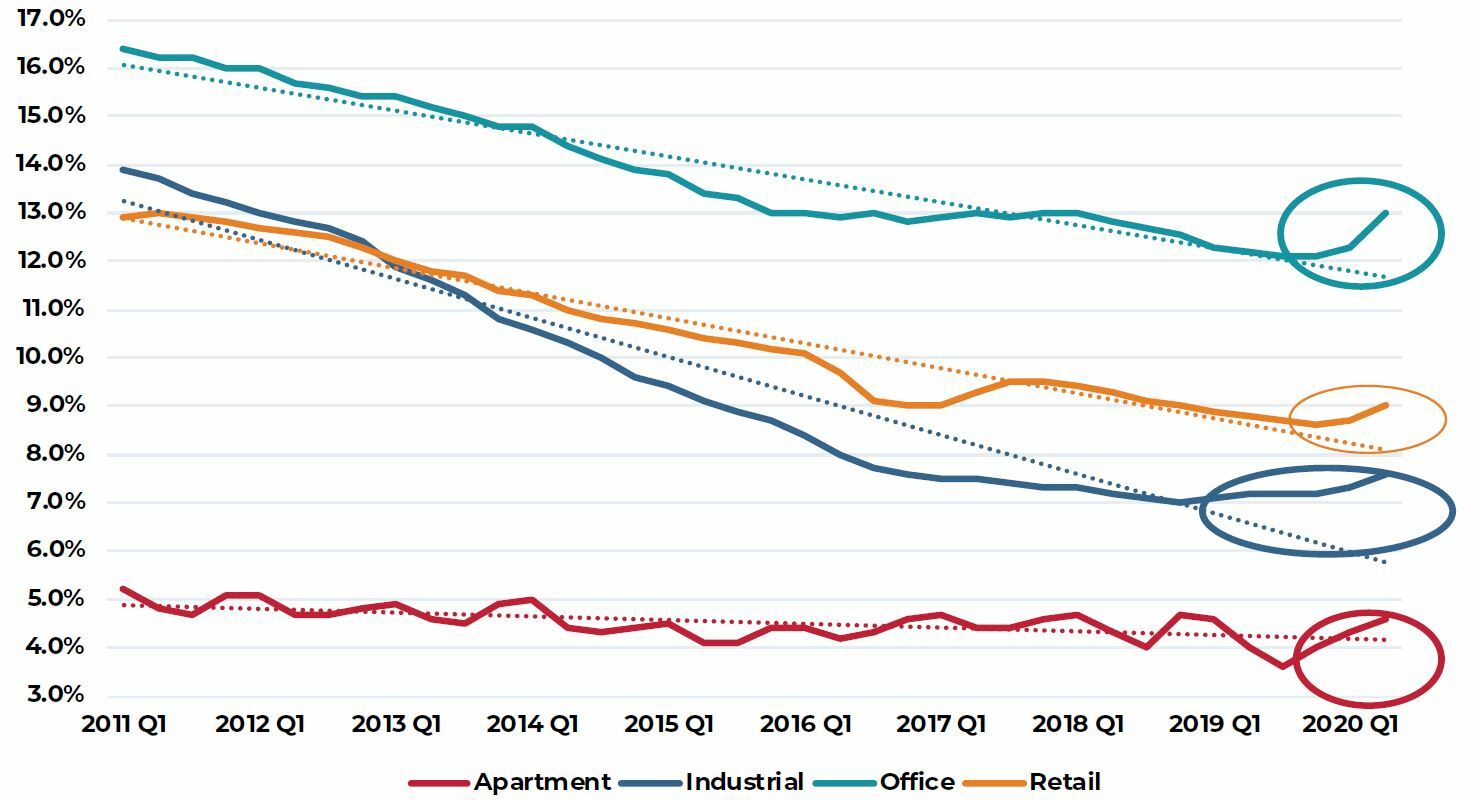
Source: CBRE-EA 2020 Q2
Similarly, recent transaction data also reveal significant negative impacts from the COVID-19 induced shutdowns. Except for industrial properties, virtually all parts of the transaction market are operating far below first-quarter levels as well as levels recorded during the same period in 2019. Not surprisingly, hotel property transaction show the largest decline with a nearly total shutdown of trades during the second quarter relative to 2019.
FIGURE 7
TRANSACTION VOLUME BY PROPERTY TYPE
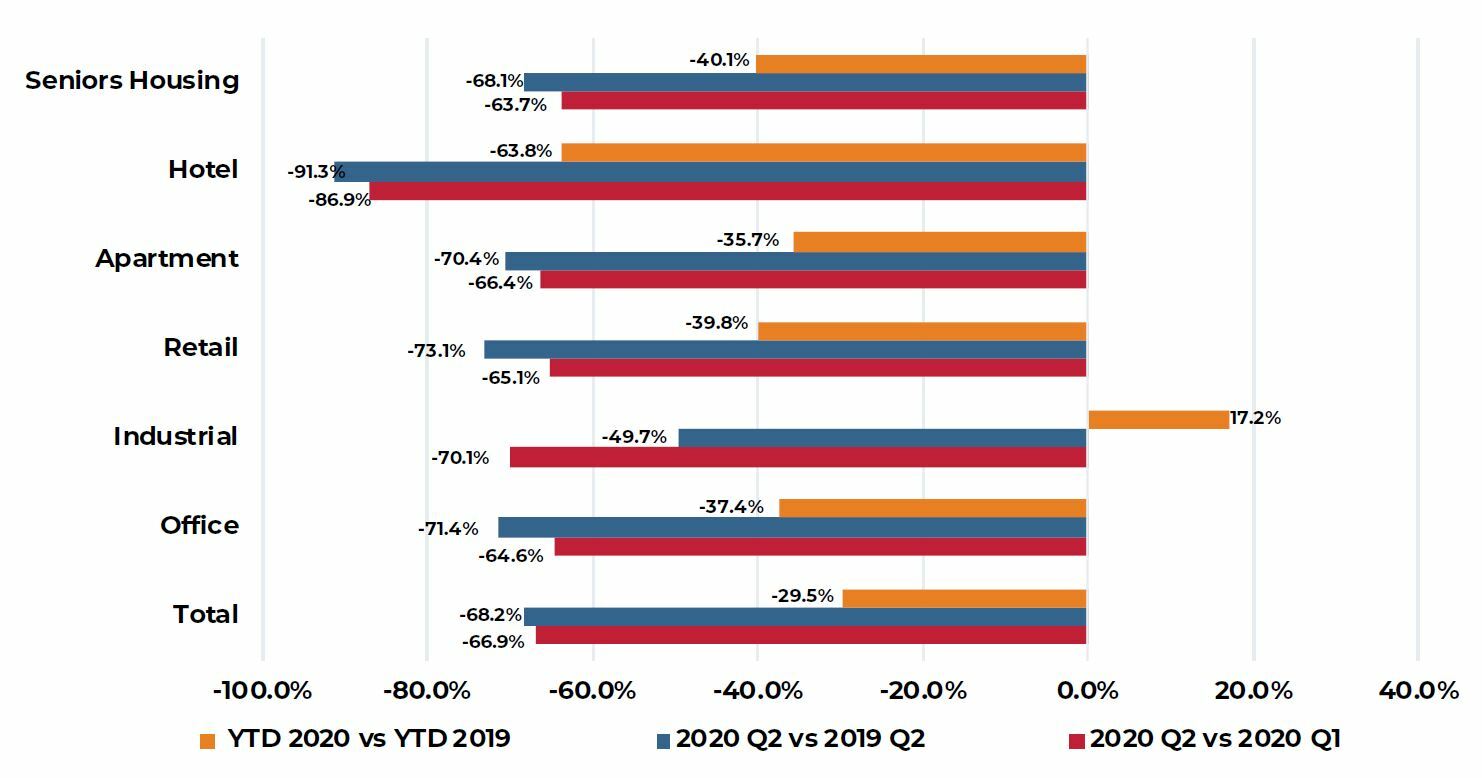
Source: Real Capital Analytics 2020 Q2
With limited visibility on property market operating fundamentals and transaction activity, near-term investment conviction will likely remain low, particularly in situations where the property income is uncertain. This is particularly true today in hotels, regional malls, some other retail formats and certain office properties. Income visibility and conviction is much higher in most industrial properties and, to a lesser degree, apartments. Reflecting this, the most recent investor consensus survey suggests modest appreciation in industrial and apartment properties over the next five years largely offset by valuation declines in retail and, to a lesser extent, office properties.
FIGURE 8
FIVE-YEAR EXPECTED RETURN OUTLOOK 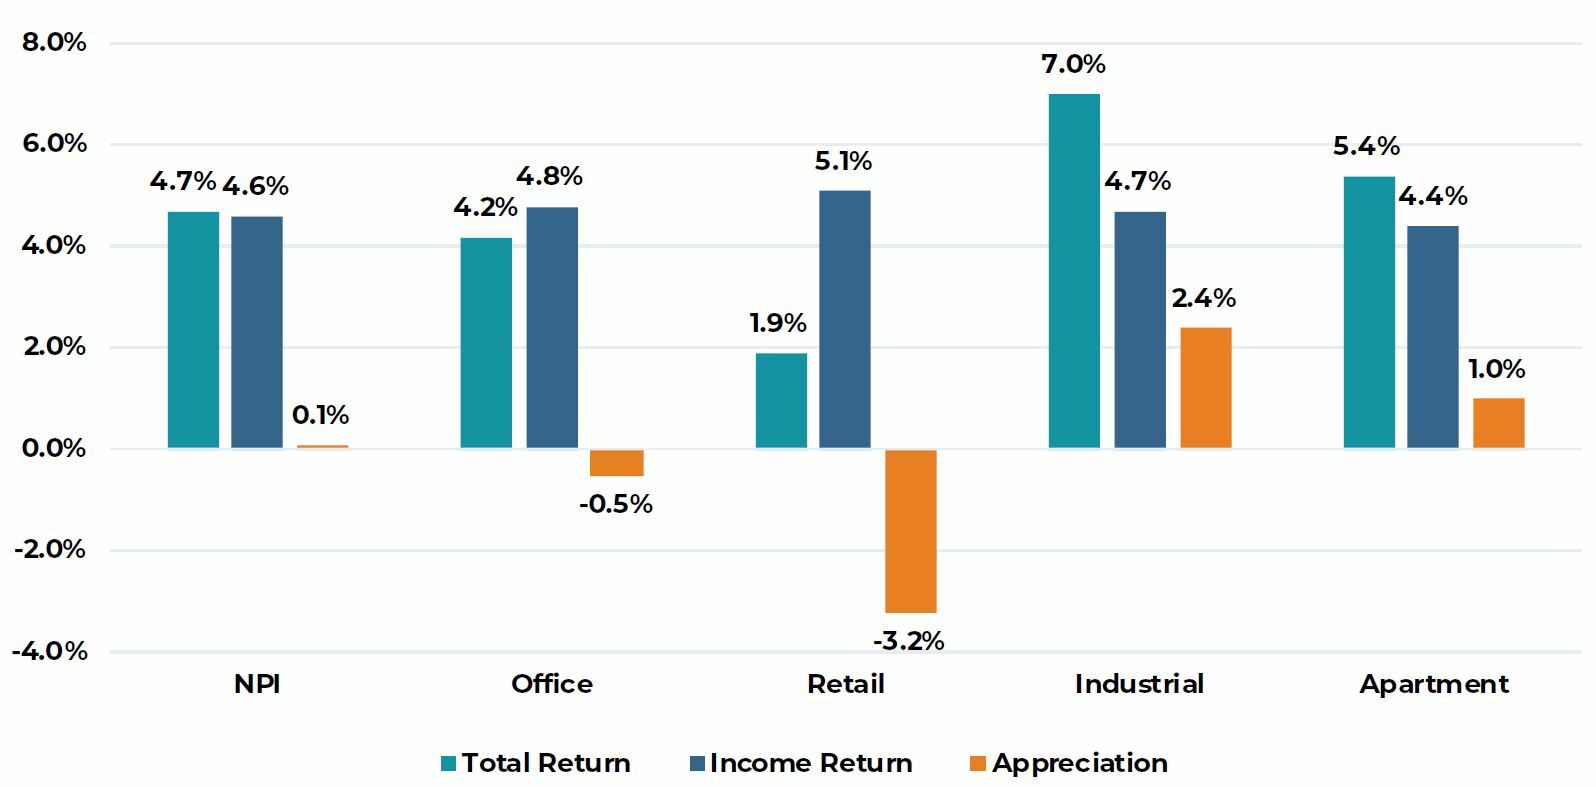
Source: PREA, 2020 Q2 Consensus Survey
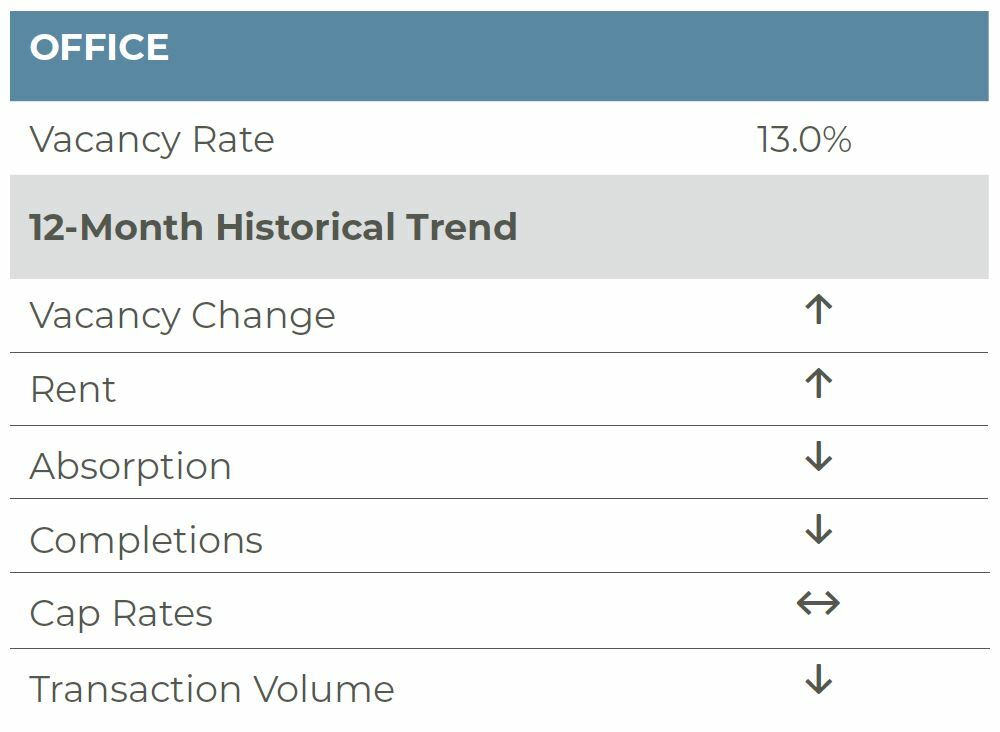
Office
The impact of the pandemic and the ensuing economic downturn is flowing through into the latest office market data released from CBRE-EA. Vacancies increased to 13.0% in the second quarter of 2020, up 70 basis points (bps) from the previous quarter and 80 bps from a year earlier. Per CBRE-EA, 21.5 million square feet (msf) was returned to the market in the quarter, offsetting the positive net absorption of 4.7 msf in the first quarter and pushing year-to-date absorption to negative 16.7 msf. Construction activity slowed significantly in the quarter, the result of COVID-related construction bans. Overall, less than 8 msf of space was completed in the second quarter, the lowest quarterly total since mid-2015.
The weakness in the office sector was widespread with increases in vacancies in both downtown and suburban markets in the quarter. The aggregate U.S. downtown market segment reported vacancies of 11.4%, up 80 bps from the previous quarter and 100 bps from a year ago. Roughly 9.5 msf of space was returned to the market while 2.2 msf was completed. Year to date, 10 msf of space has been returned to the market while 5.8 msf has been added to the market. The suburban performance has been similar, with vacancies increasing to 13.8% in the quarter, up 60 and 70 bps from the previous quarter and year, respectively. Like the downtown segment of the market, net absorption was negative in the quarter (-12 msf) and year to date (-7 msf). Meanwhile, 5.5 msf was added to the market in the second quarter; this coupled with the first completions brought the year-to-date new supply tally to 13.4 msf. So far, the suburbs are on pace to deliver roughly 18% less space this year relative to the previous five years, while the pace of construction activity in downtown markets is roughly 13% lower.
Regionally, 46 of the nation’s top 53 markets reported an increase in vacancies in the quarter; this compares to only 23 markets in the first quarter and 28 in the fourth quarter of 2019. San Francisco, Orlando, Nashville, Salt Lake City and Denver were among the markets reporting the greatest increase in vacancies in the quarter. Vacancies in San Francisco increased 220 bps to 8.0% with the increase solely driven by weak demand. Indeed, 2.1 msf of space was returned to the market while only 115,000 square feet was completed. Further, sublease space is on the rise in the market and there is concern that permanent shifts to working from home may put additional upward pressure on vacancies. The concern regarding work from home is being driven by some the metro area’s largest tech tenants like Facebook, Twitter and Square, which are offering employees the opportunity to work from home, or anywhere, permanently. Of note, however, is that Facebook has stated they will amend pay to reflect where employees work from home — reducing pay if employees choose to relocate to lower cost areas. Over the next 5-10 years, Facebook expects 50% of its employees will work outside of its offices; still, Facebook anticipates it will occupy more space in the future as increased headcount will necessitate additional space requirements. Likewise, Twitter, while offering a permanent work-from-home option, has stated they will continue to occupy their downtown headquarters. Going forward, we will also continue to monitor coworking platforms, particularly WeWork, which could be another source of demand weakness in the quarters ahead for both San Francisco and markets across the country. To date, coworking concepts occupy 3.6% of space in San Francisco and 25% of this space is tied to month-to-month memberships, a segment of the market that is at greater risk if members terminate and the coworking firms return space to the market — this has happened already at 149 Madison Avenue in New York. Despite these near-term headwinds, the long-term prospects for the San Francisco market remain favorable, with continued growth expected from tenants like Facebook, Visa, Salesforce and Google.
More broadly, with respect to the office sector, the pandemic has forced a large-scale work-from-home “experiment,” which has largely been successful, thus raising concerns for the broader office sector. If more companies, like those mentioned in San Francisco, offer permanent work-from-home opportunities, will the U.S. suddenly have a glut of space? Or, will social distancing requirements offset the impact of lower in-office headcounts? Additionally, will workers return to large office towers in downtown areas or will the low- or mid-rise suburban properties win out? As we noted last quarter, in other parts of the globe, workers have successfully returned to office buildings, including large towers, and work from home has not been adopted permanently. Further, leases for office space continue to be executed today, with AIG, Microsoft, JPMorgan Chase, Lockheed Martin, Walmart Labs and TikTok being among many companies signing large leases in urban office towers since the beginning of May. This gives some comfort and conviction with regard to the sector long term. There will be near-term pain; however, the expected economic growth anticipated in 2021 and beyond, coupled with favorable prospects for a COVID-19 vaccine, suggest office fundamentals should firm over the long term.
Apartment
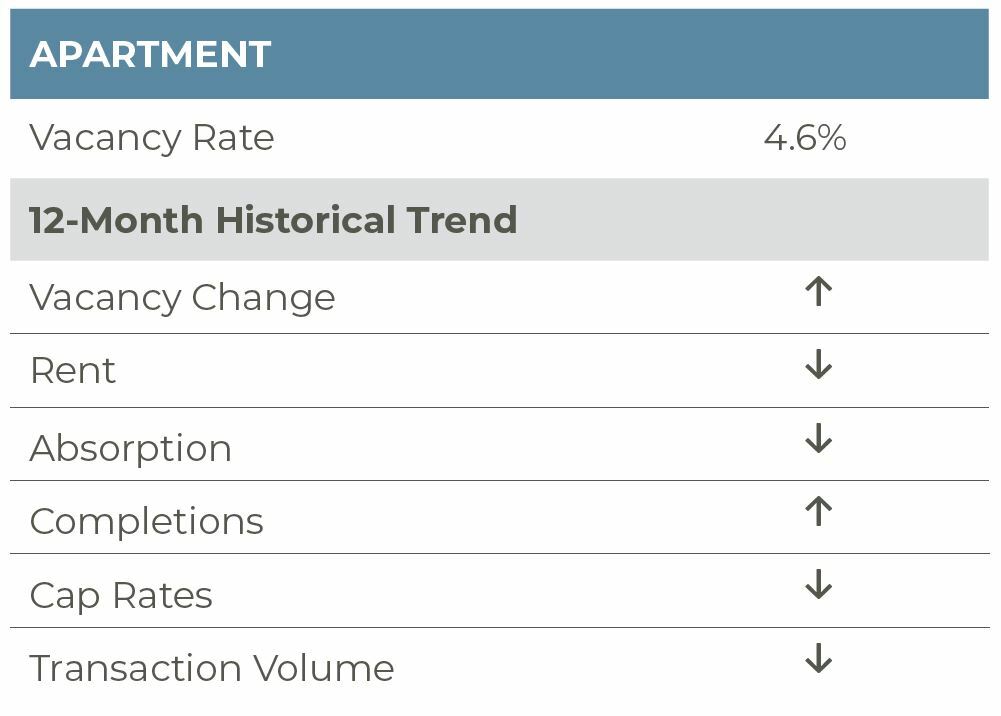
As the data for the second quarter of 2020 have begun to be released, a clearer picture of the impact of the COVID-19 pandemic on the U.S. apartment market has started to emerge. According to preliminary data from CBRE-EA, second-quarter vacancies stood at 4.6%, up 70 basis points (bps) from a year earlier and up 40 bps from the prior quarter. That said, during the height of the Great Financial Crisis, the U.S. national apartment vacancy rate rose to a peak of 7.3% in mid-2009, up 280 bps from a pre-crisis low of 4.5% in late-2006. Thus, in comparison, and considering the magnitude of economic shock brought about by the COVID-19 pandemic, a 70-bps increase in vacancies to date is relatively modest.
The increase in vacancy rates was widespread across markets, with 54 of 66 markets tracked by CBRE-EA reporting an increase in vacancies on a year-over-year (YOY) basis. This is in stark contrast to the previous quarter, as 2020Q1 saw almost the same number of markets reporting a decrease in vacancy rates YOY. In 2020Q2, 13 markets reported an increase in vacancy rates of over 100 bps; the largest increases were seen in Honolulu (210 bps), San Francisco (190 bps), Louisville (160 bps), and Orlando (130 bps). Meanwhile, only three markets reported a decrease in vacancies of 50 bps or more. El Paso reported a vacancy rate of 4.0% (-230 bps YOY), Tucson reported vacancies of 4.2% (-50 bps YOY), in Tulsa, vacancies improved to 5.0% (-50 bps YOY).
Green Street Advisors are reporting that suburban multifamily properties are outperforming properties in more urban settings. This is a departure from the urbanization trends that have occurred over the last few years. In major apartment markets, suburban properties have asking rent growth that is nearly 400 bps higher than asking rent growth for urban properties within a given market. Additionally, per CoStar, 49% of CBD properties have reported higher vacancies compared to the prior six months, while only 35% of suburban properties report the same. As many office employees continue to work from home, the preference of being located within a short commute of a market’s CBD has become less important. Further, with cities having a continued shutdown of nightlife and entertainment options, the perks of city living are paused.
Another departure from previous trends resulting from the current pandemic is the bolstered demand for non-luxury apartments. The 12-month deliveries are up YOY for both the Class A and Class B/C market segments, while 12-month net absorption for both subtypes is down. However, as of 2020Q2, CoStar has reported that Class A vacancy rates are up an average of 200 bps year over year, while Class B/C properties are up an average of 50 bps. Additionally, Class A properties have seen –2.0% effective rent growth per unit on the quarter, while Class B/C rents have been able to hold more steady with rent growth of 0.1% on the quarter.
The rent collection rate has remained solid for the apartment sector. NMHC reports that as of July 20, 2020, 91.3% of apartment households have paid rent. This is just 2.1 percentage points below the rent payment share given on July 20, 2019. Per NCREIF as of July 2020, the fund rent collection rate for the apartment sector is 92.3%. This puts the sector’s rent collection rate on par with industrial (92.2%) and above office (90.6%) and retail (60.5%). However, it should be noted that the extended unemployment benefits funded by the U.S. government will expire at the end of this month, and that may impact unemployed renters’ ability to make their monthly payment. With the Bureau of Labor Statistics reporting nearly 3 million initial claims filed for pandemic unemployment assistance in July alone, the extension of unemployment benefits is crucial for maintaining a high rent collection rate in the sector.
JULY YOY ASKING RENT GROWTH FOR INSTITUTIONAL QUALITY APARTMENTS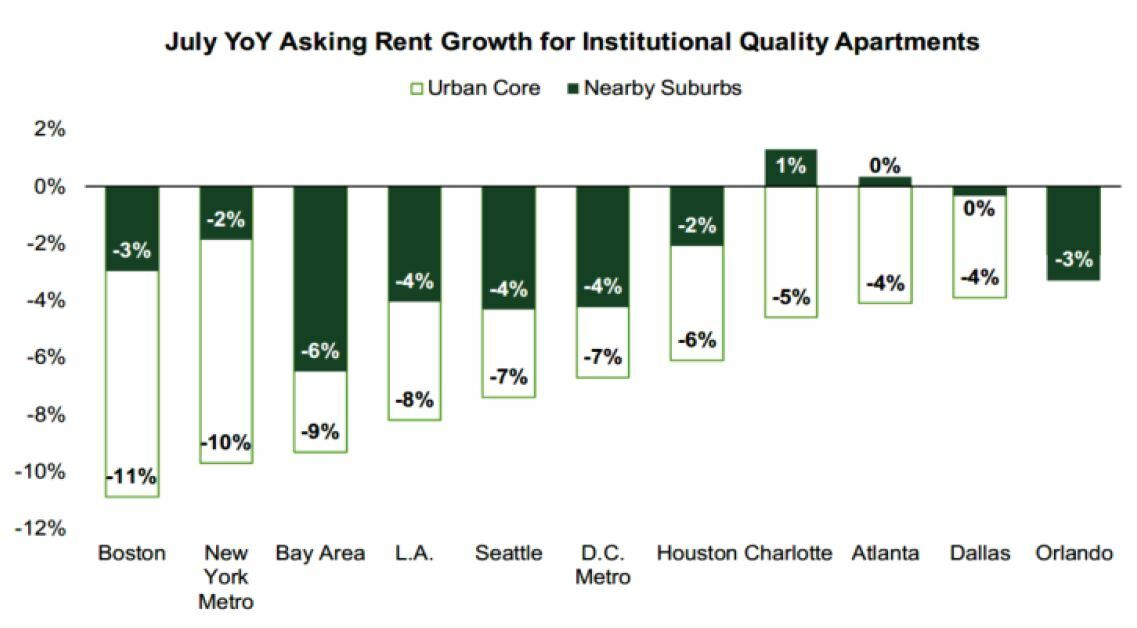
Source: Green Street Advisors
% OF PROPERTIES REPORTING HIGHER VACANCY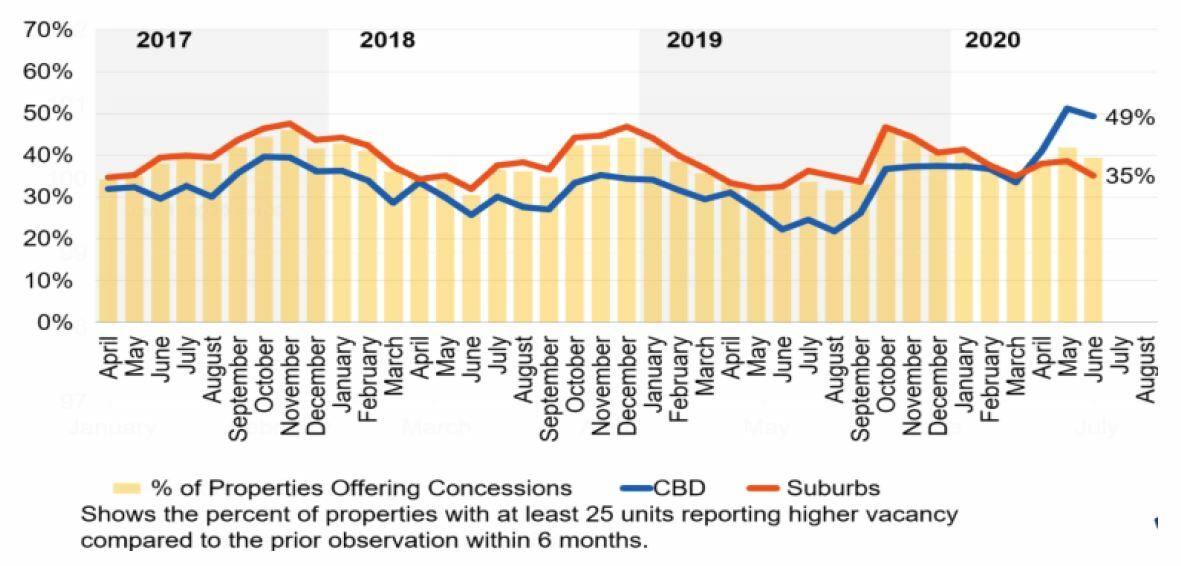
Source: CoStar
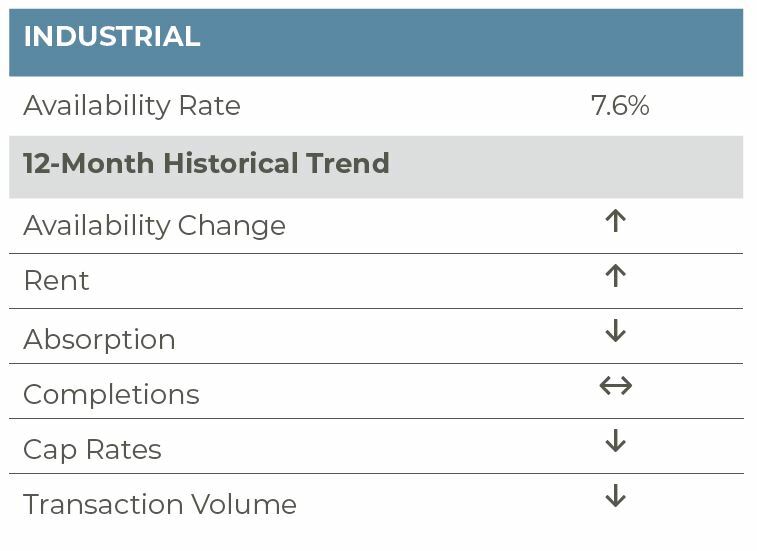
Industrial
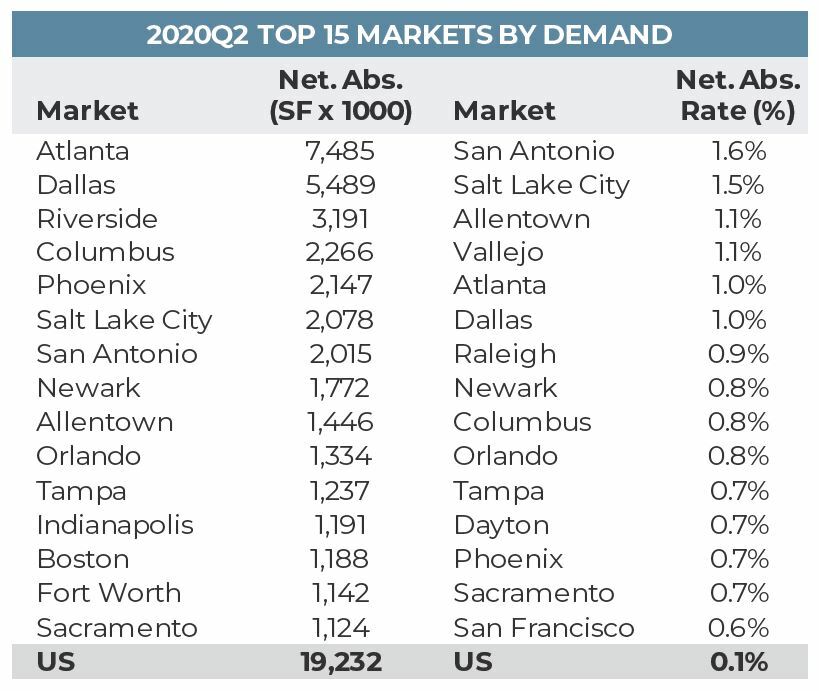
The industrial sector reported the first meaningful increase in availability since late 2009. Per CBRE-EA, availability increased to 7.6% in the second quarter of 2020, up 30 basis points (bps) from the previous quarter and 50 bps from a year earlier. While availability increased, demand remained healthy, given the widespread shutdown of the U.S. economy. Nearly 20 million square feet (msf) was absorbed in the quarter, roughly half the rate of the second quarter last year, but still relatively healthy given a lack of travel and economic activity in general. Contrary to popular belief, Amazon is not responsible for all of the leasing that has occurred since March. Per CoStar, Amazon has accounted for roughly 12% of leasing since March; other large new leases have been executed by 3PLs/logistics operators (FedEx, Geodi, Uline, etc.), Walmart and Target. Overall, the market remains bifurcated with large logistics and distributions properties continuing to outperform smaller or more flex properties and this is particularly notable in recent leasing highlighted above. While demand was slower as a result of the pandemic, construction activity was deterred to a lesser extent. Nearly 56 msf of space was completed in the quarter, up 7% from a year ago and down only 8% from the first quarter. For the most part, construction bans were lifted in mid-April and early May in many cities, allowing projects to move to fruition.
Regionally, not surprisingly, markets in states that were early to open up reported some of the largest demand in the quarter, on a square foot and absorption rate basis. Atlanta, Dallas, Phoenix, San Antonio, Orlando and Tampa were all among the top 15 markets in terms of demand. Markets with significant COVID concerns early in the pandemic reported weaker demand, including Chicago, Long Island, Los Angeles, Orange County, San Jose and Seattle.
Going forward, we continue to watch ongoing changes in demand, sparked by the COVID-19 crisis. Continued growth in e-commerce is supporting demand from large users like Amazon, Walmart and Target. E-marketer projects online sales growth will total 18% for the year, while the e-commerce’s share of total retail sales increases 350 bps to 14.5%. Beyond 2020, we anticipate increased demand from a build up of larger inventories. Disruptions in trade and stockpiling by consumers due to the pandemic have created shortages of food, appliances, furniture, building materials, apparel and automotive stocks, revealing the shortcomings of just-in-time inventory management. Finally, we anticipate continued growth in demand for cold storage, driven by growth in food production and consumption — whether it is from in-store purchase, e-grocery or restaurant-related demand. Strong demand and limited existing supply create a landlord/owner favorable market; Green Street’s risk-adjusted private market expected return for the cold storage sector over the 2020-2024 period is projected to be 6.4%, outpacing the core property types: industrial (6.1%), strip center (5.7%), apartments (5.7%), malls (5.7%) and office (4.9%).
TOP-10 RECENT LESSEES(since Mid-March)
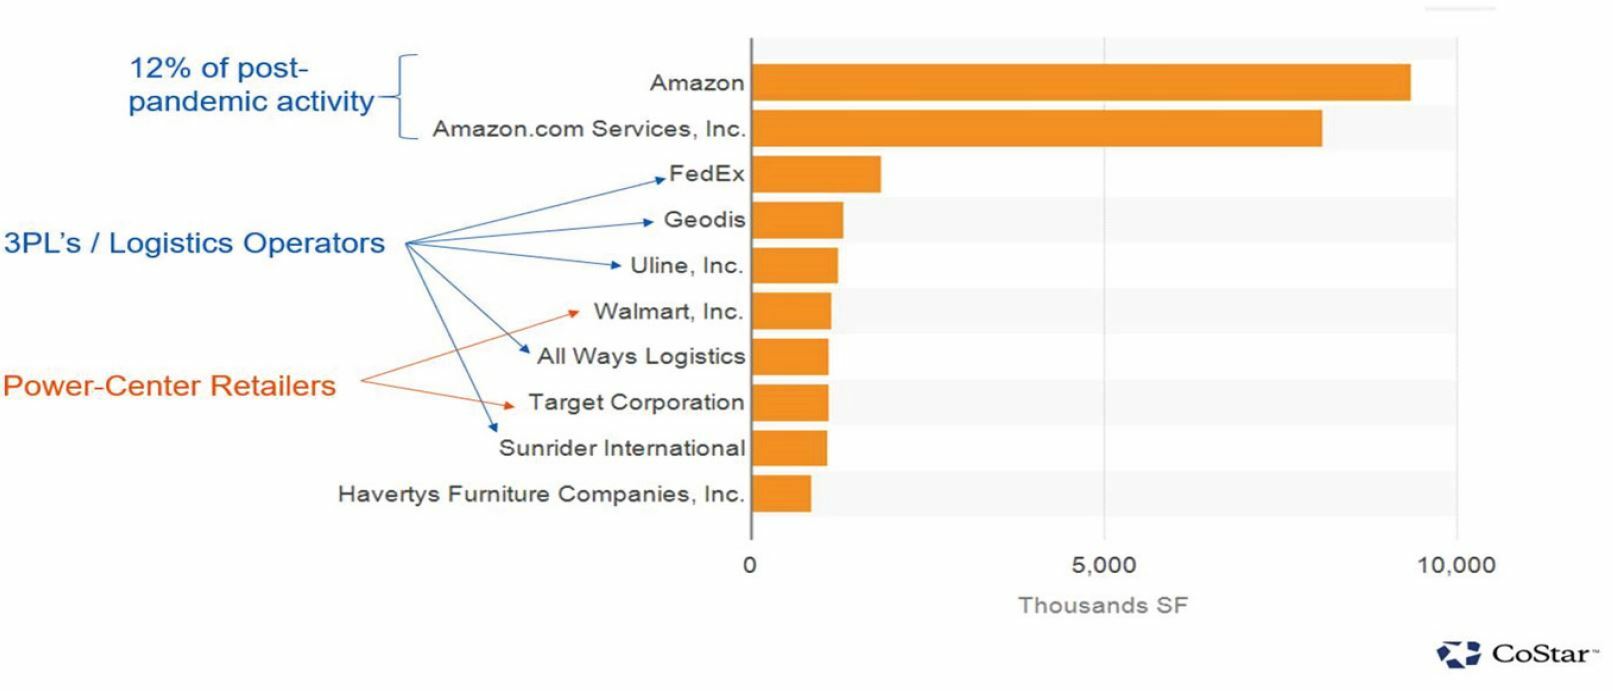
Source: CBRE-EA
Retail
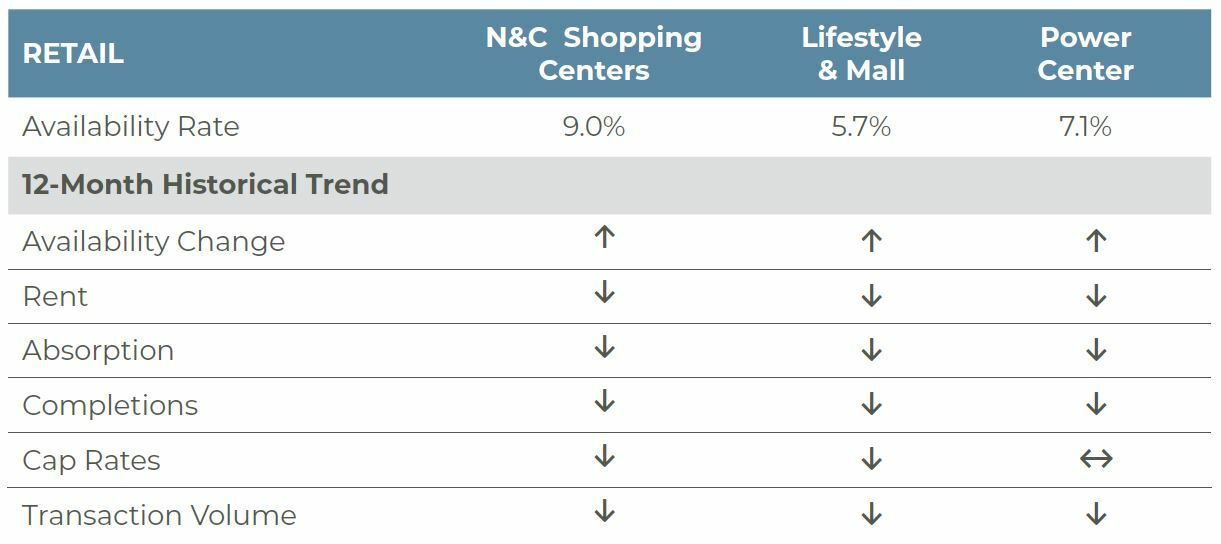
The retail sector is feeling the brunt of the COVID-19 induced economic shutdown and subsequent downturn. Availability increased across all retail segments in the quarter with negative net absorption being reported across all property types. Per CBRE-EA, total retail availability stood at 6.4% in the second quarter of the year, up 30 basis points (bps) from the previous quarter and 20 bps from a year earlier. Roughly 14.6 million square feet (msf) of space was returned to the market while only 4.8 msf was completed in the quarter. Notably, while the sector has been challenged over the last several years, due to competition from e-commerce and weak income demographics, the quarterly downturn in demand is the first since early 2011, ending a 36 quarter streak of positive net absorption.
The three major retail segments tracked by CBRE-EA — neighborhood and community shopping centers (NCSC), lifestyle and mall (L&M) and power centers (PC) — all reported rising availability and weak demand. By property subtype, NCSC availability increased to 9.0%, up 30 bps from Q2 and 40 bps year over year. Roughly 10.2 msf of space was returned to the market in Q2 while 10.4 msf of space was returned to the market year to date. The PC segment of the market reported negative net absorption of 1.6 msf in the quarter and negative 1.5 msf year to date, pushing availability up to 7.1%, an increase of 20 bps quarter over quarter and 10 bps year over year. Finally, the L&M segment was most challenged with availability increasing to 5.7%, a 40-bps increase year over year, the largest uptick among the property subtypes. Roughly 2.3 msf was returned to the market in the quarter and 1.7 msf year to date. As we move into the second half of the year, all retail segments will likely reflect more impacts from COVID-19; however, the malls are apt to be impacted to a greater degree relative to their open-air counterparts. In addition to some consumers shying away from more confined spaces like malls, COVID-19 spikes have forced an about-face on reopening in some states — in California, in particular, Governor Newsom required malls in 30 of California’s 58 counties to close once again. Further, the NCSC segment is often tenanted by necessities like grocery stores and pharmacies, while the PC segment of the market is best able to social distance given their large boxes, providing some insulation against challenges related to COVID-19. That said, small inline tenants across all segments will remain under pressure, particularly high-touch tenants like restaurants, hair and nail salons, given capacity limits and distancing requirements.
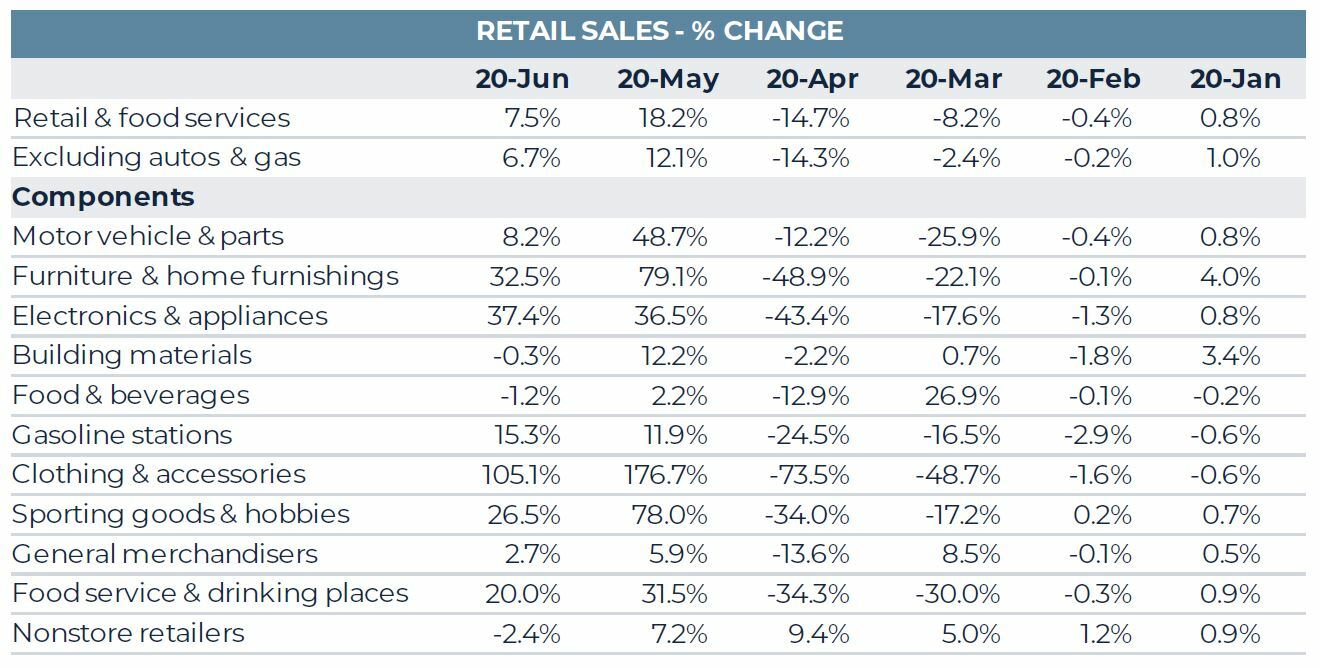
While property markets are exhibiting some weakness, retail sales are recovering and exceeding expectations. Total retail sales, excluding autos and gas, grew 12.1% and 6.7% in May and June, respectively. Apparel, furniture, sporting goods and hobby stores, restaurants, and department stores all reported strong growth in the two-month period. While this is welcome news, part of the strength in sales has been the result of the income support provided by the federal government in the form of additional unemployment benefits. These benefits, however, will expire at the end of July and future sales could be weaker as a result. Further, the continued growth in e-commerce remains a threat to brick and mortar retail and the COVID-19 pandemic has likely accelerated the acceptance of online shopping and has prompted greater growth in the space. Indeed, per a study from Adobe, e-commerce growth hit $82.5 billion in May, a 77% increase year over year. Pre-COVID, based on trends from previous years, it would have taken four to six years for sales to hit the total reported in May. Finally, per Adobe, there are signs that the online purchasing trends established during the pandemic may be permanent.
Going forward, the near-term health of the retail property sector will largely be determined by the virus. Increasing infection rates through much of the country likely spells trouble for near-term retail property market and operating fundamentals. However, there are promising developments with respect to a vaccine being ready by 2021Q1. Although, the actual production and dissemination of the vaccine may take more time, the introduction of a vaccine should boost consumer confidence and allow for greater in-person shopping and experiential retail visits, which in turn, should help spur the start of a recovery in the property sector.
RETAIL E-COMMERCE SALES IN THE US
(billions, % change and % of total Retail Sales)
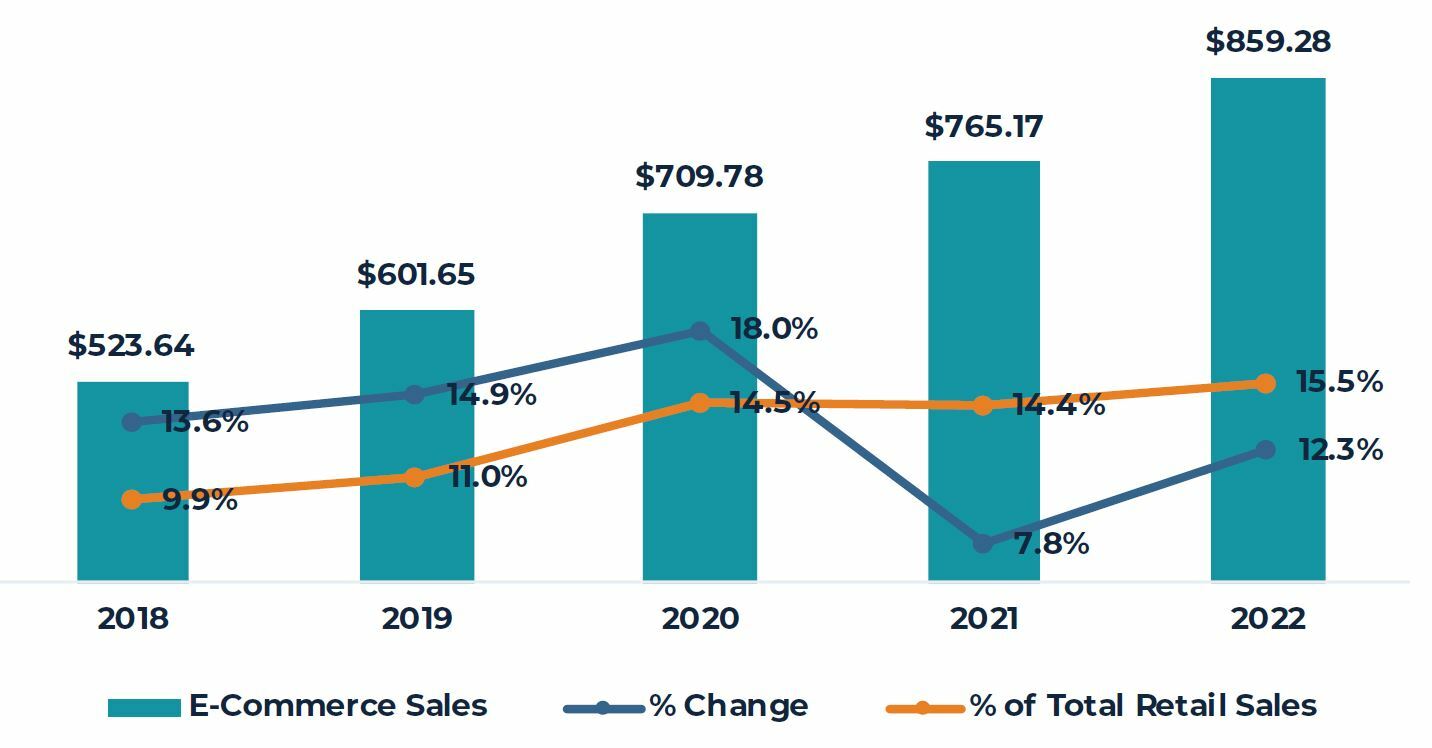 Source: eMarketer.com
Source: Moody’s Analytics
Capital Markets
Transaction activity came to a screeching halt in the second quarter of 2020 as the broad shutdown of the U.S. economy was in full effect. Only $44.7 billion in property changed hands in the quarter, the lowest quarterly total since mid-2009 and only one-third the average second-quarter volume over the previous five years. Overall, volume was down 62% year over year. Not surprisingly, the hotel and seniors housing sectors showed the largest decline in transaction volume. Hotels were obviously impacted by stay-at-home orders and a lack of travel, which lead to a collapse in fundamentals; meanwhile, seniors housing fundamentals held up reasonably well but a shutdown of visitation prohibited tours for prospective buyers. Hotel volumes plunged 85% year over year, while seniors housing transactions were down 70%. Office, retail and apartment transactions declined by 62% to 65%; the industrial sector was the better performing sector with sales down 53% year over year.
While transaction volume was weak, pricing held up reasonably, likely due to the fact that trades completed in the quarter were probably already in process prior to the shutdown. Overall, the RCA Commercial Property Price Index (CPPI) for all property types was flat on a quarter-over-quarter basis but increased 3.6% year over year. The industrial sector reported the greatest year-over-year increase in price, climbing 7.6%; apartment followed with a 7.1% gain, while office reported a more modest 2.3% increase. Retail and hotels reported a 0.7% and 5.4% year-over-year decline in repeat sales price, respectively. By market segment, non-major market pricing growth slightly outpaced the six major markets (Boston, Chicago, Los Angeles, New York, San Francisco and Washington, DC) with non-major market prices increasing 3.9% year over year, besting the major market growth of 3.2%. On a quarter-over-quarter basis, however, the opposite was true with the major markets recording price appreciation of 0.5% versus 0.3% for the non-major market index.
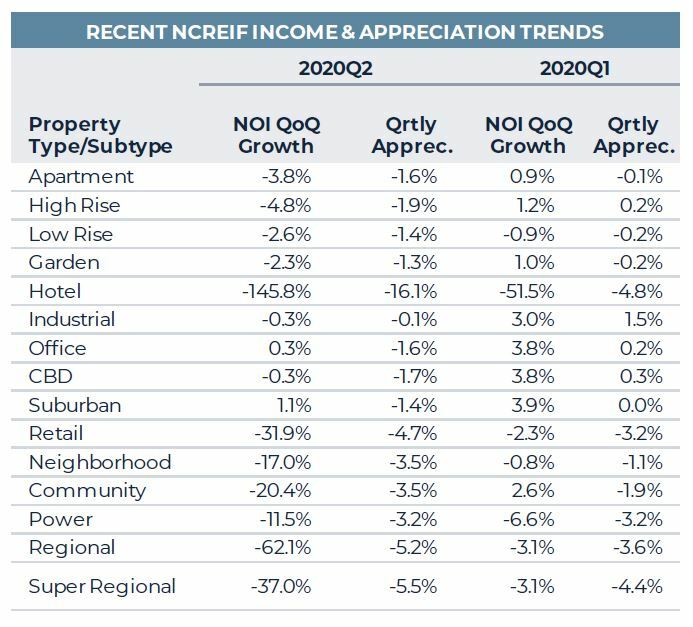
Per NCREIF, the widespread shutdown of the U.S. economy produced a significant impact on operating fundamentals in the second quarter of 2020; particularly for the hotel and retail sectors. Hotel NOI declined by 149%, quarter over quarter, and this followed a decline of over 50% in the previous quarter. Meanwhile, NOI for super-regional and regional malls declined by 37% and 62%, respectively; while power, neighborhood and community centers reported a more moderate downturn of roughly 12%, 17% and 20%, respectively. Apartment, office and industrial reported fairly modest declines in NOI to date with quarter-over-quarter declines of 0.3%, 0.3% and 3.8%, respectively. Of note, within the apartment market, high rise (-4.8%) took a more substantial hit to NOI compared to low rise (-2.6%) and garden properties (-2.3%). This is not surprising, as high-rise properties have been more pressured by new supply and have seen greater impacts from the virus due to their density. Likewise, CBD office NOIs (-0.3%) drove the office NOI decline as suburban NOIs increased 1.1%.
With respect to appreciation, trends were similar with declines being more pronounced in the hotel, retail, high-rise apartment and CBD office sectors. Hotels depreciated 16.1% in the quarter, while retail center values declined by 4.7%, again driven by the regional (-5.2%) and super regional mall (-5.5%) subsectors. Within the apartment sector, all segments showed modest depreciation with high rise (-1.9%) leading the way, followed by low-rise (-1.4%) and garden (-1.3%) properties. CBD and suburban office values declined by 1.7% and 1.4%, respectively, while, not surprisingly, industrial values were essentially flat.
Going forward, we believe cap rates will remain relatively stable or even edge down slightly, particularly for the industrial and apartment sectors. The BBB corporate bond spread to treasuries has come in significantly and without upward pressure from the BBB market and plenty of capital on the sidelines waiting to invest, it is unlikely cap rates will move upward. Further, returns for property will remain competitive with other asset classes. Per PREA, the total NPI return is expected to average 4.7% over the 2020 to 2024 period with industrial (7.0% return) and apartments (5.4%) outperforming relative to office (4.2%) and retail (1.9%).
RCA QUARTERLY TRANSACTION VOLUME
(Billions)
Source: Real Capital Analytics
Source: NCREIF
The information and opinions presented in this research piece have been prepared internally and/or obtained from sources which AEW believes to be reliable; however, AEW does not guarantee the accuracy, adequacy, or completeness of such information.