The Great American Re-Opening?
Despite widespread availability, distribution of the COVID-19 vaccines has slowed significantly in recent weeks as tens of millions of Americans decline to participate in the rollout. As a result, a fourth wave of accelerating infections, largely among the unvaccinated, has begun as various mask and distancing mandates have been broadly relaxed or removed. At this time, there appears to be limited political appetite to reimpose restrictions or mandates in most areas of the country, particularly in those places that experienced less severe outbreaks previously. These areas are, however, the same places where individuals are less likely to have been vaccinated or be willing to be vaccinated and are thus experiencing the most significant increases in new infection and, in some cases, hospitalizations.
Against this backdrop, the U.S. economy, propelled by significant fiscal stimulus, continues its return to pre-pandemic levels of economic activity. Preliminary second-quarter data show real GDP increasing at an annual rate of 6.5% following first quarter’s reading of 6.3% and is now above prior peak. In short, the sharpest and shortest recession in U.S. economic history is over. We expect GDP growth to remain elevated during the second half of this year, averaging 6%-7% for the year as a whole and then slowing to more sustainable levels, averaging approximately 2.5% per year over the next several years. The degree of upside and downside risk to this outlook will largely be related to scale and scope of the both the bi-partisan and reconciliation infrastructure packages currently working their way through Congress.
FIGURE 1
YEAR-OVER-YEAR GROWTH IN U.S. REAL GDP
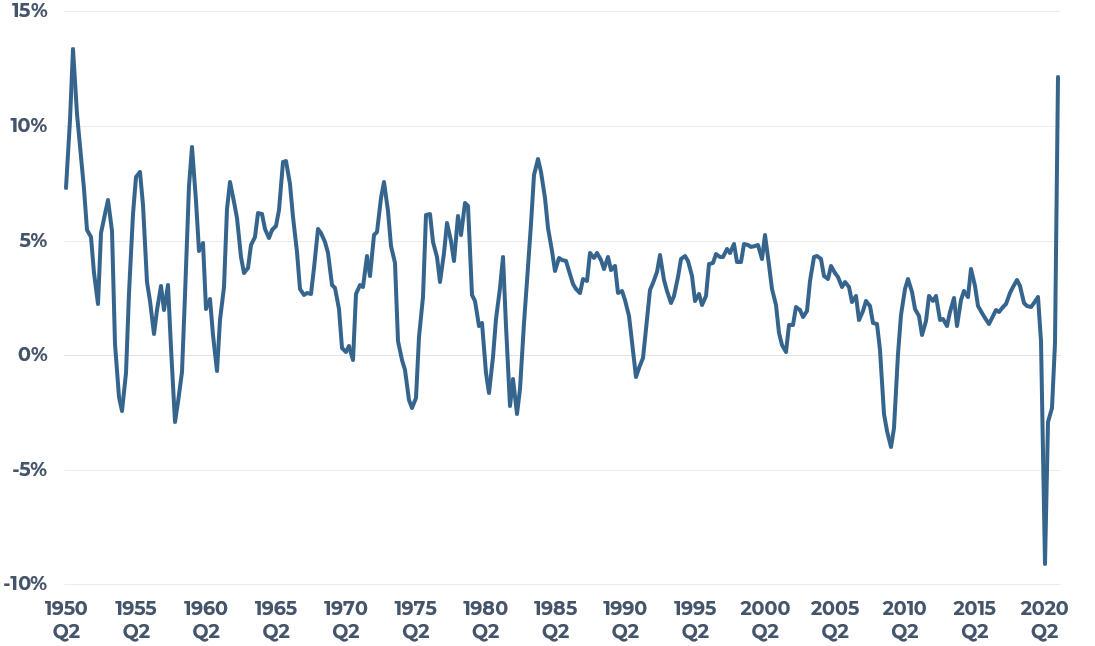
Source: Bureau of Economic Analysis
While the worst of the pandemic-induced recession may be over, significant displacements remain in many parts of the U.S. economy. Most notably, the number of unemployed remains nearly four million above the pre-pandemic low of February 2020. At the same time, the number of open positions employers are attempting to fill has surged to an all-time high of 9.2 million, more than two million greater than the February 2020 level. This mismatch between workers and employers has manifested in localized labor shortages, particularly in low-wage and public-facing service sector jobs such as food service and hospitality.
Geographically, areas that experienced more significant COVID-19 outbreaks and, consequently, more extensive shutdowns such as New York and San Francisco remain further behind in full re-opening relative to areas that experienced less-severe outbreaks and restrictions such as markets in Florida and Texas. Areas with significant daytime commuter populations, particularly those markets with a high degree of jobs that lend themselves well to remote working (e.g. many high-tech positions), are also lagging in the return to normal levels of economic activity as their daytime office workers lag in the return to the office. A recent study by Moody’s Analytics suggests that the daytime worker population in some metropolitan areas may remain 10%-15% below pre-pandemic norms on some days depending on the degree and pattern of remote work adoption.1
1 https://economy.com/economicvi...
FIGURE 2
NUMBER OF UNEMPLOYED AND OPEN POSITIONS (000s) 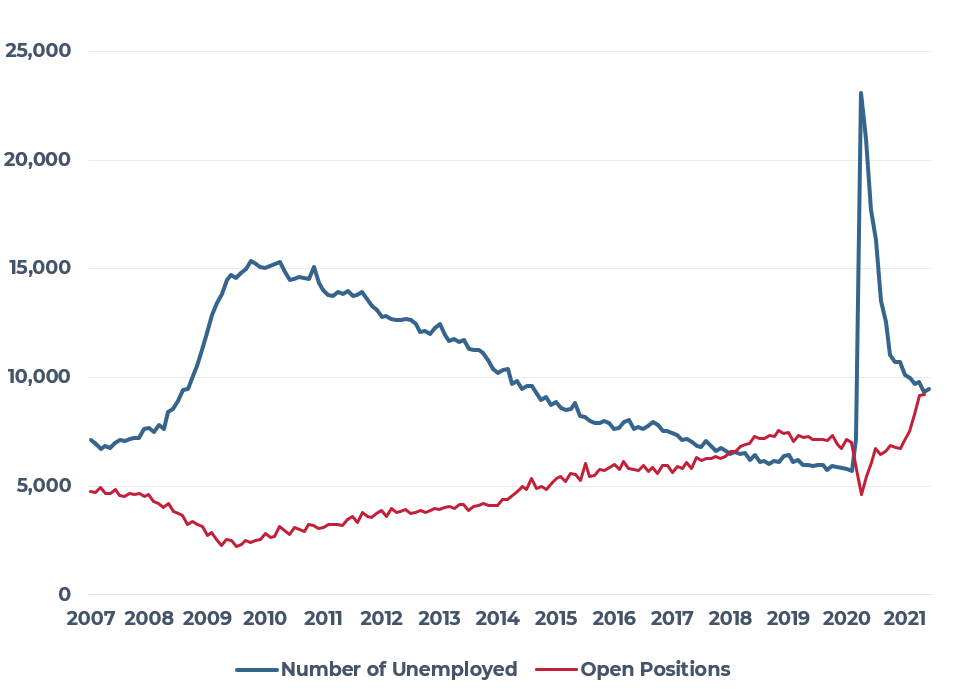
Source: Bureau of Labor Statistics
Consistent with the dislocated job market, concerns over labor availability and costs continue to rise. The second-quarter employment cost index data shows overall labor costs increasing more than 3.5% year-over-year, the fastest rate of increase since the financial crisis more than ten years ago. Similarly, recent inflation reports show evidence of outsized price inflation.
So far, the bond market has largely ignored inflation concerns with yields on Treasury bonds falling by 50-60 basis points since reaching a pandemic high of 1.75% at the end of March. Similarly, the forward curve for Treasury yields in the future has also retreated from an expectation of more than 2.5% during the spring of this year to less than 2% today. At the time, data from the inflation indexed Treasury market suggest that investors expect inflation to average close to 2.5% per year over the next five years, consistent with current guidance from the Federal Reserve.
Current data from the Federal Reserve Bank of Dallas supports the current bond market pricing. Figure 3 shows the year-over-year increase in the core (i.e. net of food and energy) consumer price index (CPI) and the trimmed means personal consumption expenditure deflator. As the name suggests, the trimmed means measure looks at all items that are included in calculating inflation and excludes the extreme observations, both positive and negative. In this sense, the trimmed means measure is attempting to find the central tendency in prices. At this time, this measure supports the expectation that the higher inflation shown in the core CPI will be transitory, not long lasting.
FIGURE 3
CORE CPI AND THE TRIMMED MEAN PERSONAL CONSUMPTION EXPENDITURE
(YEAR-OVER-YEAR PERCENT CHANGE)
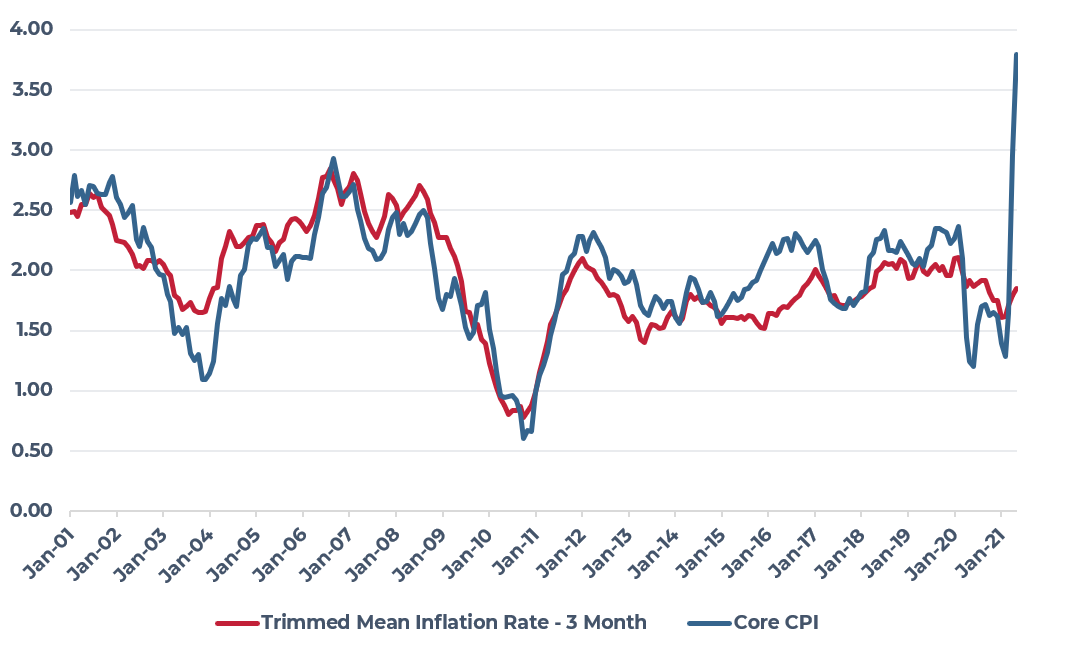
Source: Federal Reserve
U.S. Commercial Property
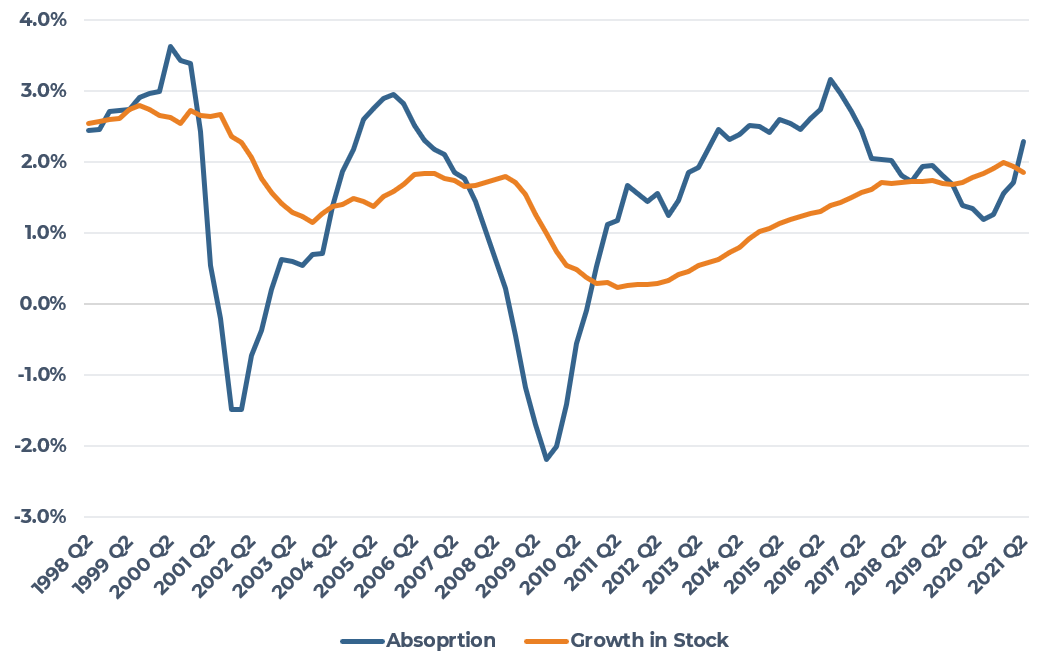
Like the rapid re-opening of the U.S. economy, the nation’s commercial property markets are also rebounding faster than in prior recovery periods, but this remains highly variable by property type and geography. In contrast to the last two economic contractions, aggregate apartment absorption slowed, but did not turn negative over the past year and has rebounded sharply to a second-quarter year-over-year growth rate of nearly 2.5%. At the time, supply growth has remained near constant at less than 2%. Indeed, absorption has largely held above new supply growth for most of the past decade resulting in downward pressure on vacancy rates and upward pressure on rents across most markets and product segments.
FIGURE 4
APARTMENT ABSORPTION AND GROWTH IN STOCK
(YEAR-OVER-YEAR PERCENT CHANGE IN TOTAL AND OCCUPIED STOCK)
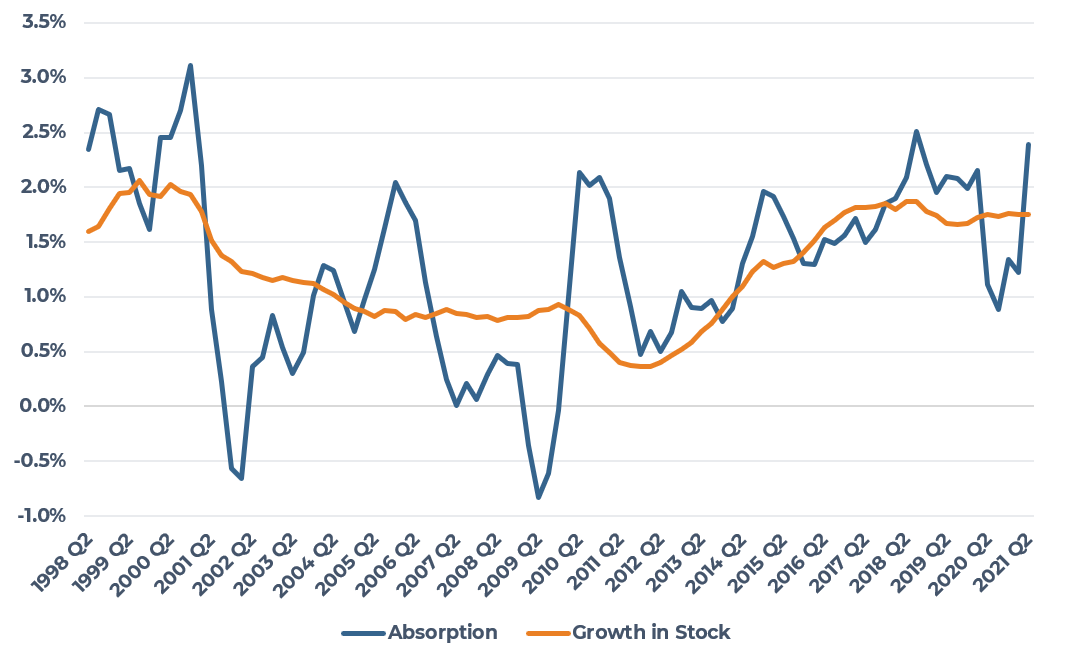
Source: CBRE-EA 2021 Q2
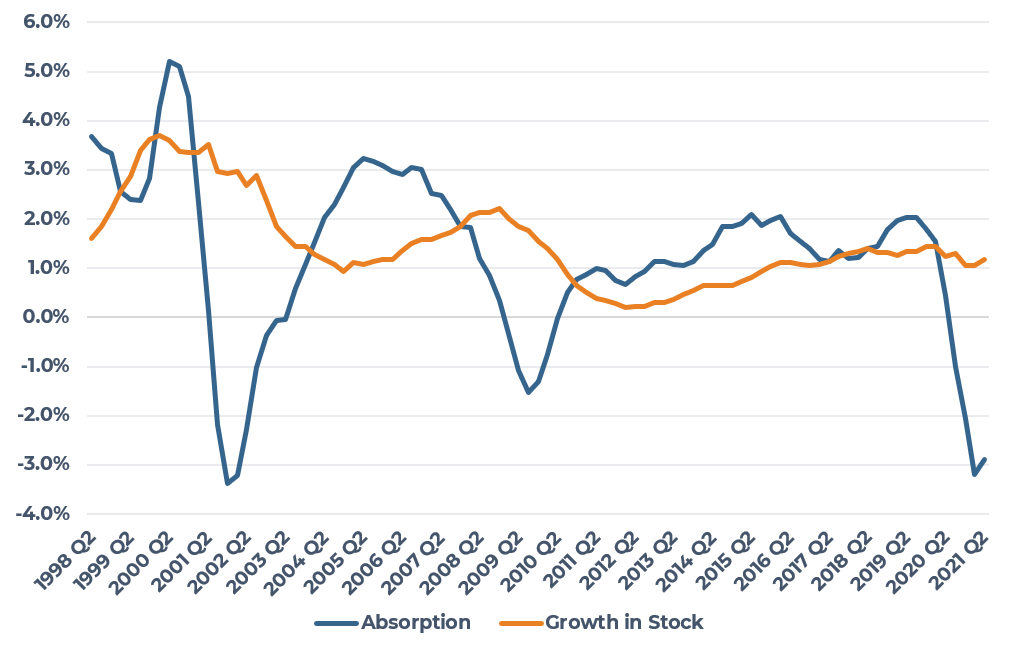
Similarly, industrial property demand growth dipped only slightly over the past year as the economy-wide substitution of logistics space for in-person retail space largely offset any negative demand effects from the short, but severe contraction in the broader economy. Indeed, some aspects of this transition, which had been underway for some time, was accelerated by the pandemic and the related changes in what American businesses and consumers required and where/how they accessed it. As with apartments, industrial demand growth largely outstripped supply growth over most of the past decade leading to declining availability rates and outsized rental rate increases.
FIGURE 5
INDUSTRIAL ABSORPTION AND GROWTH IN STOCK
(YEAR-OVER-YEAR PERCENT CHANGE IN TOTAL AND OCCUPIED STOCK)
Source: CBRE-EA, 2021 Q2
In contrast to apartment and industrial properties, office property absorption turned sharply negative over the pandemic year as office-using employment largely went remote. While it is still too early to tell what will ultimately happen to office tenants’ physical footprints, the near-term expectation is for weaker office space demand in aggregate but possibly stronger demand for specific office properties and submarkets. This should put broad near-term downward pressure on most rents. Also, in contrast to prior economic downturns, the expected supply of new office space is not elevated, with the growth in total stock averaging roughly 1% per year over the past several years. At this point, accelerated obsolescence of commodity office stock as well as newly emerging non-office work options pioneered during the pandemic are of greater concern.
FIGURE 6
OFFICE ABSORPTION AND GROWTH IN STOCK
(YEAR-OVER-YEAR PERCENT CHANGE IN TOTAL AND OCCUPIED STOCK)
Source: CBRE-EA, 2021 Q2
For its part, retail property remains largely out of favor with most investors as visibility into the full degree of dislocation comes into focus. Various real-time data such as mobile phone location data does show broad recovery with foot traffic, and in some cases, sales levels returning to pre-pandemic levels. In contrast to the period immediately following the financial crisis, most consumers today are coming out of the pandemic in a better financial position, often with significant accumulated savings. We expect this will contribute to elevated levels of consumption over the rest of the year and into 2022, but a continuation beyond that will largely depend on the strength and direction of the broader economy.
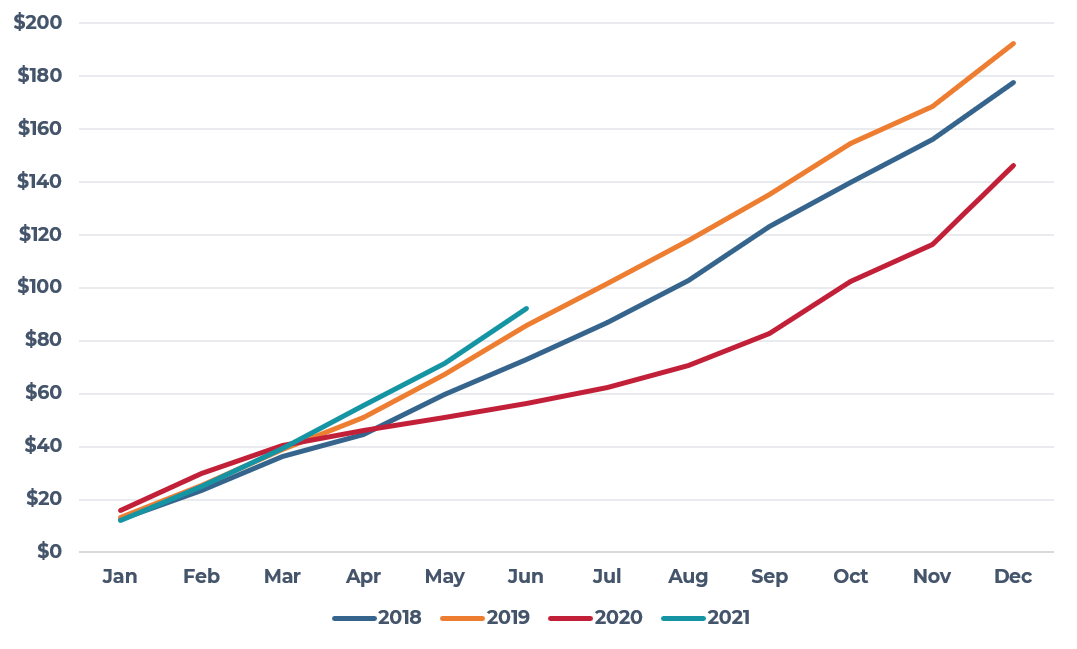
Given the differences in underlying supply and demand fundamentals, it is not surprising that the commercial property transaction market is quickly moving back to pre-pandemic activity levels, driven largely by accelerated transaction levels in the industrial and multifamily property markets. Figure 8 illustrates the month-by-month aggregate transaction volume pacing for the past several years and 2021 is directly on pace with 2018 and 2019. We expect this pacing to accelerate during the second half of the year as investors continue to both increase their target allocations to real assets broadly and commercial property specifically. Additionally, ever-rising equity market valuations are creating a positive denominator effect for many investors with the total portfolio growing rapidly. In the near-term, the increasing weight of capital combined with concentrated investor interest in fewer market segments and continued low expected Treasury yields should result in robust property pricing and additional yield compression, at least in the high-demand segments of the market.
FIGURE 7
COMMERCIAL PROPERTY TRANSACTION VOLUME PACING BY YEAR
(BILLIONS)
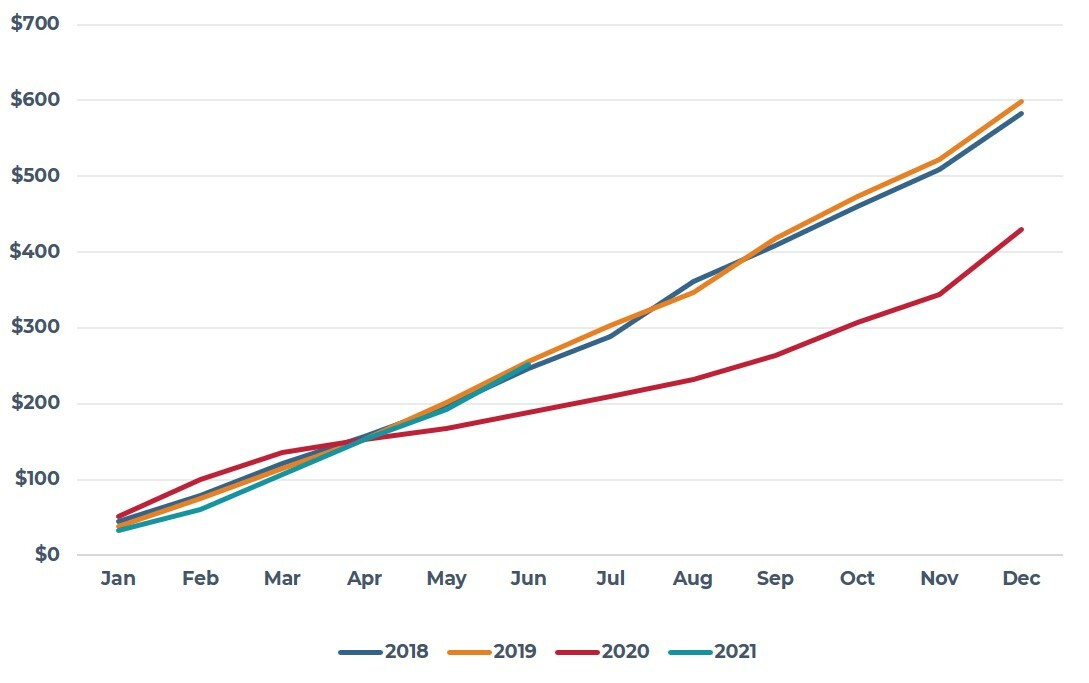
Source: RCA 2021 Q2
FIGURE 8
INDUSTRIAL PROPERTY TRANSACTION VOLUME PACING BY YEAR (BILLIONS)
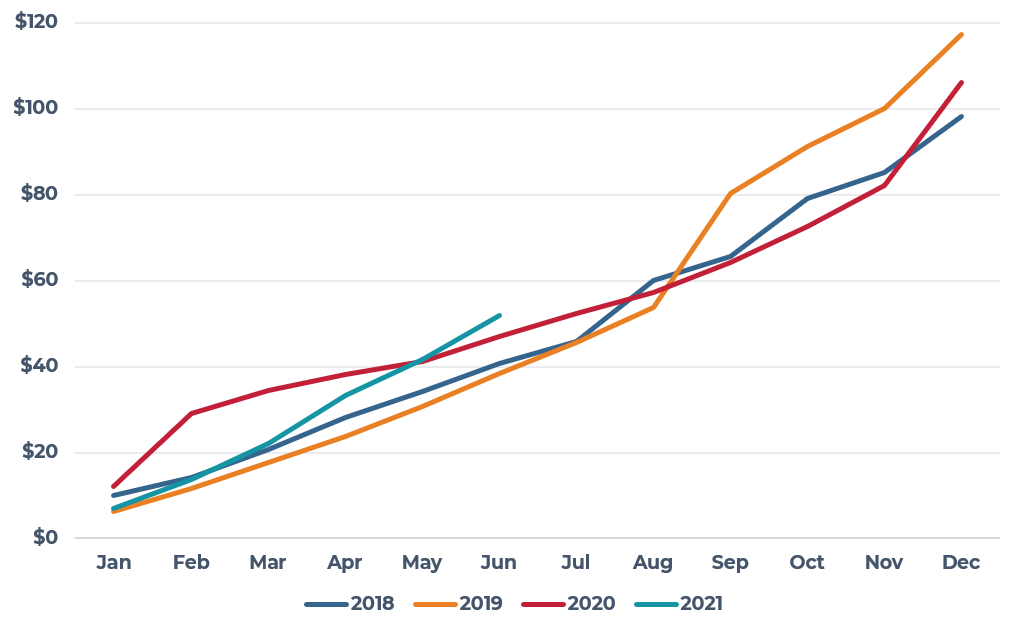
Source: RCA 2021 Q2
FIGURE 9
APARTMENT PROPERTY TRANSACTION VOLUME PACING BY YEAR (BILLIONS)
Source: RCA 2021 Q2
Office
The U.S. office market is facing continued uncertainty as it adjusts to the effects of a year of remote work and a tentative re-entry into a post-pandemic world. Per CBRE-EA, office vacancies continued to edge upward in the second quarter of 2021, increasing to 16.5%; this is an increase of 50 basis points (bps) from the prior quarter and 350 bps year-over-year (YOY). Vacancies are now only 30 bps below their peak of 16.8% in 2010Q2 during the Great Financial Crisis and are only 50 bps below the Tech Crash cyclical high of 17.0% in 2003Q2. The total availability rate is even higher, reaching 22.7%, the highest availability rate in the U.S. office market’s history (tracked since 2000Q1). In terms of national trends for office space availability, there has been an increase in vacant and sublet space across the office sector. In the second quarter of 2021, the total vacant (660.9 msf), sublet vacant (79.1 msf) and total available (910.6 msf) space have all reached record highs. Sublet space, in particular, has nearly doubled since 2020Q1, but still only represents just 2.0% of total office inventory. Overall, the spread between the vacancy and availability rates has widened, reaching a record 620 bps as of the second quarter of 2021 suggesting office tenants are taking a more cautious approach to leasing influenced by the evolving return-to-work dynamics.
This upward trend in office vacancies varies across markets. Of the 64 markets tracked by CBRE-EA, 60 markets have seen an increase in vacancies YOY. Additionally, 37 markets now have vacancy rates equal to or above 15.0% and nearly all (61 markets) have vacancy rates equal to or above 10.0%. Dense markets like Houston (25.4%); Dallas (23.2%); Denver (18.6%); Atlanta (18.5%); and Chicago (18.4%) are seeing some of the highest vacancy rates. Most of the tech-centered markets saw increases in vacancies YOY, with San Francisco (720 bps); Austin (690 bps); Seattle (600 bps); and Manhattan (470 bps) seeing some of the largest increases. Some markets saw decreases on the quarter, such as Nashville (-140 bps); Fort Worth (-70 bps); Memphis (-70 bps); and Boston (-50 bps).
While the U.S. office market has been challenged by the disruption of the COVID-19 pandemic, several office-using sectors are seeing positive job growth and are on the road to recovery. Indeed, many of the office-using sectors have seen large gains in employment since their 2020 trough, with the professional & business services sector seeing payrolls up 6.5% (1.3 million jobs) YOY as of June 2021. Similarly, the information sector is up 5.1% (134,000 jobs) and financial activities payrolls are up 1.9% (166,000 jobs) YOY.
The correlation between employment and office space demand is clearly shifting in real time as many employers integrate some form of a hybrid (remote/in-person) work model, but the longer-term dynamics remain in question. The share of employees working from home due to the pandemic has been decreasing through the year, particularly at the beginning of summer 2021. Per the Bureau of Labor Statistics, the percentage of total employees working from home in June 2021 is down by more than half from its peak in May 2020. The rate of all workers continuing to work from home, at least part of the time, due to the pandemic as of June 2021 is 14.4%, significantly down from the 35.4% reported in May 2020. Kastle System’s Back-to-Work Barometer offers additional nuance, affirming that while steps are being taken towards returning to work, it will be a tentative process. Based on office access swipes, weekly occupancy rates vary widely across metros, with San Francisco (21.2%) and San Jose (23.6%) at the lower end and Houston (51.6%) and Austin (53.5%) at the higher end of the spectrum, as of July 21, 2021.
Overall, AEW Research affirms the belief that many firms will still embrace a hybrid work environment, but there is some hesitancy given recent COVID trends. In 2021Q2, there was a national downward trend in positive cases, hospitalizations and deaths from COVID, which supported a return to the office. However, the Delta variant may present some future concerns regarding the ongoing drawdown of the pandemic, as rising transmission rates have prompted cities such as Los Angeles to reinstate their indoor mask mandates. Employees may once again be apprehensive to commute into work if the rising case counts continue. Although, the second quarter of 2021 did see a strong return to the office, which is positive for the office outlook and supports the idea that when it is safe to return to the office, workers and companies will do so.
While there is a lot of uncertainty in the office sector, on the positive side, some metrics show signs of office demand returning in the long term. Per CoStar, leasing activity was the highest it has been since the onset of the COVID pandemic, reaching 75.0 million square feet (msf) in 2021Q2, up 26.4% from the 59.4 msf of leasing seen the previous quarter. Some of the largest leases signed this quarter were by tech firms like Apple and Hulu, as well as several life sciences companies. In aggregate, companies are evaluating their respective value propositions with respect to employees being in the office, working remotely or a hybrid model while taking into account the concerns and preferences of employees. This will likely translate into a flight-to-quality that often shows up at this point in the cycle but will expand to incorporate health and safety attributes at the expense of older commodity office space.
FIGURE 10
U.S. OFFICE VACANCY AND AVAILABILITY RATES SPREAD
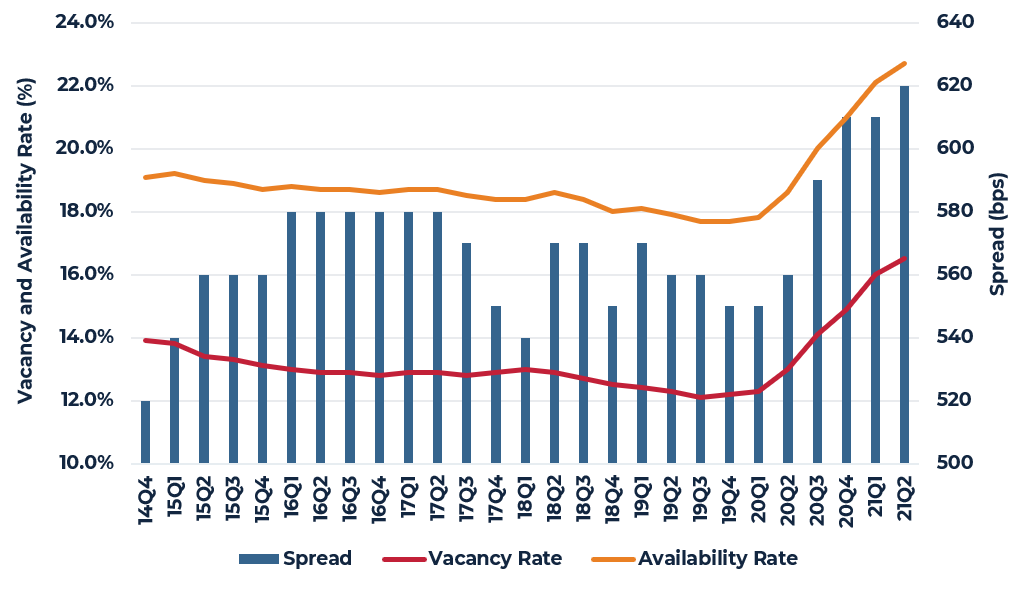
Source: CBRE-EA
FIGURE 11
EMPLOYED PERSONS WHO WFH IN THE LAST 4 WEEKS DUE TO THE PANDEMIC
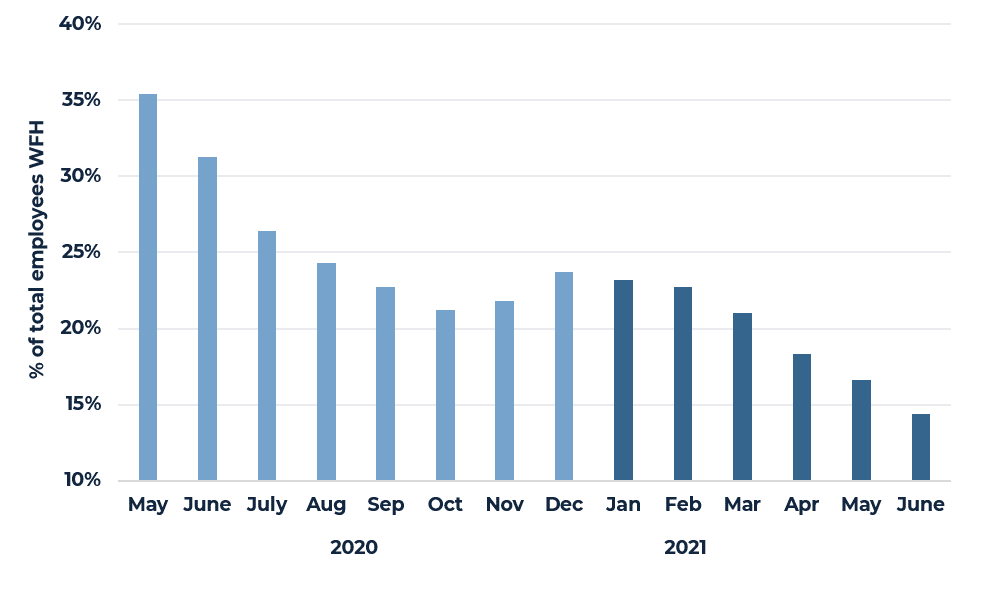 Source: BLS, AEW Research

Source: CBRE-EA
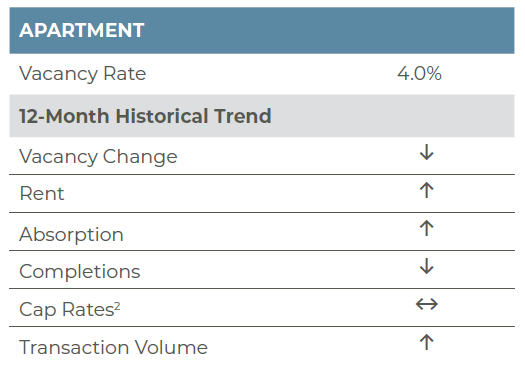
Apartment
A strong V-shaped recovery is underway in the apartment sector. According to preliminary data from CBRE-EA, the national apartment market vacancy rate declined to 4.0% in 2021Q2, down 70 basis points (bps) from the previous quarter, 50 bps year-to -date, and 60 bps year-over-year. Further, vacancies are 30 bps below the pre-COVID 2020Q1 level. Nearly 180,000 apartment units were absorbed on net in the second quarter, the largest quarterly net absorption ever reported by CBRE-EA and outpacing the second-largest quarter (2019Q2) by over 6%. Development activity continued but at a more subdued pace relative to 2020. Roughly 66,000 units were completed in 2021Q2, down from average quarterly deliveries of 72,000 units in 2020 but up from the 52,000 units delivered in 2021Q1. On a rolling-four quarter basis, completions have totaled 1.7% of stock, again down from the 1.8% quarterly average in 2020 and the five-year historical average of 1.8%. The four-quarter absorption rate of 2.2% was more than double the COVID low of 0.9%. The improvement in fundamentals is translating into robust rent growth; indeed, over the previous six months, rents have increased 3.8% and are now less than 1.0% below their pre-COVID level and only 1.2% below the 2019Q3 record high.
By market, smaller, less dense markets generally remain tightest. With Riverside (1.6%); Ventura (1.7%); Providence (1.8%); Norfolk (2.0%); Honolulu (2.2%); Sacramento (2.3%); Madison, WI (2.4%); Orange County (2.4%); Detroit (2.6%); and Long Island (2.6%) reporting the lowest vacancies. However, larger sunbelt and gateway markets are leading the recovery. Over the previous six months, Honolulu (2.2%, -170 bps); Salt Lake City (2.8%, -150 bps); West Palm Beach (3.2%, -140 bps); Orlando (3.8%, -130 bps); Nashville (4.5%, -120 bps); Miami (3.6%, -120 bps); Austin (5.1%, -110 bps); San Francisco (6.3%, -110 bps); Tampa (3.1%, -110 bps); Portland (3.4%, -110 bps); Chicago (4.9%, -110 bps); and Seattle (4.7%, -110 bps) have all reported improvement in vacancies of over 100 basis points.
Relative to pre-COVID conditions, only 11 markets currently have vacancies above their 2020Q1 level and only 15 have vacancies above their 2019Q4 level. Not surprisingly, the urban gateway markets hardest hit by COVID – Boston, Los Angeles, Seattle, Oakland, Washington D.C., New York, San Jose and San Francisco – are among this subset of markets. As we have noted, however, markets across the country are experiencing a rapid recovery and these markets are included in this recovery with all reporting notable vacancy declines in recent months. The improvement in vacancies in the gateway markets has been the result of record demand as supply has remained steady. Indeed, net absorption in the second quarter in Los Angeles was nearly four times the average second quarter demand from 2014-2019 while Houston and Miami reported demand 2.5 times average levels. Demand was also exceptionally strong in Dallas, Chicago, Austin, Oakland, San Francisco and Seattle, ranging from 1.5 times to 1.8 times average Q2 levels.
Going forward, the continued economic recovery and accelerating job growth should prompt greater household formation. Meanwhile, a broad lack of affordability with respect to for-sale housing and limited supply of homes for sales should yield greater increases in renter household formation. Supply growth will remain steady; however, the ongoing recovery in the apartment market is expected to continue. The nation’s urban gateway markets that were most adversely affected by COVID will subsequently see the greatest ‘pops’ in rents as concessions continue to burn off and asking rents advance to and eclipse their pre-COVID levels. While the spread of the delta COVID variant poses a risk to the outlook, the long-term prospects for the apartment market should remain favorable as the U.S. is under-supplied in housing relative to the demographic-driven demand expected.
FIGURE 12
RECORD DEMAND IS DRIVING AN IMPROVEMENT IN FUNDAMENTALS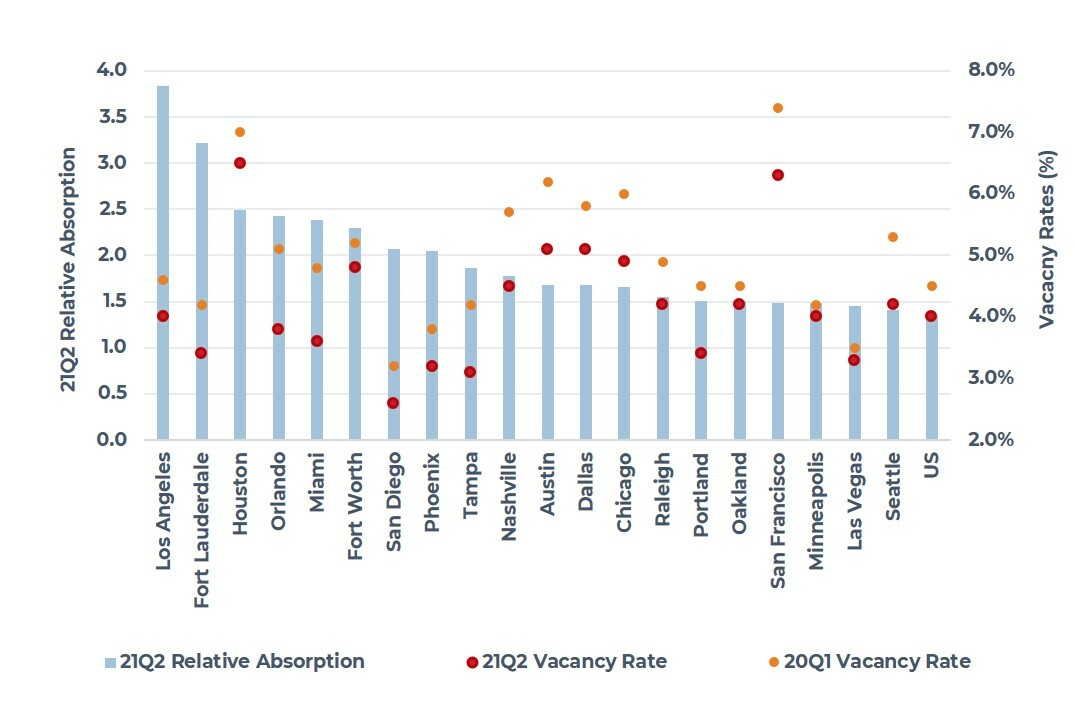
Source: CBRE-EA
Source: CBRE-EA
2 NCREIF cap rates are lower due to weaker NOI; however, Real Capital Analytics transaction cap rates are flat.
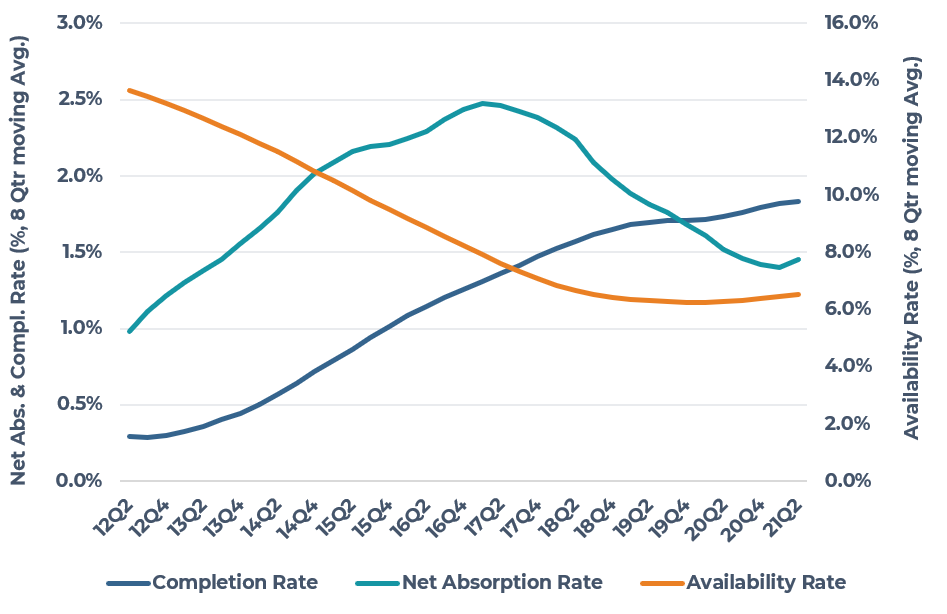
Industrial
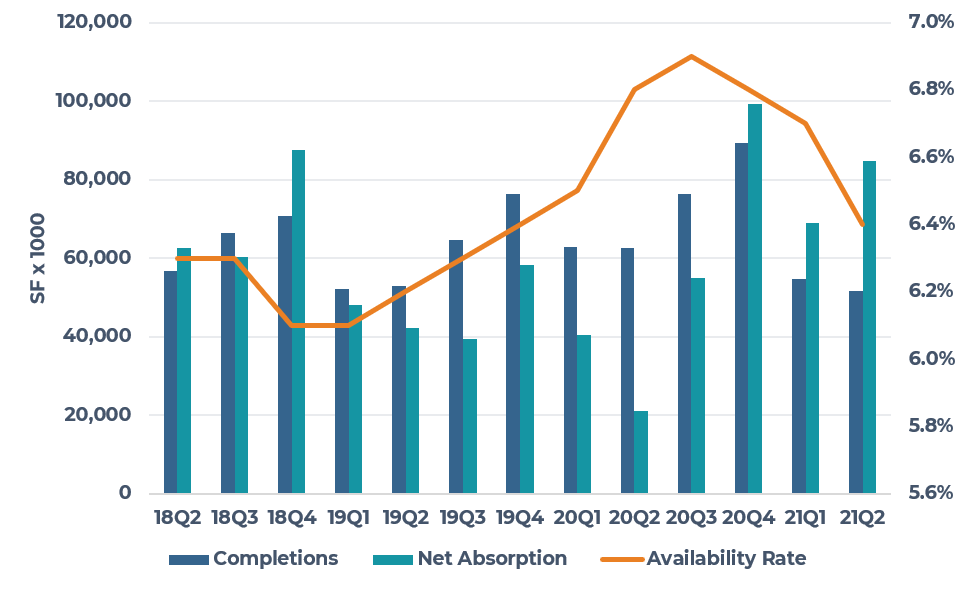
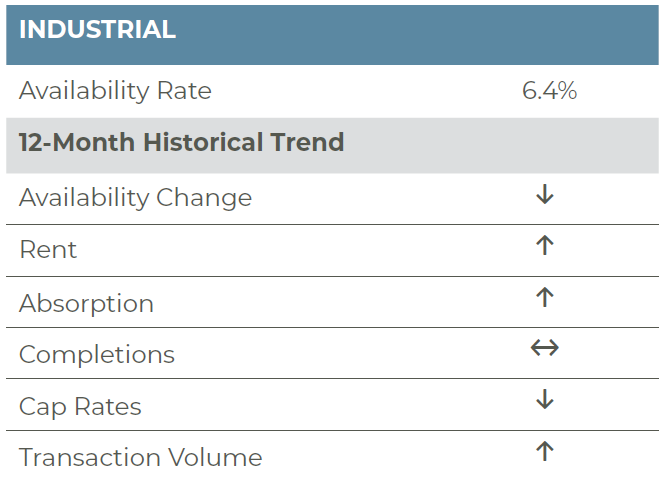
The near-term outlook for the U.S. industrial sector remains highly favorable, given the demand uptick in recent quarters as well as broader historical trends. Per CBRE-EA, the second quarter of 2021 had an availability rate of 6.4%, down 30 basis points (bps) from the prior quarter and down 40 bps year-over-year, as well as 300 bps below the historical average of 9.4%. Second-quarter net absorption totaled 87.8 million square feet (msf), surpassing completions of 51.7 msf. Demand for industrial space has increased steadily, with the last four quarters totaling 308.0 msf of net absorption, nearly double the four-quarter total (160 msf) ending in 2020Q2. So far, 2021 has reported a quarterly average of 76.9 msf of net absorption, while 2020 reported a quarterly average of 54.0 msf absorbed. On the supply side, the second quarter had the lowest share of supply delivered since 2018Q1.
The rising demand for industrial space is prevalent across markets, with 45 of the 69 markets tracked by CBRE-EA reporting a Q2 availability rate below 7.0%. Some of the tightest industrial markets are Salt Lake City (2.6%); Albuquerque (3.0%); Ventura (3.7%); Orange County (3.7%); and Los Angeles (3.9%). In terms of improving markets, 46 markets reported year-to-date (YTD) decreases in availability, with the largest decreases in Las Vegas (-250 bps); Savannah (-230 bps); and Salt Lake City (-210 bps).
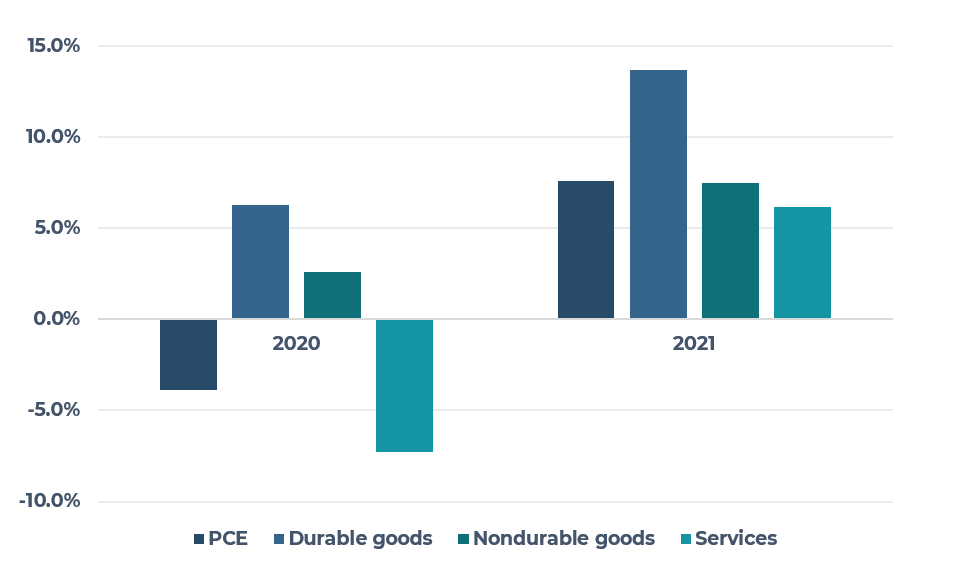
E-commerce channel growth and broader spending on goods has been a continued trend supporting the increasing demand for industrial space. During the COVID-19 pandemic, overall consumer spending took a dip, but spending on goods fared significantly better than services. Per Deloitte Insights, real personal consumption expenditures (PCE) contracted by 3.9% in 2020 but spending on durable goods was up 6.3% as consumers were unable to spend as much on in-person services and, instead, focused consumption of a variety of goods, many related to home improvement and remote work. The 2021 full-year forecast expects aggregate PCE to rise by 7.6% as spending on services is back up with experiences, restaurants, and travel becoming a reality again. Durable good spending in 2021 is forecasted to be up 13.7%, as habits like working, exercising, and cooking more often at home are likely to stick around now that consumers have adjusted to them and spending on items to equip home offices and home gyms has continued into 2021.
The increased consumer spending on goods impacts online spending. Deloitte Insights reports that 48% of consumers expect they will continue to shop online and have goods delivered more often post-pandemic than they did pre-pandemic. Per eMarketer, in 2021, U.S. consumers are expected to spend $933.3 billion through e-commerce purchases. This is an increase of 17.9% year-over-year and represents 15.3% of total retail sales. They forecast that by 2025, e-commerce sales will make up nearly a quarter (23.6%) of total retail sales, compared to the 11.0% share seen in 2019. With spending on goods booming in 2021 and e-commerce sales continuing to expand, the perspective on the industrial sector is highly favorable in the short- and long-term.
FIGURE 13
INDUSTRIAL SUPPLY AND DEMAND COMPARISON
Source: CBRE-EA
FIGURE 14
INDUSTRIAL SUPPLY AND DEMAND TRENDS
Source: CBRE-EA
FIGURE 15
CONSUMER SPENDING
Source: Deloitte, Bureau of Labor Statistics
Source: CBRE-EA
Retail
The easing of COVID-19 restrictions and reopening of the U.S. economy have begun to herald a recovery in the retail sector. Store closures and retail bankruptcies have slowed in step with the reopening of the U.S. economy. On the consumer side, federal stimulus payments to households are continuing to support retail sales. Overall, the Cares Act (Consolidated Appropriations Act and American Rescue Plan) has transferred roughly $870 billion directly to U.S. households and this does not include the additional unemployment payments to households, which have also provided an additional boost to consumer wallets. In June, retail sales rose 0.6% in total and 1.3% excluding autos. June’s top line growth was led by department stores, miscellaneous store retailers, electronics and appliance stores, apparel stores, gas stations and restaurant sales.
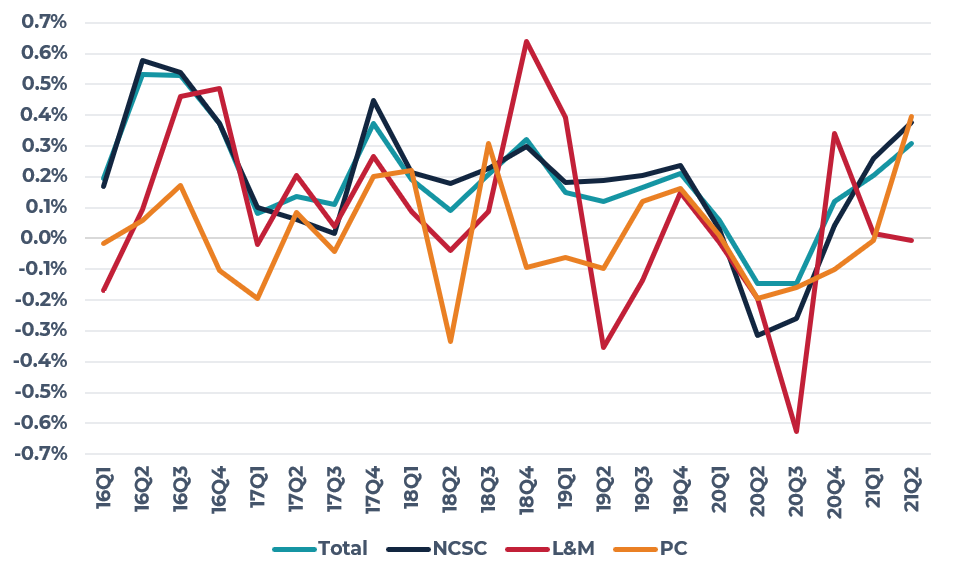
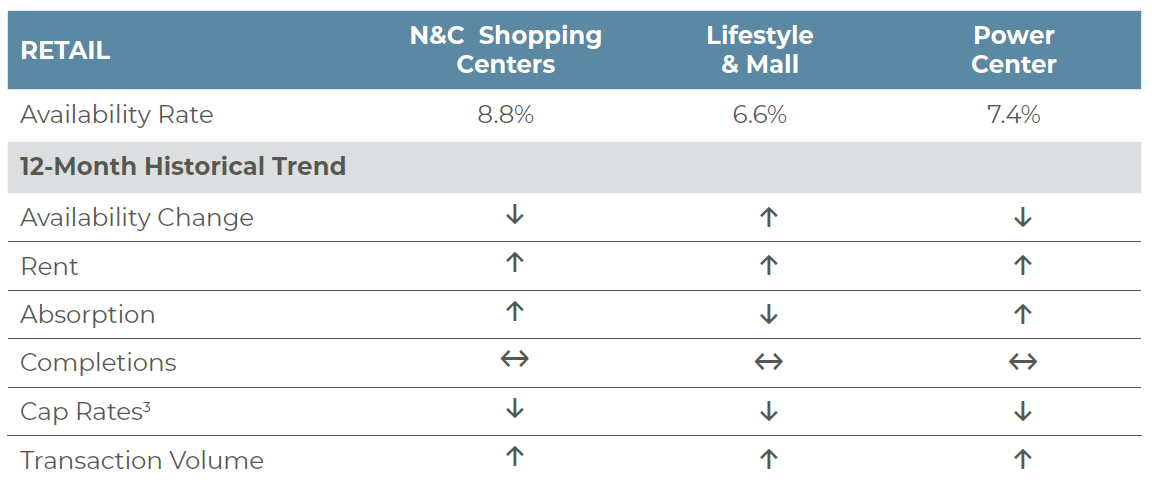
With some green shoots emerging in the retail sector, total retail availability declined to 6.2% in 2021Q2, down 30 basis points (bps) from 2021Q1. The second quarter marked the first time since the pandemic that availability improved year-over-year and the quarterly decline was the largest since mid-2016. The improvement in fundamentals was driven by firming demand and continued modest construction. Nearly 25 million square feet (msf) was absorbed in the quarter, the greatest quarterly demand since late 2018 and slightly better than the average quarterly demand of 20 msf from 2010-2015. Meanwhile, only 7 msf of space was completed in the quarter, roughly in line with the average quarterly completions of 7.6 msf since the beginning of 2020 but roughly half the quarterly average from 2015-2019.
As has been the case over recent quarters, and indeed recent years, the neighborhood and community shopping center (NCSC) segment of the market led the way in terms of improving fundamentals. Availability in the NCSC subsector of the market dropped to 8.8% in 2021Q2, down 30 bps from the previous quarter, 50 bps year to date and 20 bps year-over-year. Again, Q2 represented the largest quarterly decline since mid-2016 and also the first post-COVID year-over-year improvement. Nearly 11.5 msf was absorbed, the strongest quarterly demand since late 2017, more than reversing the 8.3 msf of negative absorption in 2020. In total, demand for the quarter was roughly double the long-term historical average from 2005-2020. Supply, meanwhile, remains largely a non-issue with only 2 msf being added to the market.
The power center (PC) segment of the market is also showing improvement. PC demand, which has struggled in recent years, firmed considerably. Roughly 2.7 msf was absorbed in the quarter, the strongest quarterly demand since late 2015. Availability declined a modest 10 bps in the quarter to 7.4%; however, this marked the first quarterly decline in availability since 2019Q4. Finally, the lifestyle and mall (L&M) segment of the market showed positive indications of recovery in late summer/early fall 2020; however, the L&M segment of the market has since stalled. Roughly 2.5 msf of space was absorbed in 2020Q3, but only 70,000 square feet has been absorbed since. At the same time 1.2 msf of space was added to the market, prompting a 20-bps increase in availability. Further, at 6.6%, availability remains 170 bps above a pre-COVID low of 4.9% in 2019 Q1.
Geographically, the South and West continue to outperform with retailers focusing on store openings in these regions given the above-average economic growth expected there and favorable demographics. Location within metro areas and more specifically retail center selection will continue to bifurcate the winners and losers in the sector, with retailers continuing to focus on the best centers in the best submarkets.
Going forward, the upcoming back-to-school shopping season will be important for brick and mortar retailers, particularly for retailers in the L&M and PC segments of the market. According to a recent survey from Shopkick, most consumers plan to return to stores for back-to-school purchases, with 92% of respondents reporting that they would shop, in part, in person for back-to-school needs, up from 66% last year. Of further note, last year with remote and hybrid learning taking center stage, the bulk of back-to-school budgets were focused on electronics and computer-related equipment. Per Shopkick’s survey, apparel (60%) and back-to-school supplies (24%) will account for the greatest proportion of consumer back-to-school budgets with electronics (10%), dorm furnishings (4%) and books (3%) accounting for much smaller shares of budgets. Overall, we anticipate market fundamentals in all retail subsectors to continue to improve over the course of 2021 and into 2022. That said, the NCSC subsector will lead the way followed by the PC and L&M subsectors. By market, we fully expect metro areas in the South and West to continue to outperform Northeast and Midwest markets; however, submarket location and center dominance will drive continued bifurcation in performance.
FIGURE 16
RETAIL DEMAND IS BEGINNING TO RECOVER
(FOUR-QUARTER ABSORPTION RATE)
Source: CBRE-EA
Source: CBRE-EA
3Cap rate trends reflect what AEW is observing in the open market; the L&M cap rate movement primarily reflects lifestyle centers. Mall trades remain limited, however, RCA cap rates for malls remain unchanged from late-2019 at 6.5%.
Capital Markets
Per Real Capital Analytics (RCA), U.S. commercial real estate sales surpassed pre-pandemic levels in the second quarter of 2021. Transaction volume soared 176% year-over-year (YOY) with roughly $145 billion in properties changing hands, the largest second-quarter total and the fourth largest quarterly total ever reported by RCA. Following the trend established in recent quarters, industrial and apartment sales accounted for the majority of all transactions with the two sectors (apartment and industrial) being credited with 56% of all trades. Nearly $29 billion in industrial properties changed hands, up 139% YOY, while roughly $53 billion in apartment properties were sold in the quarter, up 238% YOY.
Among other property types, retail and seniors housing transaction volume also more than doubled on a YOY basis, with $14 billion (+154%) and $3 billion (+131%) in properties changing hands. The hotel sector reported the greatest increase in volume at 1,718% on a YOY basis; however, this was largely driven by the Blackstone/Starwood joint acquisition of Extended Stay America, which added roughly $6 billion to hotel transaction volumes and accounted for roughly 42% of the $14.4 billion of hotel sales in the quarter. The office sector and development sites were the laggards in the quarter; however, with volume increasing 92% YOY for office to $26 billion and development sites increasing 46% YOY to $4.8 billion, the term laggard is used very loosely. Indeed, for the office sector, the quarterly transaction volume was very near the pre-COVID average quarterly volume of $27.7 billion from 2016 to 2019.
Overall, the surge in transaction volumes was largely driven by individual sales rather than portfolio sales. Individual sales, at $111 billon, accounted for 77% of all sales, higher than the quarterly average of 71% from 2015-2019. Further, in the second quarter, individual property sales were 17% higher relative to second-quarter sales over the same period. Meanwhile, portfolio sales, which totaled $27 billion, accounted for 19% of sales, slightly below the quarterly average of 22%. Relative to second-quarter historical performance, portfolio sales were roughly on par with their 2015-2019 trend. Entity sales totaled roughly $6 billion, accounting for roughly 4% of all sales, also slightly below their 7% average. Despite the slightly different composition of sales, there is no doubt that the transaction market has fully returned to pre-pandemic pacing and we expect activity to remain strong through the end of the year and into 2022.
Pricing too has rebounded sharply with the RCA Commercial Property Price Index (CPPI) increasing 9.8% YOY in June, the largest YOY gain since August 2015. Pricing by sector generally reflects the demand growth in the transactions volumes highlighted above. On a YOY basis, apartment and industrial price growth was strongest at 12.0% and 9.8%, respectively. Office and retail followed with YOY growth of 6.0% and 3.2%. Of note, CBD office price appreciation remained negative YOY (-2.4%); however, June marked the first month since the start of the pandemic that prices increased month- over-month (MOM) with the CBD office CPPI advancing a modest 0.1%. Suburban office, meanwhile, reported YOY and MOM increases of 7.7% and 0.6%. Finally, price appreciation in the six large gateway markets that RCA considers “major” markets lagged appreciation in the “non-major” markets, advancing 5.7% compared to 10.5%.
Not surprisingly, industrial and apartment returns continued to drive performance in the overall NCREIF Property Index (NPI). The total NPI return was 3.6% in the quarter and 7.4% over the previous four quarters, buoyed by industrial’s 8.9% and 23.0% quarterly and annual returns, respectively, and apartment’s return of 3.6% quarterly and 7.0% YOY. The office and retail sectors appear to have bottomed out with positive quarterly returns of 1.4% and 0.9%, respectively. On a YOY basis, office reported a 3.3% return; however, the capital return remained negative at 1.2%. Likewise, negative appreciation (-5.4%) in the retail sector resulted in a total return of -1.3%. Note, however, 2021Q2 marked the first quarterly positive appreciation return (0.3%) for office since the start of the pandemic and the trend for retail is improving with appreciation only slightly negative at -0.2% on a quarterly basis.
Per NCREIF, cap rates across all property sectors remain exceptionally low. On a market-weighted basis, the NCREIF apartment cap rate remained at 3.5%, while the industrial cap rate nudge down 20 basis points (bps) to 3.9%, the first time NCREIF has reported an industrial cap rate below 4%. Office cap rates were modestly lower at 4.4%, down from 4.5% in 2021Q1, while retail cap rates edged up 30 bps to 4.5%. While these represent cap rates from both internal and external appraisals in the NCREIF index, practically speaking, cap rates across all sectors have compressed in the open market. Indeed, even cap rates for retail properties, excluding malls, appear to be compressing, particularly for well-leased, well-located neighborhood and community shopping centers, power centers and even lifestyle centers. Going forward, with a wave of capital waiting to be deployed into real estate we expect the transaction market will remain competitive and prospects for the strong continued recovery will translate into better rent and NOI growth, which will ultimately be capitalized into values. The bottom line is that we expect cap rates to remain around their current level or perhaps nudge downward.
FIGURE 17
APARTMENT & INDUSTRIAL PRICE APPRECIATION FAR OUTPACES ALL OTHER PROPERTY TYPES
(RCA CPPI By Property Type, 2016M06=100)
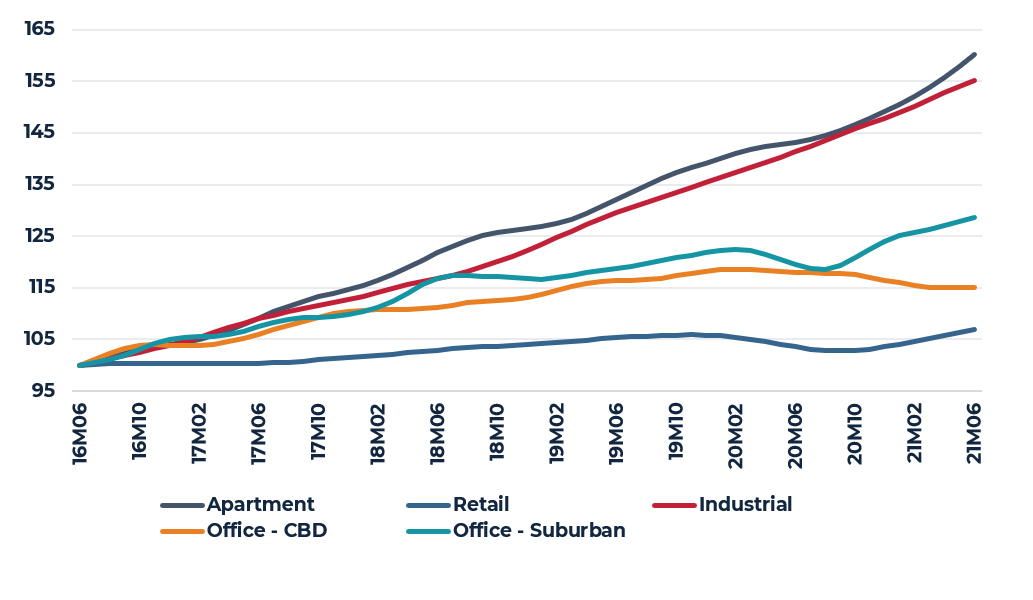
Source: RCA
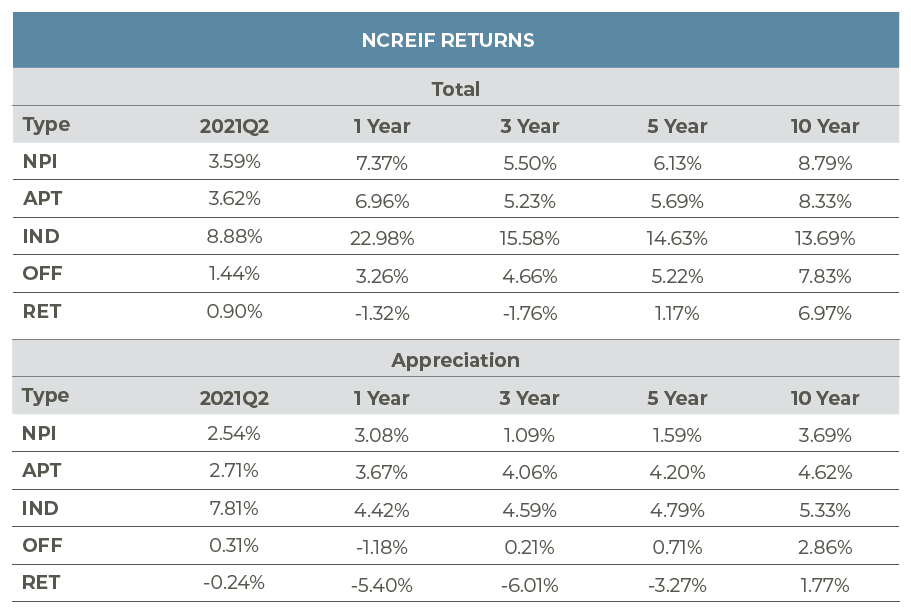
Source: NCREIF
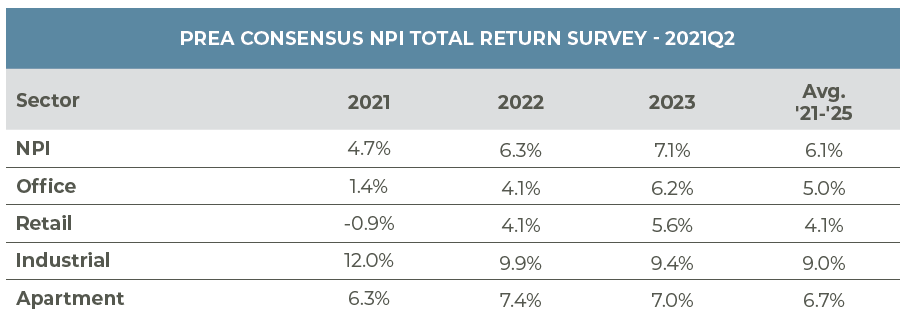
Source: PREA
This material is intended for information purposes only and does not constitute investment advice or a recommendation. The information and opinions contained in the material have been compiled or arrived at based upon information obtained from sources believed to be reliable, but we do not guarantee its accuracy, completeness or fairness. Opinions expressed reflect prevailing market conditions and are subject to change. Neither this material, nor any of its contents, may be used for any purpose without the consent and knowledge of AEW.