Back to “Normal” Slowly
Following the 31.4% annualized contraction during the second quarter, U.S. real GDP expanded at an annual rate of 33.1% during the third quarter as economic re-opening progressed at varying rates across the country. While both numbers are historic extremes, the economy remains 3.5% smaller than it was at the end of 2019 and, perhaps more importantly, more than 5% smaller than it would have been had there been no pandemic (i.e. continued to grow at the average pace of the past few years). For perspective, the peak-to-trough decline in U.S. real GDP during the financial crisis was 4%. Put another way, the U.S. economy has thus far recovered to a point that is now comparable to the worst prior contraction in the post-war period. Similarly, despite the addition of more than 8.6 million jobs since May, U.S. total employment remains more than 10 million (-7%) below the February pre-pandemic peak. Again, for perspective, during the financial crisis, the peak-to-trough decline in U.S. total employment was 8.7 million jobs (-6.3%).
FIGURE 1
RECOVERY IN REAL GDP VS. PRE-PANDEMIC TREND (TRILLIONS)
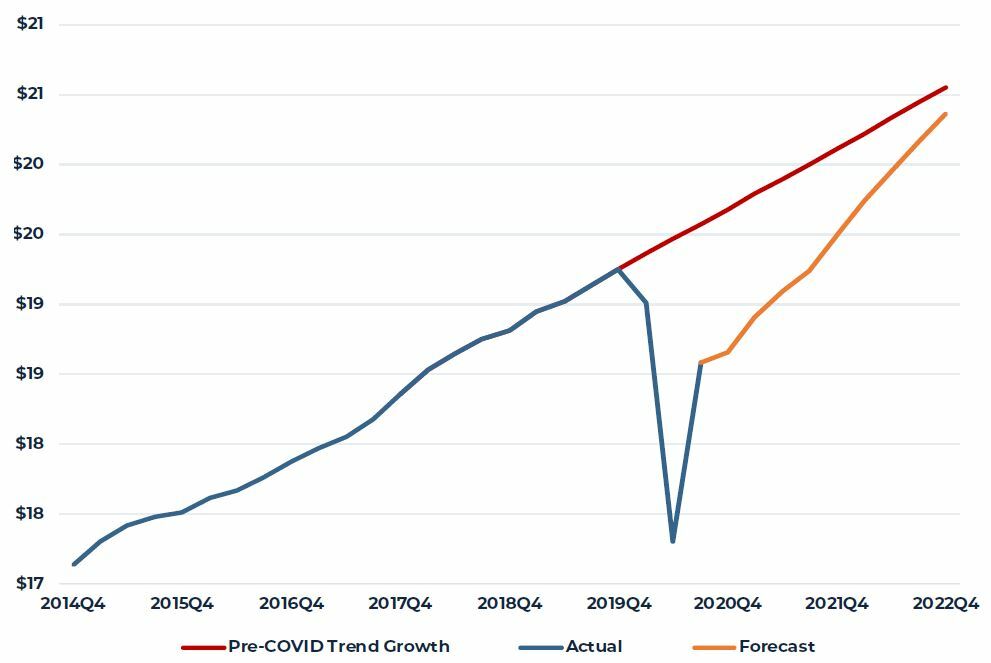
Source: Bureau of Economic Analysis (BEA)
Continued economic improvement from here remains highly connected to the progression of the pandemic and the various vaccination and therapeutic treatment developments. The current baseline forecast assumes that an effective vaccine becomes available in early 2021 and is gradually administered throughout the year. Despite this, real GDP does not catch up to the level suggested by pre-COVID trend growth until mid-2023 (see Figure 1).
In October, new infections increased dramatically, reaching a daily average of more than 85,000 new cases – far above the original April peak of 30,000 and the late July second-wave peak of 65,000. In many ways, the geographic progression of infections is reminiscent of so-called “rolling recessions” that were typical of pre-financial crisis downturns. During rolling recessions, economic activity slows or reverses in one region before being transmitted to another region, typically through the supply chain or banking system. With COVID-19, sequentially higher levels of infections are being recorded regionally as the pandemic cycles through. Currently, the most significant accelerations in new infections are occurring across the north central portions of the United States including most of the Great Lakes and upper plains states. Health officials continue to warn of even higher levels of new infection as winter approaches and more activities move indoors.
FIGURE 2
DAILY U.S. COVID-19 CASES – 7 DAY MOVING AVERAGE
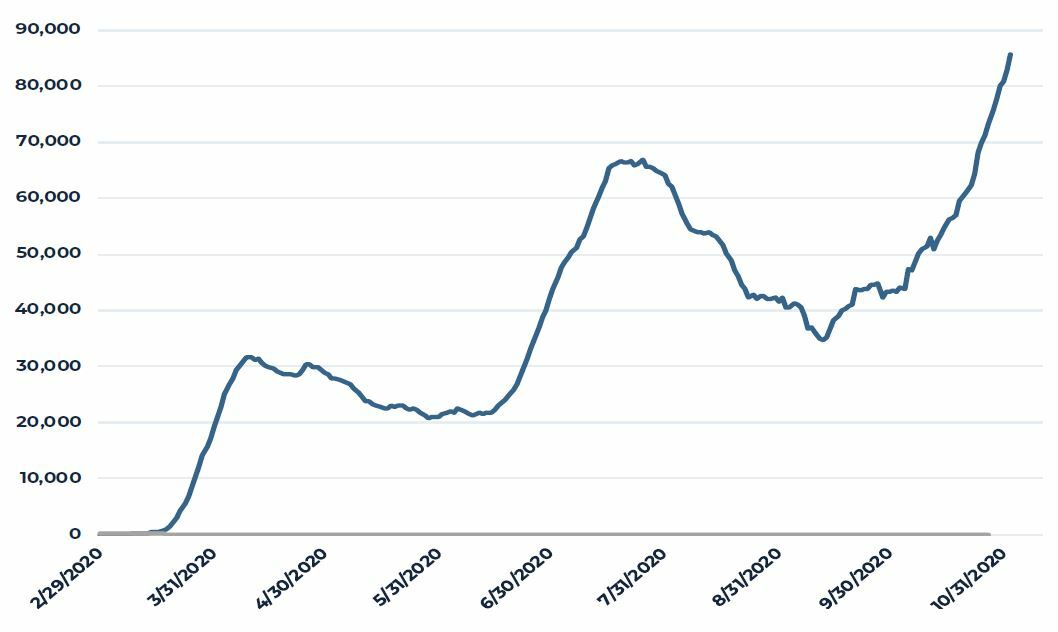
Source: New York Times (GitHub)
Reflecting the re-acceleration of virus spread and subsequent heightening of state and local restrictions on economic and social activities, various real-time measures of activity are showing very slow progress in the return to pre-pandemic levels of activity. For example, Moody’s Analytics has recently released a “back to normal” index that attempts to measure where overall economic activity sits relative to February (pre-pandemic) levels. By this measure the United States remains nearly 20% below the February norm with Maine and Hawaii representing the best and worst recoveries to normal levels.
FIGURE 3
“BACK TO NORMAL” INDEX IMPROVING SLOWLY 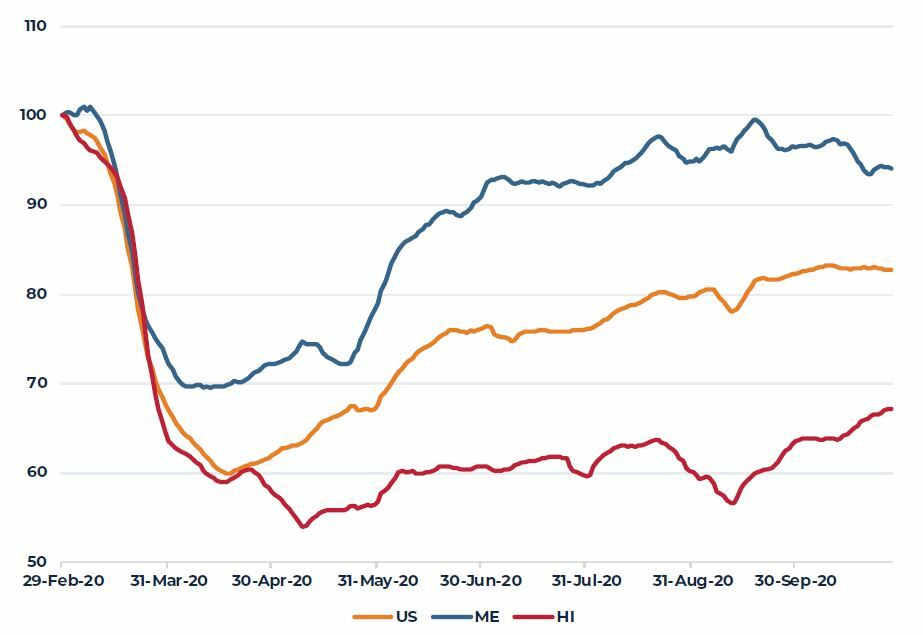
Source: Moody’s Analytics
We continue to expect moderate economic growth during 2021 with total employment recovering to its pre-pandemic peak by late 2022 or early 2023. Again, there will be significant variation in the performance of regions and industries as the K-shaped recovery continues.
Property Markets
The low frequency and lagging nature of most property market data continues to slowly reveal the extent of the pandemic-induced economic contraction on the nation’s commercial real estate. Vacancy and market rent levels take some time to fully adjust to the new (and still changing) supply and demand fundamentals in most markets. This is particularly true in markets with limited leasing and transaction visibility. The strength or weakness of the operating performance of properties, however, does reveal itself more quickly as illustrated by the year-over-year growth/decline in property net operating income (NOI) shown in Figure 4. During the second and third quarters, retail and apartment NOI contracted significantly while office and industrial property NOI growth slowed. This divergence reflects both the varying financial stresses facing tenants in the various property sectors as well as factors such as lease term, rent collections and the efficacy of government support programs.
FIGURE 4
YEAR-OVER-YEAR GROWTH IN NET OPERATING INCOME (NOI)
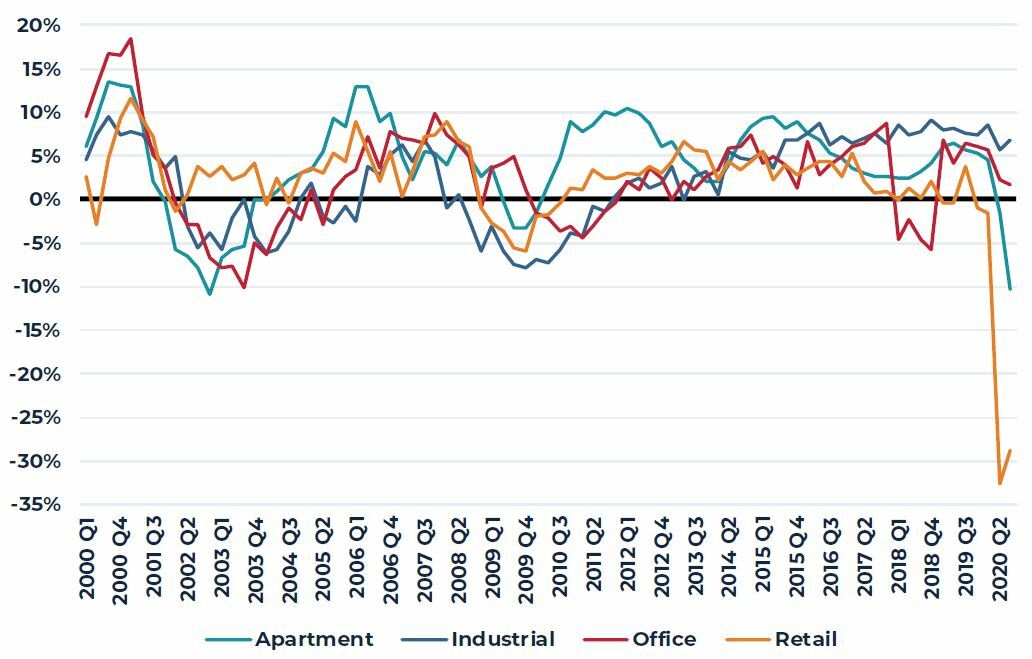
Source: NCREIF 2020 Q3
Near-term investment conviction will likely remain low in situations where the property income is uncertain. This remains the case in hotels, regional malls, some other retail formats and certain office properties. Conviction remains much higher in most industrial properties and, to a lesser degree, apartments and in these cases, pricing may well exceed pre-pandemic levels. Reflecting this, the most recent investor consensus survey suggests continued appreciation in industrial and apartment properties over the next five years largely offset by valuation declines in retail and, to a lesser extent, office properties.
FIGURE 5
FIVE-YEAR CAPITAL VALUE OUTLOOK INDEX, 2019 = 100
Source: PREA, 2020 Q3 Consensus Survey
Office
While many sectors have seen job growth decline as a result of the pandemic, office employment is faring better than overall employment. The office-using employment sector includes information, financial activities, and business & professional services, which have seen an easier transition to working from home. In the third quarter of 2020, office employment was down 5.2% year-over-year (YOY), while overall employment was down 6.9% YOY. This is an improvement seen from the prior quarter (–6.7% YOY for office and -11.2% YOY overall). That being said, employment growth is still negative. This translates to the aggregate loss of 1.7 million office jobs and 10.4 million total jobs over the last year.
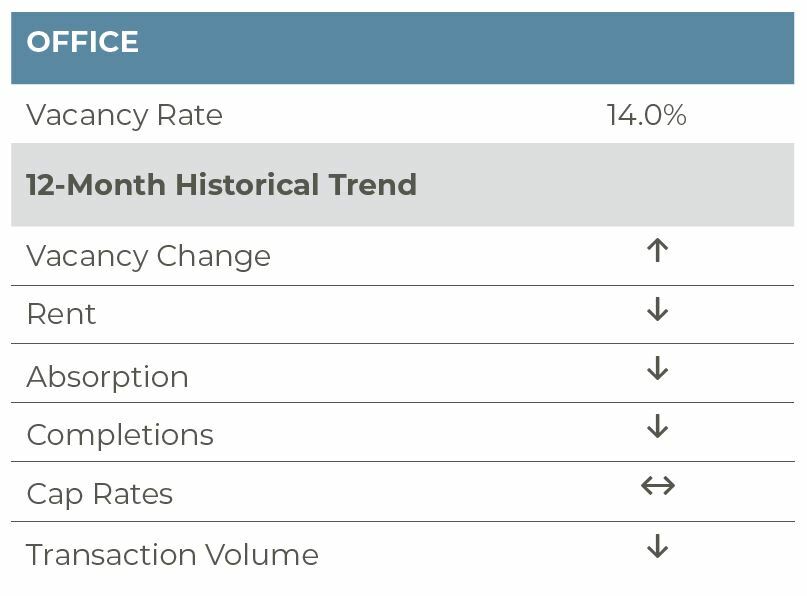
Further, the COVID-19 pandemic and the resulting economic downturn has continued to affect the U.S. office market as workers continue to work from home, leading to a sharp decline in demand and an increase in available office space for sublease. First, 33.5 million square feet (msf) of space was given back in the quarter; this, along with the 21.4 msf returned to the market in 2020Q2, pushed vacancies to 14.0% in 2020Q3, up 100 basis points (bps) from the previous quarter and 180 bps from year-end 2019. Further, with less need for physical office space and a need for some firms to cut costs in the face of the economic downturn, CBRE-EA reported space available for sublease increased to 56.1 msf, an increase of 10.8 msf (23.9%) from the previous quarter and 18.2 msf (48.4%) year-to-date. Sublet vacancy now represents 1.4% of inventory, the greatest level since the Great Financial Crisis (GFC) and only 30 bps below the GFC historic high.
When looking at this sublet trend across markets, tech hubs have seen some of the largest increases in sublet vacancies. San Francisco (3.1%; 80 bps), Oakland (2.6%; 60 bps) and Austin (2.5%; 60 bps) are seeing the highest sublet vacancy rates as well as some of the largest increases on the quarter. In terms of sheer square footage, markets like New York (10.2 msf), Washington, DC (3.9 msf), Boston (3.2 msf), and Dallas (3.1 msf) have some of the largest inventory of vacant sublet space. With leisure & hospitality being most significantly impacted by the pandemic, hospitality-focused firms like Uber, Airbnb, and Yelp have laid off a sizable number of their San Francisco employees. In Chicago, Groupon plans to lay off nearly half of its workforce and is aiming to sublet 150,000 sf of office space. In Austin, the amount of available space will likely increase as 3.5 msf of space is underway and only 50% of it is pre-leased.
On the supply side, completions moderated this quarter, resulting from pandemic-related construction delays and the current economic climate. Just 7.3 msf was delivered, reaching the lowest quarterly completions since mid-2014. This moderation, however, is temporary as 3.3% of stock, or 130 msf of space, is currently underway. New York, Boston, San Jose, Washington DC, San Francisco, Los Angeles, Austin, Chicago, Atlanta and Dallas account for 81 msf of space underway (58% of the total) and on average the space in these markets is only 60% pre-leased. Further, there is a risk of pre-leasing cancellations as well in today’s challenged environment. Indeed, Pinterest walked away from its 490,000 sf pre-lease commitment at 88 Bluxome Street in San Francisco.
Going forward, office employment is projected to return to peak in mid-to-late 2022; this delayed recovery, relative to earlier projections, will likely temper office market fundamentals. Further, uncertainty with regard to how and when offices become fully functional again clouds the outlook. In a post-COVID environment, however, there will be clear winners and losers in the office sector. Properties with the most up-to-date mechanical and HVAC systems and open concepts with better ventilation will outperform older, more commodity properties. We do believe people will eventually return to urban areas; however, in the meantime, highly dense, public transportation-dependent, expensive urban markets, like New York and San Francisco, will be more adversely impacted relative to driving markets like Dallas, Charlotte, Nashville and Austin.
FIGURE 6
US OFFICE SUBLEASE VACANCIES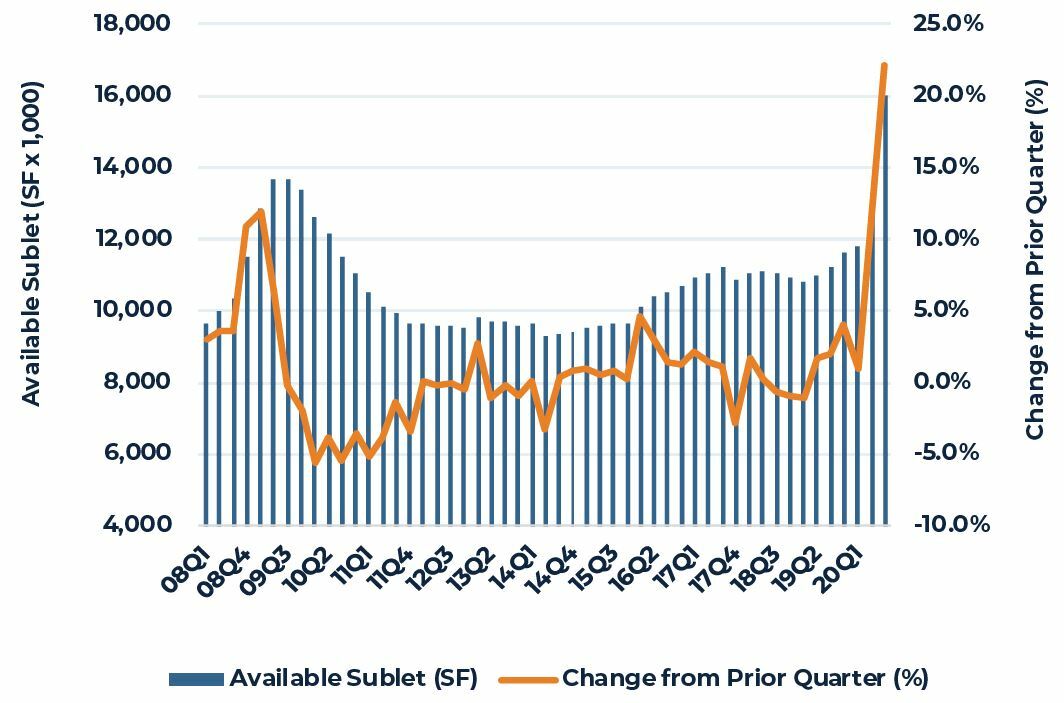
Source: CoStar; Includes office space <25K SF
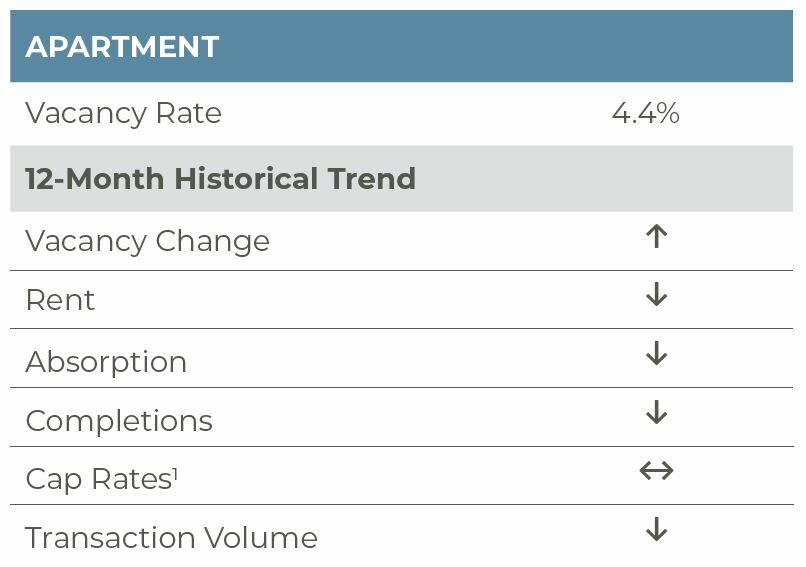
Apartment
According to preliminary data from CBRE-EA, the national apartment market vacancy rate was 4.4% as of the third quarter of 2020. This is an increase of 80 basis points (bps) year-over-year (YOY). As U.S. total employment remains down 10.7 million positions compared to pre-COVID levels, this rise in vacancy is still relatively modest. In comparison, during the Great Financial Crisis, the second quarter of 2009 reported a 170 bps rise in vacancy rates YOY, with the vacancy rate jumping from 5.6% to 7.3% in a single year. While apartment fundamentals have remained surprisingly resilient, the impact of the pandemic and its effect on the economy will likely push the vacancy rate up further as eviction moratoriums expire and the federal stimulus continues to stall.
The national increase in vacancy was widespread across markets. CBRE-EA’s Preliminary Flash Report states that of their 66 tracked markets, 49 markets reported a YOY vacancy rate increase this quarter while just 14 markets experienced a decrease in vacancy and 3 markets maintained the same vacancy rate. Markets with a high cost of living and high densities have seen some of the largest increases in vacancies, for example San Francisco (360 bps), Boston (150 bps), Los Angeles (140 bps), Washington, DC (130 bps), New York (100 bps), and Chicago (50 bps) all saw hefty increases. With the freedom to work from home and from anywhere, many renters are attracted to cheaper markets and less dense areas that have not been as impacted by the pandemic. Only four markets reported a decrease in vacancies above 50 bps: El Paso (-140 bps), Riverside (-70 bps), Norfolk (-60 bps), and Tulsa (-60 bps).
In a departure from the urbanization trends seen over the last few years, urban apartments have now been underperforming relative to suburban apartments. Core urban markets across the country are seeing higher vacancy rates and larger concessions than suburban areas, even in the same metropolitan areas. Per National Real Estate Investor, New York saw 10,725 less occupied apartments in 2020Q3 than the prior quarter, with nearly 6,700 of those units in the urban core. Job losses have contributed to this, as young professionals may have had to move back home. Indeed, the Pew Research Center estimates more than 50% of people aged 18-29 are currently living with a parent, the highest level since the Great Depression. Even in metros where there is still positive demand for the urban core, like Houston, new supply has kept rents down and vacancy rates up.
Newly-built, Class A apartments have had to offer significant concessions to attract renters. According to National Real Estate Investor, Class A effective rents have contracted 3% YOY on average in August 2020 as a result of these added concessions. In contrast, average rents in Class C apartments grew 3.8% over that same period. Overall, rents have fallen in many metros, led by New York City, San Francisco, San Jose, Washington, DC, and Orlando. Per Zillow, the percent of apartment listings featuring concessions rose from 16.2% in February 2020 to 30.4% in July 2020. Meanwhile, YOY rent growth has slowed from 3.9% to 1.2% over the same period, showing the impact of these added concessions. Per MRI, September apartment concessions volume jumped to a new high of 21% for this year, driving up the average concession value 13% year-over-year.
The apartment rent collection rate has remained relatively consistent. NMHC reports that as of October 27, 2020, 94.6% of apartment households have paid rent. This is just 120 bps below the rent payment share collected by October 27, 2019. However, this is still a 240 bps improvement to the 92.2% collected by September 27th, 2020. The coming months will bear watching, however, as additional federal stimulus will likely be necessary to help buoy rent payments and occupancy levels.
FIGURE 7
URBAN OCCUPANCY COMING DOWN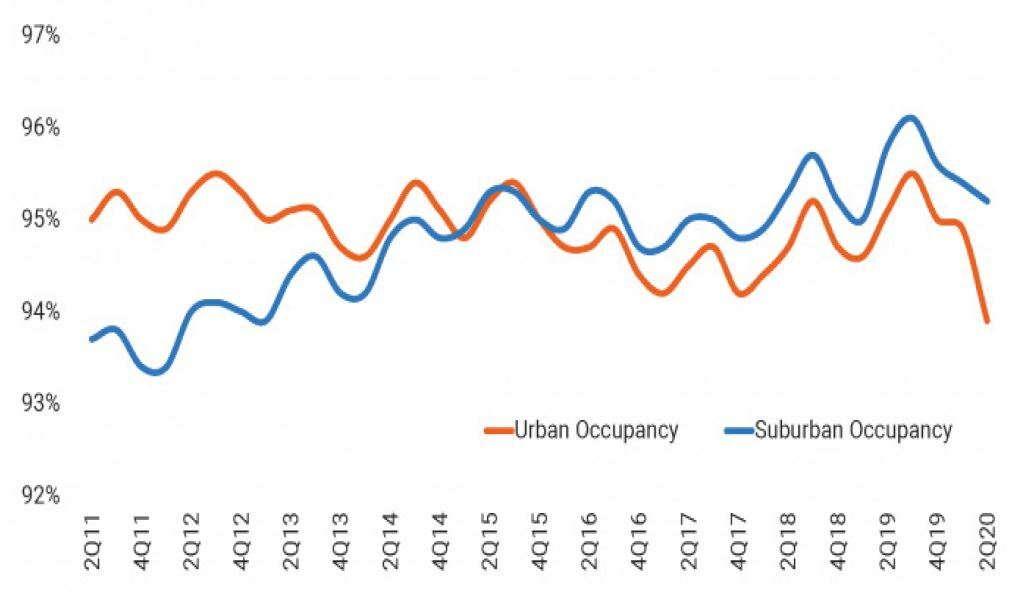
Source: RealPage, Inc.
FIGURE 8
RENTAL CONCESSIONS ARE ON THE RISE SINCE THE BEGINNING OF THE PANDEMIC
Share of Rental Listings with a Concession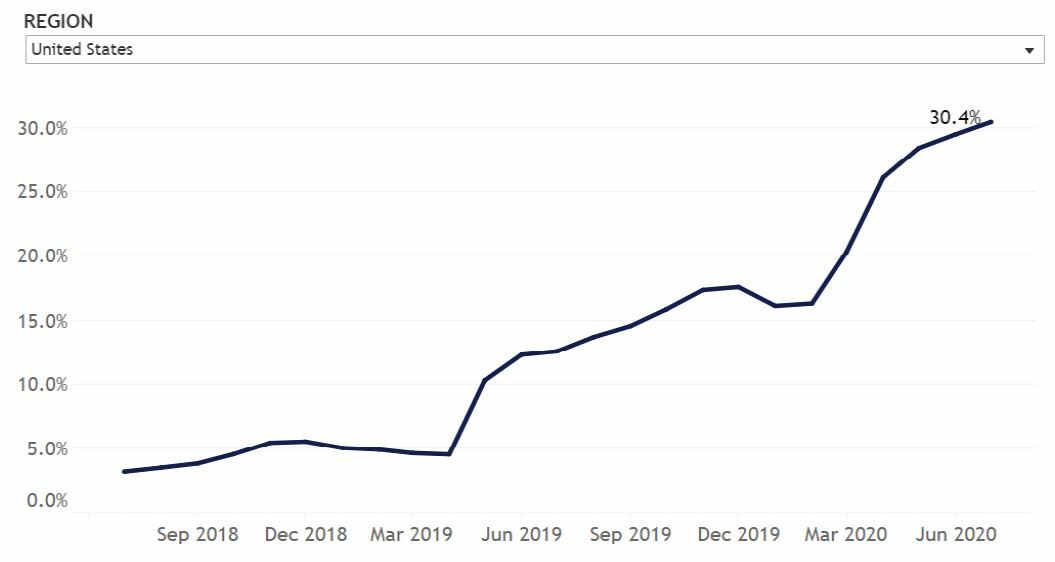
Source: Zillow Economic Research; Zillow data
1 NCREIF cap rates are lower due to weaker NOI; however, Real Capital Analytics transaction cap rates are flat.
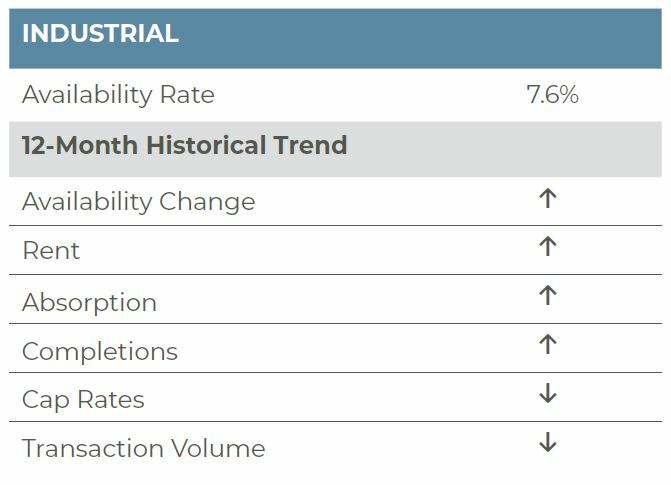
Industrial
The industrial sector continued its outperformance in the third quarter, shrugging off the ongoing pandemic and associated economic impacts. Nearly 57 million square feet (msf) of space was absorbed, the greatest quarterly demand since the fourth quarter of 2018 and more than double the second-quarter tally. Construction activity picked up slightly, however, with 68 msf being completed; this kept availability flat quarter-over-quarter at 7.6%. Amazon remained among the most active lessees; however, the e-commerce giant accounted for only 10% of total leasing, per CoStar. Other consumer-oriented users, like Target, Walmart, Home Depot, Uline and Radial, were also active in the quarter, while demand from manufacturers (Komatsu, Milwaukee Tools, General Motors and Nikola, to name a few) also drove demand higher. Lastly, the ongoing upward demand trends in cold storage continued. According to CoStar, refrigeration/cold storage and food processing availability among the nation’s largest markets declined to 6.6% in the third quarter of 2020, down from 7.1% in the previous quarter and 7.4% from the end of 2019. Further, vacancy in the cold storage sector was a mere 3.1% in the third quarter with only 9.8 msf currently vacant nationally.
While the strength in demand has been broad based by tenancy, it has also been broad based by region. Both traditional gateway and secondary markets reported strong demand. Salt Lake City, Phoenix, Dallas, Riverside, Atlanta, Austin and Allentown all reported quarterly demand of 1.0% or more as a share of inventory, a demand rate that is two-and-a-half to four times the U.S. average of 0.4%. Likewise, year-to-date demand among the aforementioned markets also led the nation; however, Baltimore, San Antonio and Vallejo also joined the list in reporting a demand rate that is two-and-a-half times the national average of 0.8%. Overall, in the third quarter, demand was meaningfully negative in only three markets — Trenton, San Jose and San Francisco all at –1.2% of inventory; year-to-date, only six markets — Los Angeles (-0.5%), Hartford (-0.6%), Long Island (-0.7%), Trenton (-0.9%), San Francisco (-1.1%) and San Jose (-2.4%) — reported notable weakness in demand.
With demand picking up and overall healthy conditions across most markets, 17 markets reported year-over-year rent growth of over 4.0% while 12 additional markets reported rent growth between 2.5% and 4.0%. Of note, a number of smaller secondary, and even tertiary, markets reported the greatest increases in rents. Indianapolis, Memphis, Greenville, San Antonio, Vallejo, Pittsburgh, Salt Lake City and Charlotte all reported rent growth in excess of 5.0%.
Going forward, we fully expect demand will remain strong from e-commerce and omni-channel retailers as the ongoing Coronavirus pandemic has accelerated shifting consumer preferences for online shopping versus brick and mortar shopping. Production-oriented demand is also expected to remain healthy, as the current health crisis has revealed weaknesses in dependence on overseas production and highlighted the importance of having redundant manufacturing capabilities. The weaknesses of lean inventory management have also been revealed during the pandemic and the need for inventory redundancy going forward will also provide a boost to overall industrial demand. Finally, demand for temperature controlled warehouse and food production space is expected to be strong in the years ahead, driven by growth in food consumption and production, as well as increased demand and usage of temperature-controlled pharmaceuticals. Indeed, rather ironically, leading COVID-19 vaccines in development are dependent on cold storage. Moderna Pharmaceutical’s and Pfizer’s vaccines, which are mRNA-based, reportedly need to be stored frozen at –4o and –94o Fahrenheit, respectively, and will remain effective above those temperatures for only 24 to 48 hours. Meanwhile, Sanofi’s and Novavax’s COVID-19 vaccines, which are protein subunit-based, can be stored and shipped in liquid form, but require refrigeration between 35o and 46o F. Overall, these vaccines, along with myriad temperature-sensitive pharmaceuticals, will support cold storage demand. On the supply side, the broad industrial construction pipeline is relatively modest with 272 msf or 1.9% of inventory underway. Based on recent demand trends, this represents roughly one-and-a-half years of supply. Thus, we believe the market will remain a landlord/owner favorable market, allowing for healthy rent growth.
FIGURE 9
CBRE-EA INDUSTRIAL MARKET FUNDAMENTALS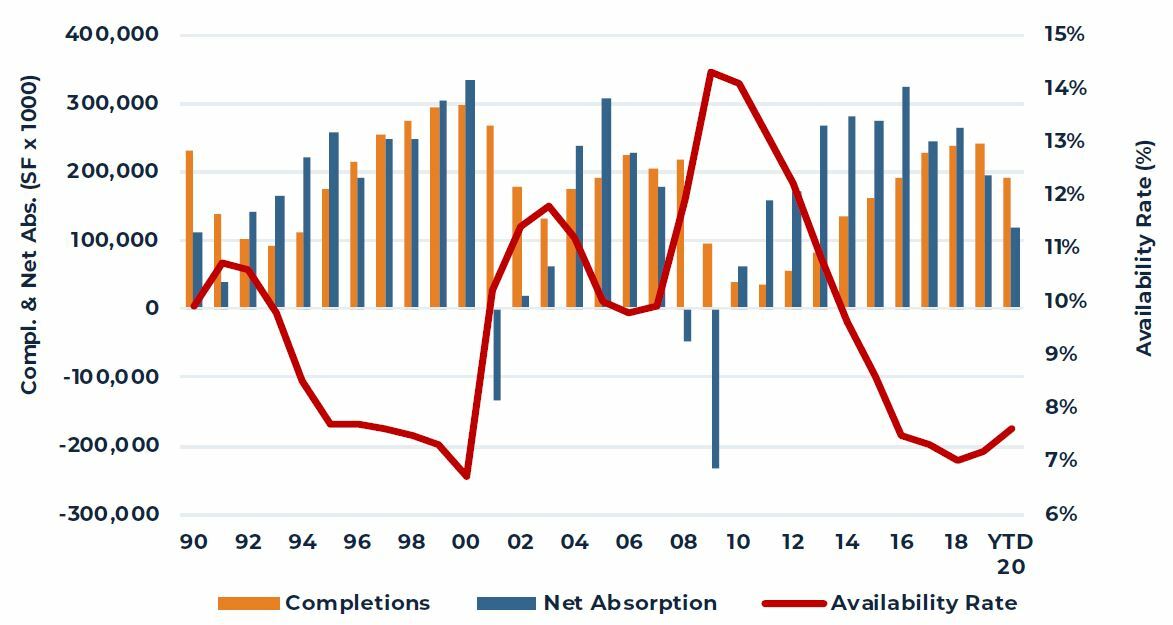
Source: CBRE-EA
Retail
The struggles in the retail sector continued into the third quarter and more pain is likely in the months ahead as the second wave of the COVID-19 pandemic is underway and infection rates are rising rapidly. Nearly 15 million square feet (msf) of retail space was returned to the market, the largest quarterly decline in net absorption since the Great Financial Crisis (GFC) and outpacing the 11 msf returned to the market in the second quarter. Total retail availability, as a result, increased to 6.6%, up 60 basis points (bps) year to date and the highest level since early 2016 (6.9%). The property subtype that is feeling the greatest pressure is the lifestyle and mall segment (L&M). Year-to-date, 6.8 msf of space or 0.9% of inventory has been returned to the market. The weak demand pushed availability up to 6.5% in the third quarter, the highest level since the GFC and up 170 bps from a late-2016 low of 4.8%. Demand was softer in the neighborhood and community shopping center (NCSC) and power center (PC) segments as well, but to a lesser degree compared to inventory. In the NCSC segment, 0.6% of inventory (18.1 msf) was returned to the market year-to-date, pushing availability to 9.4%, levels last seen in the segment in mid-2017, but still substantially below the historic high of 13.0% during the GFC. Meanwhile, 0.4% of PC inventory (2.5 msf) was given back, sending availability higher, to 7.3%, up from 5.3% in early 2016 but, again, well below the GFC and historic high of 9.0%.
The performance by sector, of course, has been shaped by 1) changing consumer preferences with respect to online shopping and actual visits to a physical store, 2) competition within the apparel sector due to a proliferation of value-oriented retailers and 3) financial stress among department stores. The ongoing pandemic has amplified challenges and accelerated changing consumer behavior that began pre-pandemic. Overall, the lines between retail and industrial have blurred considerably over the past few years and that trend continues today. Amazon and Simon Property Group (SPG) have been in discussions to open distribution or fulfillment centers in vacant department stores. Meanwhile, in other mall news, SPG and Brookfield Property Partners (BPY) reached an agreement to buy J.C. Penney’s retail business for $300 million in cash and the assumption of $500 million in debt. The agreement splits J.C. Penney into two pieces, the retail business that will be owned by SPG and BPY and its real estate, which will be owned in part by its creditors. The purchase by SPB and BPY will keep additional department stores from going dark and, hopefully, allow for a post-pandemic recovery.
While the L&M segment has experienced greater struggles relative to the NCSC and PC segment, the latter segments, again, have not been unscathed. Rents across the retail spectrum reflect this. Broadly, across the U.S., NCSC rents are essentially flat on a year-over-year basis, while PC and L&M rents declined by roughly 8% and 3%, respectively, per CBRE-EA. Further, property net operating income is also feeling the COVID-related strain with collections remaining challenged. According to NCREIF, retail rent collections were roughly 80% in October; while this is up from the spring when collections were below 50%, the cumulative impact of weak collections is an additional strain on the sector.
Going forward, rising infections likely spell greater trouble for the retail property sector. A surge in infections is rolling back openings in some states and the onset of winter will clearly impact restaurants as outdoor dining will be challenging. Further, if Europe is used as an example, a broader shutdown could be in the future; that said, much will depend upon the outcome of the U.S. Presidential election. Meanwhile, there is promising news on the vaccine front with four potential vaccines being in the Phase 3 large-scale trials in the U.S. The actual production and widespread vaccination of the U.S. population, however, may not happen until late 2021. Further, this is predicated on the assumption that people will feel comfortable receiving the vaccine. Overall, this means the retail sector will be in for tough sledding this winter (pun intended), with hopefully, better days coming in the latter half of 2021. The NCSC and PC segments of the market will likely hold up better than L&M sector, as NCSC is predominantly necessity-based while the PC segment also has a sizeable exposure to necessity-based retailers like Target, Wal-Mart and Costco and also allows for better social distancing and is not enclosed like malls. The bottom line is the challenges facing the sector will persist through the better part of 2021 at the earliest.
FIGURE 10
AVAILABILITY RATES BY RETAIL SUBTYPE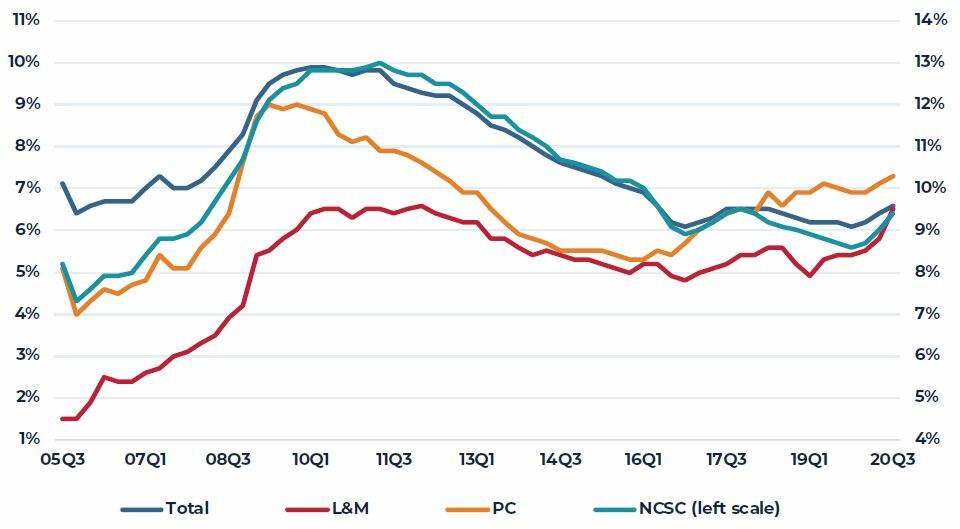
Source: CBRE-EA
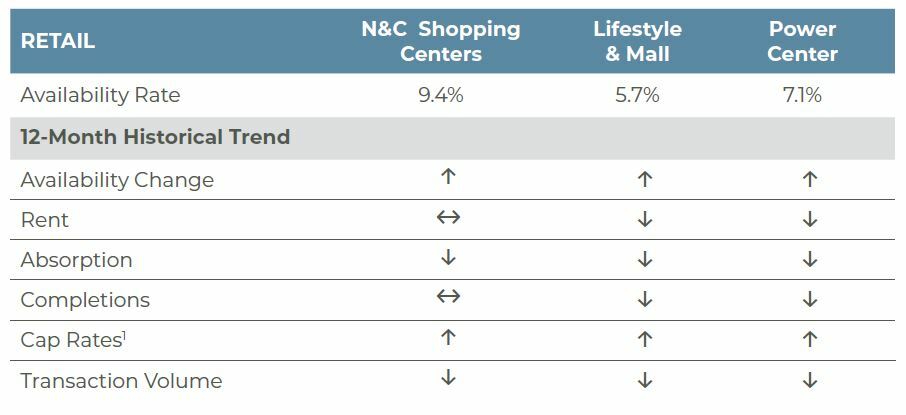
1 NCREIF cap rates are lower due to weaker NOI; however, Real Capital Analytics transaction cap rates are flat.
Capital Markets
Transaction activity remained modest in the third quarter of 2020, but was up relative to the height of the first COVID-19 surge and economic shutdown in the second quarter. Roughly $68.4 billion in property changed hands in the third quarter, again outpacing the second-quarter total of $49.9 billion but down 57% year-over-year (YOY). Unsurprisingly, the apartment and industrial sectors accounted for 35.0% and 22.5% of all transactions, respectively, in the quarter. The office (19.9%), retail (9.6%), hotel (2.8%) and seniors housing sectors (2.3%) accounted for the remaining 35% of transaction volume. Per Real Capital Analytics (RCA), distress does not appear to be playing a major role in the transaction market to date. According to RCA, on a preliminary basis, only 1% of deals were reportedly distressed sales; this follows only 2% of trades in the second quarter. That said, further distress is expected, absent any government intervention or support. According to Fitch Ratings, CMBS loan delinquencies stood at 4.64% in September and this was likely an underestimation of true distress as 3% of loans were granted relief. Instead, Fitch estimates the CMBS delinquency rate would be nearly 8%. Again, the hardest hit CMBS sectors right now are the hotel and retail sectors, where delinquency rates stood at 17.2% and 10.8%, respectively, in September. Within the retail sector, the distress is in the mall sector with regional malls reporting an 18.7% delinquency rate.
The pressure on the economy and subsequent deterioration in property market fundamentals is flowing through to pricing. Year-over-year growth in RCA’s repeat sales index, the Commercial Property Price Index (CPPI), began to slow pre-pandemic; however, the pandemic has accelerated the slowdown in price appreciation. The CPPI increased only 1.4% YOY in September, with weakness in retail (-5.3% YOY) and suburban office (-2.7% YOY) holding down overall growth. Industrial (7.4%), apartment (6.7%) and office (6.7%) price appreciation offset the aforementioned weakness, allowing for the modest growth. By market segment, it is not surprising that the six major markets (Boston, Chicago, Los Angeles, New York, San Francisco and Washington, DC) only reported a 1.3% YOY increase in the CPPI, while non-major market prices increased 1.9% YOY. Pricing is likely being held in positive territory as only the best properties are changing hands today with buyers unwilling to pursue properties without certainty of cash flow or with sellers unwilling to capitulate in hopes of holding on for a better day.
To that end, the NCREIF Property Index (NPI) shows a softer market, as it tracks properties held as well as sold in the quarter, not just properties that changed on a repeat sales basis. According to the NPI, all but the industrial property sector experienced a decline in capital values in the third quarter of 2020. Depreciation was greatest in the hotel (-2.72%) and retail (-1.49%) sectors, followed by the office (-0.77%) and apartment (-0.4%) sectors. Income offset the decline in apartment and office depreciation, leading to a total return of 0.51% and 0.31%, respectively. The total return for retail and hotels was decidedly negative at –0.52% and –4.17%, respectively; both property sectors have reported negative total returns in all quarters of 2020 to date. Both the apartment and office sectors positive total return in the third quarter was a reversal from the second quarter. The industrial sector reported a significant outperformance, with an appreciation, income and total return of 1.93%, 1.11% and 3.04%, respectively.
NCREIF cap rates remained steady in the industrial and office sectors at 4.71% and 4.87%, respectively; however, the retail and apartment sector cap rates moved lower in the quarter due to a sharp drop in NOI. Per NCREIF, retail NOI was down 27% in the third quarter on a YOY basis, while apartment NOI declined 10%. Subsequently the retail cap rate dropped to 4.66%, down from 5.27% a year ago, and the apartment cap rate edged down to 3.78%, down from 4.24% in 2019Q3.
Going forward, cap rates will likely remain relatively stable in the apartment sector; however, continued healthy fundamentals, strong rent growth and appreciation may push industrial cap rates down slightly, particularly in non-gateway markets, which are experiencing strong tenant and investor demand. Cap rate movement in the office and retail sectors will be more mixed, varying across property subtype and market. On a go-forward basis, according to the PREA Consensus Survey, the industrial sector (7.2%) is projected to post the strongest returns over the next five years, followed by the apartment (5.6%), office (4.0%) and retail (0.9%) sectors.
FIGURE 11
RCA TRANSACTION VOLUME & PRICING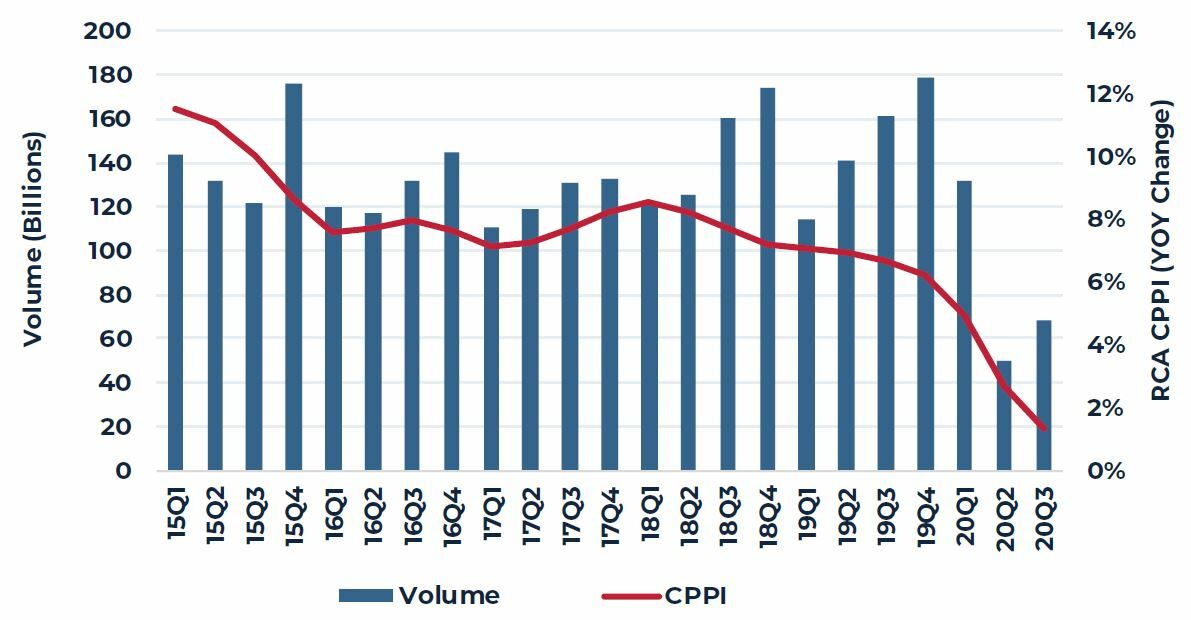
Source: Real Capital Analytics
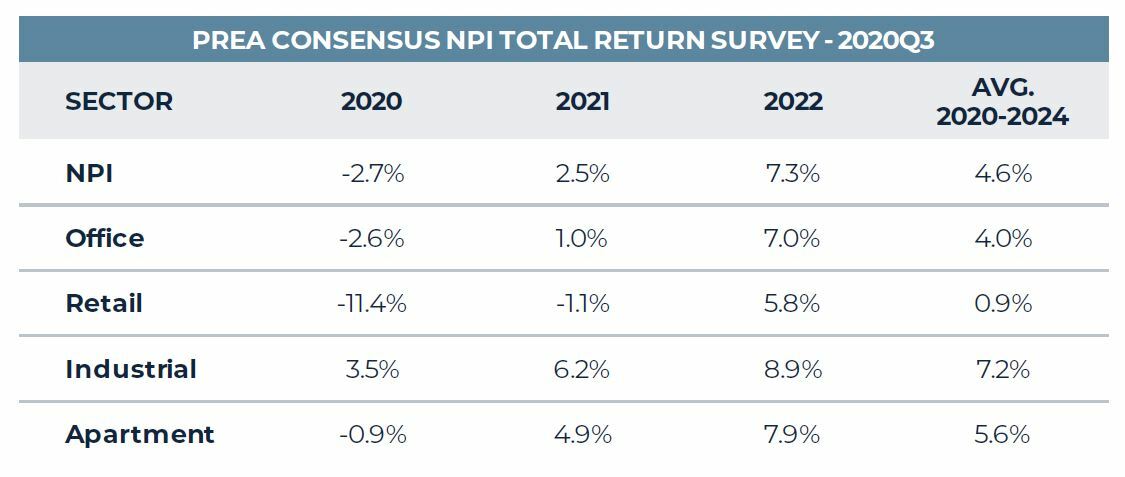
Source: NCREIF
The information and opinions presented in this research piece have been prepared internally and/or obtained from sources which AEW believes to be reliable; however, AEW does not guarantee the accuracy, adequacy, or completeness of such information.