LOGISTICS’ STREAK TO CONTINUE
- Logistics is expected to continue its strong run as most European investors’ favorite asset class. Based on our analysis, European logistics will outperform other property types over the next five years.
- Solid growth for trade and retail sales -- the key drivers of occupational demand from logistics operators and retailers -- is projected for the post-Covid recovery. Despite some weakness in recent container volume data, we anticipate a strong recovery in the medium term.
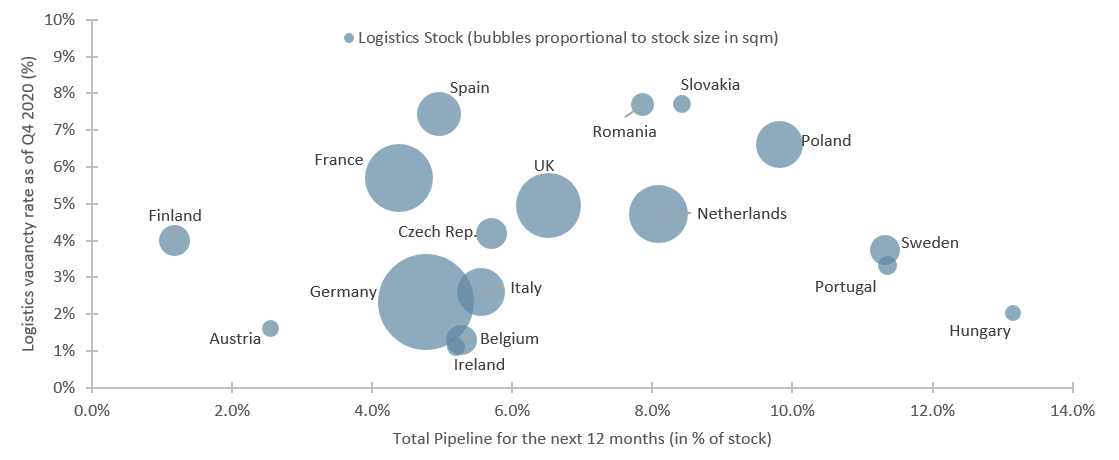
- The chart below shows that across the largest markets, Poland, Netherlands and UK have relatively strong total development pipelines. France and Spain have higher vacancy rates but smaller pipelines. Germany is not only the largest, but also one of the safest markets from a supply/demand perspective.
- Our projection of 1.7% pa prime logistics rental growth over the next five years reflects both the current low vacancy rates, relatively moderate pipeline of new development activity and continued levels of record take up.
- After a 5% increase in 2020, logistic deals set a new record of 16% of total European volumes. This strong liquidity in investments should drive further growth in build-to-suit and speculative development.
- Further average yield tightening of 30 bps is forecasted across our 32 markets for the next five years, despite the significant 140 bps compression since 2016. This is supported by our lower for longer bond yield outlook and the strong momentum and outlook for both the occupier and investor markets.
- As a result, prime logistics returns for the 2021-25 period are forecast at 8.5% pa in our base case. Our risk-adjusted return framework shows all logistics markets as attractive -- with expected returns exceeding required returns. Logistics is more attractive on that basis than most European office and retail markets.
LOGISTICS VACANCY AND TOTAL PIPELINE (IN % OF STOCK)
Sources: CBRE, AEW Research & Strategy
LOGISTICS DRIVERS
SOLID REBOUND FOR EUROZONE TRADE & RETAIL SALES
- Despite Eurozone economic growth being significantly impacted by the Covid-19 restrictions in 2020, the first signs of a solid rebound are under way.
- Led by China and the US globally and the UK in Europe, GDP growth is projected to come back strongly in 2021-22, as highlighted in our mid-year 2021 outlook.
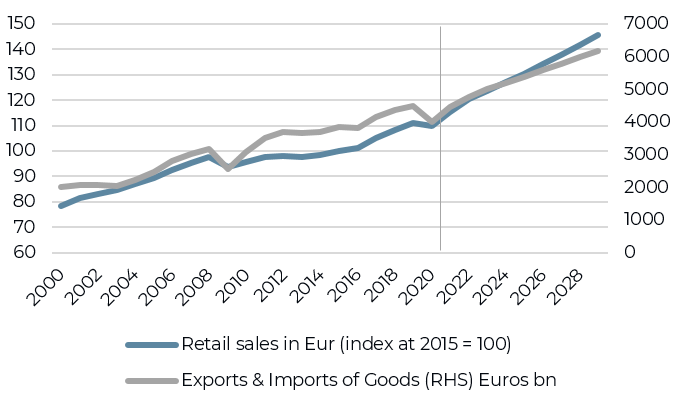
- Oxford Economics’ latest forecasts for Eurozone goods trade (as represented by exports and imports) and retail sales confirm this solid rebound.
- As we have highlighted the role of e-commerce penetration many times before, we wanted to emphasize that regardless of how sales are achieved they will prove a key driver of demand for logistics space. All the more as multi-channel adaptation and functions generated by e-commerce (fulfillment, small customized manufacturing, return logistics) are requiring more logistics space.
Eurozone goods trade & retail sales
Sources: e-Marketer, AEW Research & Strategy
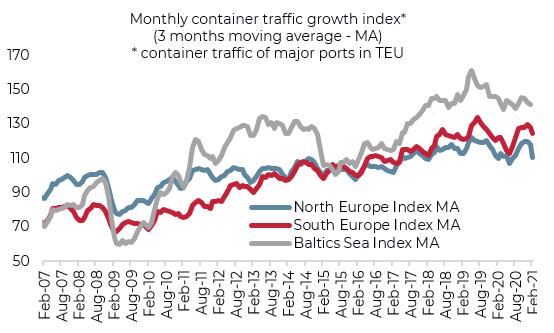
CONTAINER TRAFFIC HAS SHOWN RESILIENCE
- Northern European ports remain the main entry for container trade (TEUs volume --20 Foot Equivalent Units) at 61%.
- On the other hand, Southern European and Baltics ports have shown a higher growth in volumes over the 2007-2021 period.
- But, given their relatively lower volumes and access, activity has been more volatile and sensitive to shocks in world trade, especially for Baltics ports.
- The near doubling of Baltic volumes since 2007 could provide attractive opportunities for global shipping and trading firms.
- This could be an interesting driver for demand for logistics space in emerging Southern European and Baltic harbour-based markets.
- Despite the well publicised impact of Covid-19 and the recent Suez-canal blockage, container traffic data show stabilized trend.
European container traffic
Sources: RWI / ISL, AEW Research & Strategy
TRANSPORT VOLUMES NOT ALWAYS TIED TO POPULATION
- Trade volumes are a key driver of demand for logistics space.
- Newly compiled data from Green Street allows us to compare trade volumes on a European city level to other drivers.
- When we explore this we find some interesting results.
- Increased levels of e-commerce penetration have been a key driver for logistics demand from on-line retailers and third party logistics providers. But, there is no clear correlation between e-commerce penetration and total transport volumes on a city level.
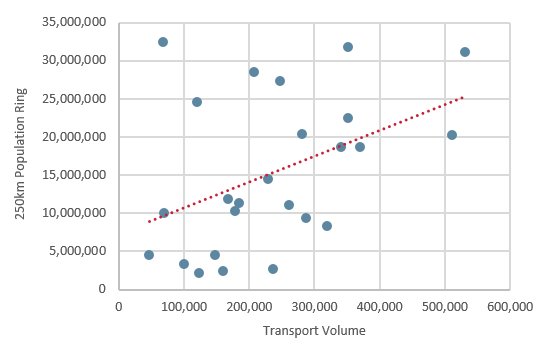
- On the other hand, as shown in the graph, there is a clear correlation between the population (250 km radius) and transport volumes.
- Not surprisingly, population size matters when we think of transport volumes. But, there are a number of smaller cities with higher than expected transport volumes. While some very large cities also have lower transport volumes than anticipated.
- In the end, it is clear that deliberate location selection is needed to ensure assets’ capacity to serve occupiers’ distribution needs.
City level transport volume and population
Sources: Green Street, AEW Research & Strategy
OCCUPIER MARKET
NEAR RECORD LOW VACANCY CONFIRMS COVID-19 RESILIENCE
- Despite the extraordinary circumstances with extended Covid-19 related lockdowns, European logistics take up across the 8 key continental markets achieved a record first quarter in 2021 after a robust 2020.
- The strong take up momentum has brought the vacancy rate down to 3.9%, very near to the 2018 low. This is well below the 5.3% average vacancy rate over the last ten years.
- To address the modern supply shortage, European logistics stock is expected to grow by 5.7% in 2021. This is slightly lower than the average annual stock growth since 2017.
- In fact, the 14m sqm increase in stock expected in 2021 represents less than 65% of actual take up in 2020. This is consistent with previous years and does not raise any concerns for the immediate future.
- Strong take-up is driven by logistics operators and retailers rolling out their omnichannel strategies, leading into increased demand for modern space, both in terms of XXL premises and urban logistics.
Annual logistics take-up* (‘000 sqm), vacancy rate and annual stock growth (%)
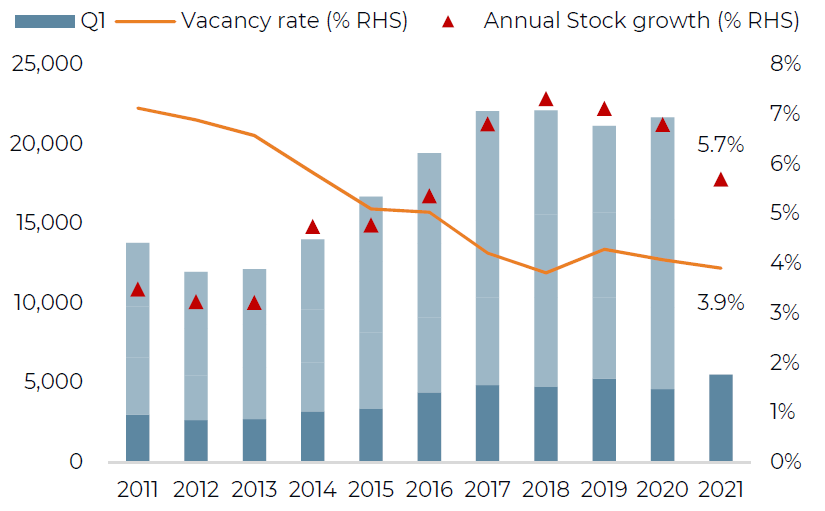
Sources: CBRE, AEW Research & Strategy; *8 markets: Belgium, Czech Rep., France, Germany, Italy, Netherlands, Poland, Spain.
LOW VACANCY & MODERATE DEVELOPMENT PIPELINES ACROSS MAIN MARKETS
- When we expand our scope from a regional level to include more individuals markets, some interesting observations can be made.
- Germany with a vacancy of near 2% and less than 5% of 2021 pipeline is not only the largest, but also one of the safest markets from a supply/demand perspective.
- France and Spain have relatively higher vacancy rates but these are expected to stabilize in future as the pipeline of new supply is below average.
- Across the largest markets, Poland, Netherlands and UK stand out as having relatively strong total development pipeline at above 6% of total existing stock.
- Despite ranking as the third largest market in continental Europe in terms of take up, Poland has both a high vacancy rate and significant pipeline. This suggests some challenges ahead.
Logistics vacancy and total pipeline (in % of stock)
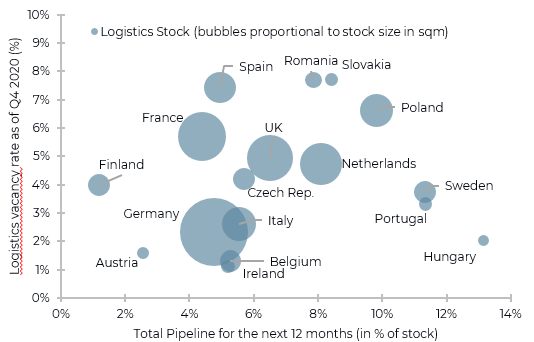
Sources: CBRE, AEW Research & Strategy
BUILT-TO-SUIT IS BIGGEST SHARE OF PIPELINE
- The logistics pipeline of new development in terms of sqm is mainly concentrated in established markets in Western Europe and Poland.
- Concerns for further increases in vacancy rates are tempered by the make-up of the future development pipeline.
- In that respect, the built-to-suit share is consistently larger than the speculative share, with Benelux having the highest speculative share.
- Most pipeline consists of built-to-suit developments, with c12 million sqm expected in 2021, a level similar to the new supply delivered in 2020.
- Speculative development has increased in response to the lack of modern supply and represents 30% of pipeline under construction for 2021, compared to 28% started as speculative in 2020.
Logistics vacancy and pipeline (in sqm)
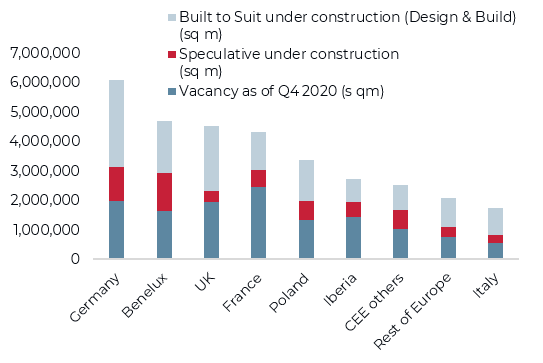
Sources: CBRE, AEW Research & Strategy
CAPITAL MARKETS
DESPITE COVID, LOGISTICS HITS NEW RECORD VOLUME SHARE
- Despite the Covid-19 lockdowns, logistics deal volumes for 2020 came in at Eur 37bn, nearly 5% up from 2019 levels.
- This was a solid result and testament to the strong investor appetite since the overall European market declined by about 30% over the same period.
- In fact, the logistics share of total deal volumes reached a new record of nearly 16%.
- Most portfolios and buildings are very competitively bid, with premiums being paid for larger portfolios – even of lower quality.
- This is one of the key reasons why yields have compressed consistently over the last 4-5 years.
2020 european investment volumes per sector (€bn)
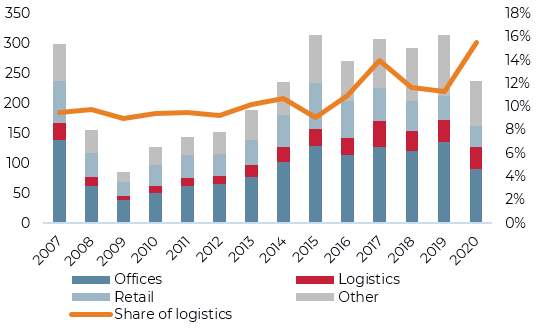
Sources: RCA, AEW Research & Strategy
LACK OF SUPPLY DRIVES FORWARD FUNDING ACTIVITY
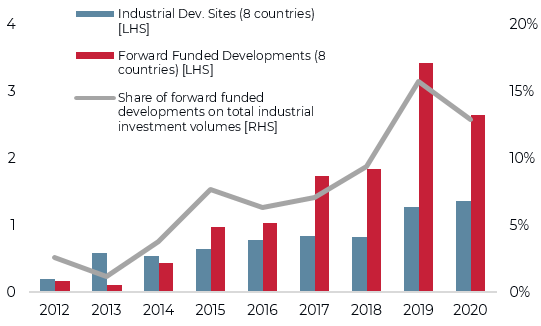
- Forward funding of new logistics development and acquisition of development sites has been increasing over the last four years.
- As an immediate impact from Covid-19 restrictions, there was a significant reduction in forward funding in 2020.
- This also triggered a reduction in the share of forward funding of overall investment volumes from 16% in 2019 to 13% in 2020.
- But with development site acquisitions still growing in 2020, it is reasonable to expect forward funding levels to come back in 2021.
- In the end, with modest current vacancy levels and the anticipated strength in demand for logistics space in the post-Covid economic recovery, our projections for solid rental growth are reinforced. Strong liquidity in the investment markets will continue to motivate developers to proceed with both build-to-suit and speculative projects.
Forward funding & land acquisition (Eur bn, constant price 2015)
Sources: RCA, AEW Research & Strategy
STILL SOME FURTHER YIELD COMPRESSION AHEAD
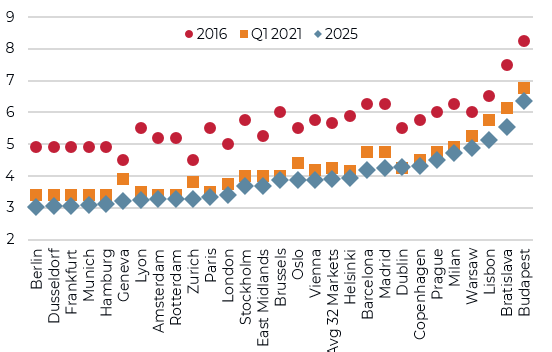
- Logistics yields have been on a remarkable decline, which is broadly expected to continue – albeit at a slower rate than before.
- Across our 32 logistics markets covered, yields compressed by a staggering 140 bps from 5.60% in 2016 to 4.20% as of Q1 2021.
- Given our lower for longer outlook for bond yields and the strong momentum in both the occupier and investor markets, further tightening is anticipated by approximately 30 bps to 3.90%.
- However, for individual markets compression varies widely from 70 bps for Geneva to none for Dublin over the next five years.
- It should be noted that these prime market averages might not always reflect the ultra keen bidding for individual deals.
- Ultimately, calling the bottom on property yields has proven a difficult task over the last 10 years – especially in logistics. For now, we continue to rely on our econometric modeling approach without subjective manual overrides.
Prime logistics yields (%)
Sources: CBRE, AEW Research & Strategy, April 2021 forecasts
LATEST MARKET FORECASTS
RENTAL GROWTH ESPECIALLY STRONG IN UK & FRANCE
- To reflect the uncertainty related to the future post-Covid recovery, we have used three different macro economic scenarios with different GDP growth and bond yields projections. These are more fully described in last month’s AEW mid-year 2021 Outlook report.
- Across our 33 logistics markets, prime rents are expected to grow by 1.7% pa in our base case. The downside and upside comes in at 1.6% and 2.0% offering a tight range.
- It should be noted that the actual recorded rental growth over the last five years was on average 2.2% per annum.
- Our more modest rental increase projection for the next five years reflects both the continuation of the sustained new development activity as well as the solid demand for space expected to continue in the post-Covid recovery.
- UK and French logistic rental growth stands out positively relative to the rest of Europe.
Logistics & li average prime rental growth by country (2021-2025, % pa)
Sources: CBRE, AEW Research & Strategy
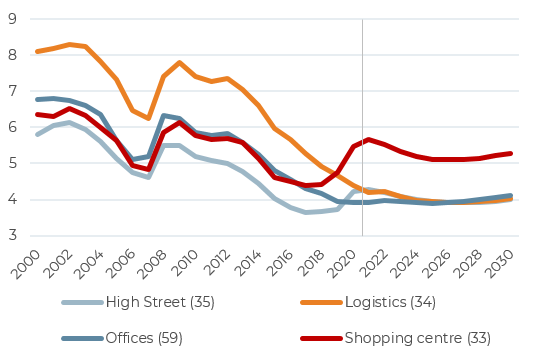
NEW RECORD LOW LOGISTICS YIELDS PROJECTED
- Since 2018, sector yields have moved apart. This was further amplified by the 2020 wide range of the pandemic’s impact per sector. Retail yields widened by a further 50-75 bps.
- Due to strong investors’ appetite and solid occupiers’ demand, prime logistics prime yields tightened further by 30 bps on average in 2020 despite the Covid-19 induced macroeconomic recession.
- For the coming years, we expect logistics yields to converge towards prime offices and actually come out just below after 2026.
- In our latest base case scenario, logistics as well as the other sectors are anticipated to benefit from the lower for longer government bond yields environment.
European average prime yields per sector (%)
Sources: CBRE, AEW Research & Strategy
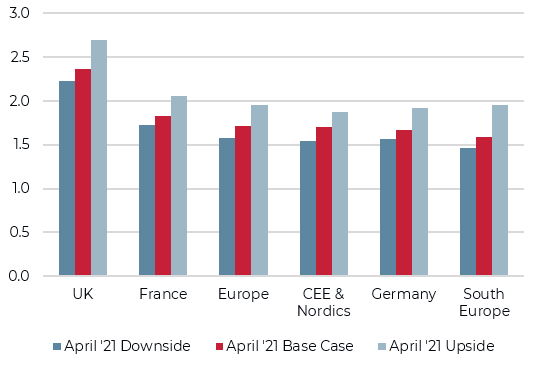
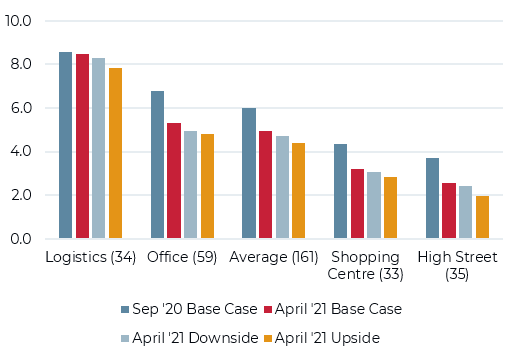
LOGISTICS RETURNS MOST RESILIENT IN POST-COVID OUTLOOK
- Our latest forecast of 8-9% pa prime logistics returns for the 2021-25 period prove most resilient to the impact of Covid-19 for all three scenarios consistent with its solid rental growth and tightening yield projections.
- Office returns were revised downward to 4-5% pa as the long term impact from WFH hits rental growth. Retail returns now range between 2-3% pa due to our more negative rental growth forecasts as e-commerce penetration stepped up significantly during the Covid-19 crisis and is not expected to reverse over the long term.
- Please note that our upside economic scenario produces more unfavorable returns compared to the other two scenarios.
- This is due to the fact that upside macro economic scenario has better GDP growth, but also assumes a normalization of government bond yields.
- The associated widening of property yields in future reduces capital returns to such an extent that it more than offsets the higher rental growth.
2021-25 annualized european average prime total returns by property type (%)
Sources: CBRE, AEW Research & Strategy, April 2021 forecasts
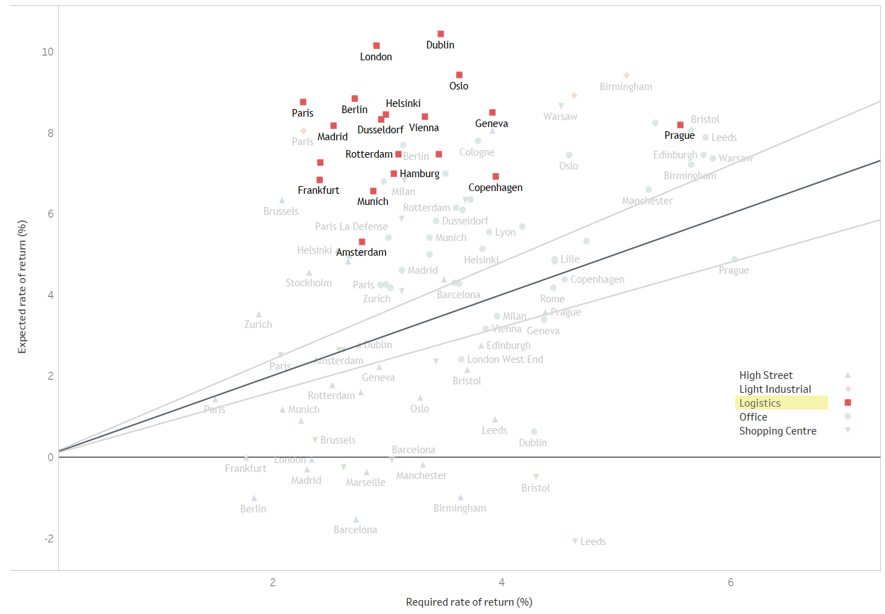
LOGISTICS IS THE CLEAR WINNER IN POST-COVID BIFURCATION
- European logistics markets stand out as most attractive in our base case results across our entire European universe of 106 markets.
- This classification is based on our risk-adjusted return approach, which compares each segments expected return to its required return. This approach is more fully described in last month’s AEW mid-year 2021 Outlook report.
- Our scatter graph can be read as follows: on the horizontal axis, we have the required rate of return (RRR) and on the vertical axis we have the expected rate of return (ERR) for the next five years. The grey lines indicate a range of 20% of the difference between the two, which we think is a good range where markets are not clearly over- or underpriced. In other words, markets within this middle range are labelled as neutral.
- The results indicate the strength of the logistics sector based on the factors discussed earlier. Large urban agglomerations such as London, Paris and Berlin are expected to be top performers in terms of risk-adjusted returns. Dublin benefits from Brexit.
- Except for Prague, most logistics markets have a relatively low required rate of return. Prague’s required rate of return is pushed by the risk-free rate and its elevated net depreciation.
- On the other hand, expected rate of return are higher. Rental income is driven by robust demand and low vacancy, while capital values should benefit from the compressing yields momentum.
Base case 2021-25 – Expected vs Required Rate of Returns
Sources: CBRE, RCA, INREV, Oxford Economics, OECD, AEW Research & Strategy
The information and opinions presented in this research piece have been prepared internally and/or obtained from sources which AEW believes to be reliable; however, AEW does not guarantee the accuracy, adequacy, or completeness of such information.