HOW TO RE-ALIGN IN A POST-COVID WORLD?
Despite successful vaccination programmes and economic support policies, Covid-19 continues to impact market sentiment. As the pandemic posts its latest resurgence, most European governments have been able to successfully limit its economic impact. The recovery has in fact been stronger than expected. As a result, Covid-19 linked supply chain problems and related raw material, energy, semi-conductor and labour shortages have triggered an uptick in inflation. Central banks need to balance the on-going recovery with their core task of meeting inflation targets more than before. Bond markets have started to price in an expected change to the recent accommodating monetary policy. This will offer a different environment for real estate as well, triggering the central question for our 2022 European Outlook “How can real estate investors best re-align their investment strategy in a post-Covid world?”
CPI Inflation (% PA)
Sources: Oxford Economics
EXECUTIVE SUMMARY:
•Since our mid-year review, the post-Covid rebound has surprised on the upside, as vaccinations and economic supports were successfully rolled out. However stronger than expected GDP growth combined with supply chain disruptions and associated shortages have triggered higher inflation.
•The danger of enduring above-target inflation poses a new policy dilemma for central banks, as they assumed inflation to be transitory before. However, investors have now priced in rate hikes and tapering. As a result, we consider the impact of a new inflation scenario besides our lower-for-longer base case.
•Across occupier markets, the logistics sector continues to benefit from the Covid-related increased e-commerce activity. Retail has been hurt by the same trend. Prime retail rents are starting to stabilise. Covid’s working-from-home spike reduced office take-up as occupiers are still uncertain about their long term real estate needs. Residential’s strong supply-demand fundamentals were confirmed during the crisis.
•Investment market volumes are recovering, led by logistics and residential. Yield compression continued in 2021 with logistics yields tightening to new record lows.
•Prime shopping centre yields widened by 120 bps since 2018. The Covid-related re-pricing did not differentiate between prime and average-quality. As a result, we expect prime yields to compress by 30 bps by 2026 to reflect the resilience of the best assets.
•Prime shopping centres are therefore projected to have the highest returns (7.4% pa) of any sector in the next five years, due to their attractive current yields and projected yield tightening. Prime logistics returns come in second place at 6.5% pa over the next five years.
•Despite adding a new climate-related transition risk premium, our risk-adjusted return approach shows an average positive excess spread of 220 bps for the 168 markets covered. By comparing the expected rate of return (ERR) with the required rate of return (RRR), we classify markets as attractive, neutral or less attractive.
•Prime shopping centres have now become our most attractive sector going forward. Since prime logistics yields have continued to tighten, fewer markets are now deemed attractive. Finally, our inflation scenario assumes higher bond and property yields, with a negative impact on total returns across all property types.
EUROPEAN AVERAGE PRIME TOTAL RETURNS BY PROPERTY TYPES (2022-26, %)
Sources: CBRE, AEW Research & Strategy
ECONOMIC BACKDROP – LEADING INDICATORS
Strong Recovery Triggers Inflation Concerns
- As vaccinations and economic supports were successfully rolled out, economic growth has been surprising on the upside.
- Therefore, in our current base case we assumed a strong 5.1% GDP growth for 2021 followed by 4.8% in 2022, across our 20 European countries. This is well-above the 3.6% and 3.4% economic growth assumed in our previous base case.
- Covid-19 related disruptions in global supply chains combined with this stronger than expected recovery in consumer demand has led to shortages in raw materials, components and labour. This has triggered concerns about inflation not being transitionary, as previously assumed. §As a result, our inflation scenario accounts for a slightly stronger recovery showing 5.4% GDP growth in 2021 and 5.6% in 2022 over our 20 European countries universe. More importantly, it also assumes 2.4% and 2.6% inflation in 2021-22, higher than the 2.2% and 1.8% in our current base case.
EUROPEAN GDP INDEX (% per annum)
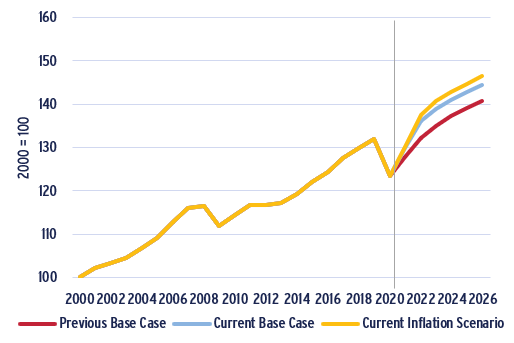
Sources: Fred St Louis, Oxford Economics and AEW Research & Strategy
WORST IMPACTED SPENDING TO RECOVER MOST
- The Covid-19 lockdowns impacted most severely consumer spending at restaurants and entertainment.
- Grocery stores were the only retail segment that actually showed an increase in sales during the pandemic.
- After 2022, Oxford Economics projects a return to the long term pre-Covid trend growth across the various retail segments.
- This means that sales are expected to see the strongest rebound in the worst impacted sectors while grocery store sales are forecast to return to a stable but lower growth.
- E-commerce penetration rates have normalised since the end of the lockdowns at higher levels than pre-Covid, at 14% on average in Europe, but ranging from 24% in the UK to 6% in Italy. On-demand grocery - with the fast development of operators such as Gorillas or Zapp - is driving growth in online grocery sales, although penetration rates remain low.
EUROZONE CONSUMPTION – INDEXED BY RETAIL SEGMENT (2010 = 100)
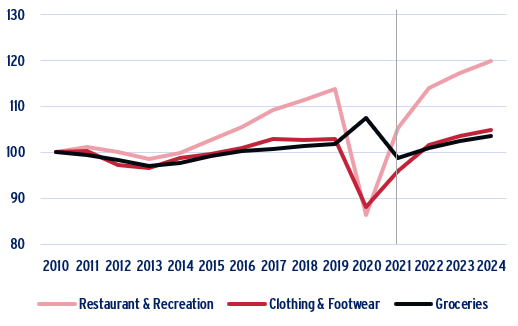
Sources: Oxford Economics and AEW Research & Strategy
GOVERNMENT SUPPPORTS LIMITED UNEMPLOYMENT
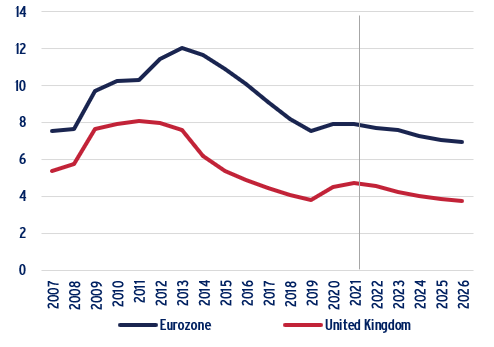
- Despite the Covid-related recession of 2020-21, Eurozone unemployment stands at 7.4% as of October 2021. This level is expected to come down further to 6.9% by 2026. UK unemployment is expected to remain consistently lower.
- It is clear that government support schemes have worked well in limiting unemployment. Even to the extent that some labour shortages have now emerged as a threat to overall economic recovery in sectors such as construction and transportation.
- To promote labour market efficiency, governments might need to consider technical skills training and easier inward migration to improve the re-allocation and participation rates of workers.
- Whilst labour shortages along with rising inflation translate into upward pressure on some wages, wage growth pressures remain moderate at present. Overall unemployment levels and spare capacity in the economy will also limit wage growth in the future.
UNEMPLOYMENT RATES (%)
Sources: Oxford Economics and AEW Research & Strategy
ECONOMIC BACKDROP – INFLATION & BOND YIELDS
ELEVATED INFLATION RAISES CONCERNS
- Despite Chinese and US growth leading the way, European GDP and retail sales have been rebounding strongly, albeit from a low 2020 base.
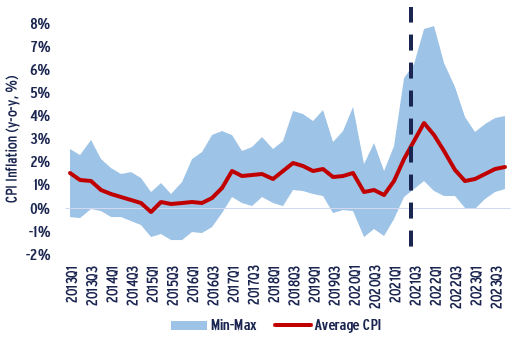
- Due to lingering Covid-related disruptions in global supply chains and shortages, inflation has been above 2% - the ECB’s target.
- This is still moderate when compared to US and UK levels, which stand closer to 6% and 4%, respectively.
- Average CPI across our 19 countries will peak at just below 4% by year-end 2021. But, there are some CEE countries showing much higher inflation, as indicated by the min-max range.
- Regardless of the current level, many investors are questioning the consensus outlook for lower-for-longer interest rates.
- The ECB followed the Fed by re-stating its inflation target to a longer horizon, somewhat reducing market concerns of a rate hike in the short term.
AVERAGE CONSUMER PRICE INDEX (CPI) WITH MIN-MAX RANGE FOR 19 EUROPEAN COUNTRIES FOR 2013-2033
Sources: Fred St Louis, Oxford Economics and AEW Research & Strategy
INFLATION OUTLOOK FINELY BALANCED
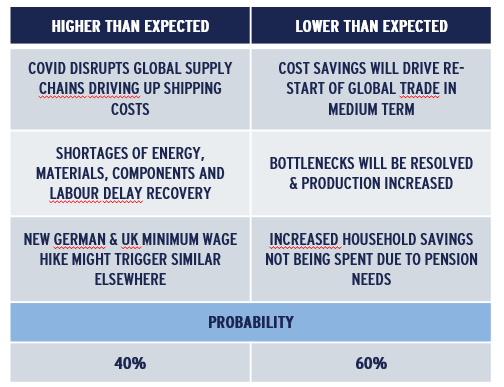
- In Q3 2021 there has been much debate about the drivers of inflation, with much focus on the current news flow of supply chain disruptions and shipping and energy costs.
- However, there are still some solid reasons why inflation in the medium term will come down and remain moderate.
- In the long term, global trade reduces costs for consumer goods and once resumed should bring down inflation.
- An elevated output gap in most European economies should allow for increased production once bottlenecks are resolved.
- Inflation will be higher for longer only if wage growth accelerates. While this is not the case at present, the newly-formed coalition led by the SPD in Germany has pledged to increase the minimum wage from to €9.60/hour to €12.00/hour.
- Finally, Europe’s ageing populations will not directly spend any increased earnings as their required pension saving will keep the velocity of increased money supply at modest levels.
- Based on these we assume that the probability of a prolonged period of high inflation is currently 40%.
Sources: Fred St Louis, Oxford Economics and AEW Research & Strategy
INFLATION MIGHT SCUPPER LOWER FOR LONGER
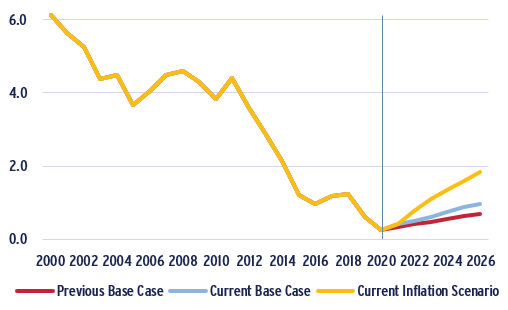
- For our base case, we continue to use the swap-implied government bond yields since swap investors price these instruments incorporating all available data on possible macroeconomic and policy scenarios.
- Given that macro economic forecasts have consistently mistimed the expected normalisation of bond yields over the last 10-12 years, we have preferred actual swap prices so far.
- But, compared to our previous base case, the swap market has priced in already a slight step up of future bond yield widening.
- In our property market modelling, this assumption of lower for longer or normalised government bond yields plays a central role in future property yields and capital values regardless of changes to income return.
10YR GOVERNMENT BOND YIELDS (%, EUROPEAN AVERAGE ACROSS 20 COUNTRIES)
Sources: OECD, Oxford Economics, Bloomberg, Chatham Financial and AEW Research & Strategy
MARKET OVERVIEW – LOGISTICS & OFFICES
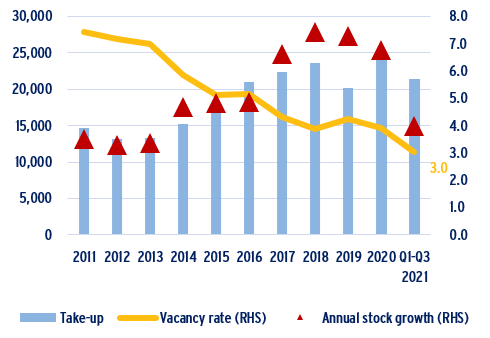
RECORD LOW VACANCY CONFIRMS LOGISTICS RESILIENCE
- Despite the extended Covid-19 related lockdowns, European logistics take-up across the eight key European markets achieved a record year-to-date 2021 after a robust 2020.
- This strong take-up momentum has brought the vacancy rate down to 3.0%, a record low. This is well below the 5.0% average vacancy rate over the last ten years.
- To address the supply shortage of modern space, European logistics stock is projected to grow by 5.7% in 2021. This is lower than the average annual stock growth since 2017.
- In fact, the 14m sqm increase in stock expected in 2021 represents less than 65% of actual take up in 2020. This is consistent with previous years.
- Strong take-up is driven by logistics operators and retailers rolling out their omnichannel strategies, leading to increased demand for modern XXL premises and urban logistics.
EUROPEAN ANNUAL LOGISTICS TAKE-UP (‘000 SQM), VANANCY RATE & ANNUAL STOCK GROWTH (%)
Sources: CBRE ERIX, BNP RE, JLL, AEW Research & Strategy
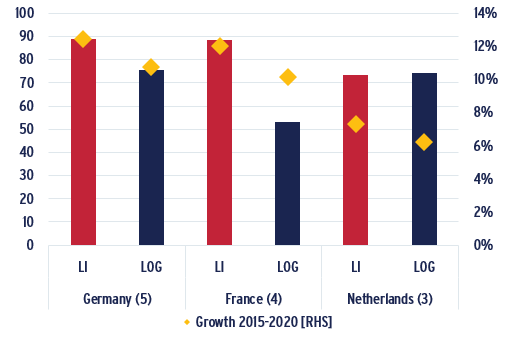
LIGHT INDUSTRIAL RENTS AHEAD OF LOGISTICS’
- Prime rents for light industrial have been higher than logistics, as light industrial buildings are generally smaller with a higher office component and located in denser urban areas where there is intense competition from other uses.
- Light industrial average prime rents stands at €89/sqm/pa in France and Germany and at €73/sqm/pa in the Netherlands.
- For both Germany and France, light industrial rents are ahead of logistics rents, with Netherlands being the notable exception.
- The larger gap between light industrial and logistics rents recorded in France when compared to other countries might be explained by its overall lower urban density on a national level allowing for lower logistics rents.
- Prime rental growth recorded in Germany and France between 2015 and 2020 reached 12% for light industrial and 11% for logistics. In the Netherlands, prime rental growth was 7% for light industrial and 6% for logistics, which is stronger than most sectors.
LIGHT INDUSTRIAL VS LOGISTICS PRIME RENT (EUR PER SQM) Q2 2020
Sources: CBRE ERIX, BNP RE, JLL, AEW Research & Strategy
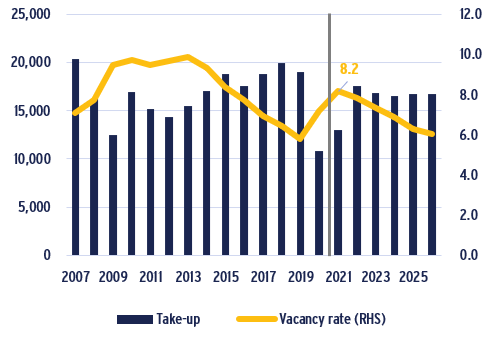
WORKING FROM HOME DRIVES OFFICE TAKE-UP IN SHORT TERM
- During the pandemic, the share of office employees working (sometimes or usually) from home (WFH) more than doubled, from 28% in 2018 to 67% in July 2020 across the EU 27 region.
- The immediate impact was a 40% reduction in office take-up from 2019 to 2020 and a projected increase in vacancy to 8.2% for year-end 2021 from the record low of 5.8% as of year-end 2019.
- Long term WFH impact on office space demand will be muted, as employees will still be attending the office half the time.
- Space needs will only reduce by 5% over the next six years -- less than 1% p.a.. As office stock is also expected to grow by an average of only 1.1% over the next five years, this pushes vacancy down in our forecasts.
- Our assessment of local market resilience taking into account cost efficiencies and demand elasticity shows the strength for regional core markets like Marseille, Vienna and Copenhagen and weakness for most CEE markets.
EUROPEAN ANNUAL OFFICE TAKE-UP ('000 SQM) & VACANCY RATE (%)
Sources: CBRE, Eurofound, Eurostat, IRIX and AEW Research & Strategy
MARKET OVERVIEW – OFFICES & RETAIL
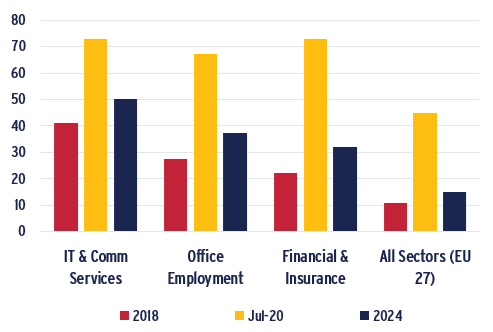
POST-COVID WORKING FROM HOME TREND TO MODERATE
- Working from home is not a new Covid-19 phenomenon. Already in 2018, 28% of EU-27 office-based employees worked sometimes or usually from home.
- This is based on actual WFH data for government (11%), IT (41%), financial (22%) and other business services (35%) and their assumed share in the office employment mix.
- The Covid-19 impact on WFH is shown by the July 2020 EU-27 level of 67%, up nearly 40% from pre-Covid levels. The range across sub-sectors was between 55% for other business services and 73% for IT and financial services.
- As vaccination roll-outs progress we expect a return to pre-Covid sub-sector variations as well as an increase in the share of WFH for office employment to 37% in 2024.
WORKING FROM HOME (WFH) LONG-TERM TRENDS & 2020 COVID IMPACT PER OFFICE EMPLOYMENT SECTOR FOR EU27
Sources: CBRE, Eurofound, Eurostat, IRIX and AEW Research & Strategy
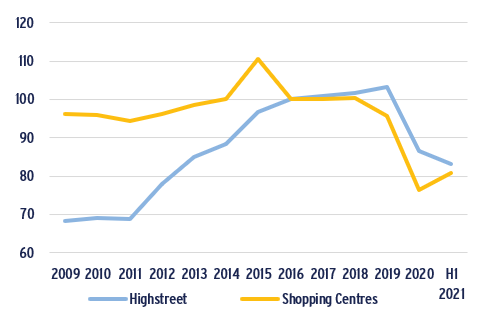
PRIME RETAIL RENTS STARTING TO STABILISE
- European high street retail posted 9% pa rental growth with 4% for shopping centers, in 2012-15, ahead of offices and logistics.
- After 2018, prime shopping centre rental growth turned negative as they were hit harder by the growing share of online sales, as most retailers shifted from quantity to quality of outlets.
- As a result, many retailers opened or expanded (flagship) stores in central locations, supporting prime high street rental growth, albeit at a slower pace.
- Covid-19 lockdowns and closings hit 2020 prime rents hard for both high street retail (-16%) and shopping centers (-20%).
- Many retailers' revenues dropped in 2020 with many forced to “rightsize” their store footprints and some going out of business.
- As the Covid-19 crisis is resolved, we expect re-openings to improve cash rent collections, a revival of credit quality amongst tenants and a stabilisation of prime headline rents.
PRIME RENTAL GROWTH FOR HIGH STREET RETAIL & SHOPPING CENTRES – EUROPEAN AVERAGE (7 COUNTRIES, INDEX 100 = 2016)
Sources: CBRE ERIX, RCA and AEW Research & Strategy
UK CENTRE CONVERSIONS SHOW THE WAY FORWARD
- In the UK, the share of shopping center acquisitions for the purpose of conversion, redevelopment and renovation has recently exceeded the Continental European average.
- The higher and more stable share of conversion and redevelopment deals in Europe up to 2018 shows investors’ commitment to update existing centers compared to the UK.
- More attractive secondary UK yields have triggered this increase in conversions. This shows that distressed pricing does offer attractive opportunities to investors who are able to make these changes.
- It is unlikely that all these transactions are focused on a complete change of use to residential, urban logistics or offices. But innovative owners will likely look to reduce the existing retail component and create attractive mixed-use places.
NUMBER OF SHOPPING CENTRES DEALS WITH THE OBJECTIVE OF CONVERSIONS, REDEVELOPMENT & RENOVATIONS (% OF SC DEALS)

Sources: CBRE ERIX, RCA and AEW Research & Strategy
MARKET OVERVIEW – RESIDENTIAL & RENTAL GROWTH
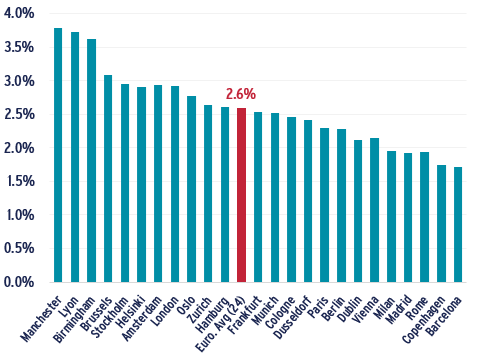
RESIDENTIAL RENTAL GROWTH EXPECTED AT 2.6%
- After assessing the demand and supply balance in the market, we present our first pan-European prime residential rental projections. Our forecasts focus on new-built apartments which are exempt of rent control mechanisms in most markets.
- Prime residential rental growth is expected at 2.6% p.a. on average between 2022 and 2026 . This is stronger than our base case inflation (1.8% p.a.). However, it is a bit lower than the 3.5% p.a. on average over the past five years.
- The regional cities Manchester, Lyon and Birmingham are expecting to outperform in percentage growth terms, as absolute rental levels are typically lower than in capital cities.
- In contrast, Southern European cities are forecast to underperform in comparison to the European average, as a result of weaker demographic growth.
PRIME RESIDENTIAL RENTAL GROWTH (% PA) – 2022-2026
Sources: OECD, Catella and AEW Research & Strategy
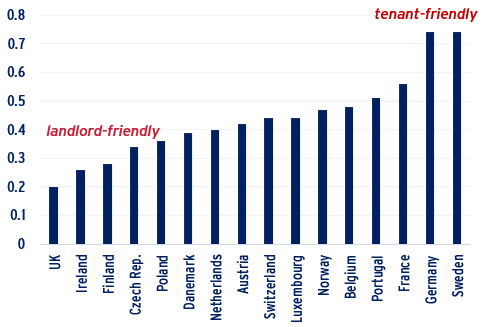
TENANT-FRIENDLINESS DOES NOT REPEL INVESTORS
- European residential markets vary widely in terms of rental regulations. The OECD index indicates which markets are the most landlord-friendly – the UK & Ireland– and the most tenant-friendly – Sweden & Germany.
- Tenant-friendly countries typically have lower tenant turnover and therefore much more secure and predictable income streams for investors.
- As a result, rental regulations are not a risk per se, as long as initial pricing takes the regulation into account. This explains why Sweden and Germany are also the largest residential institutional investment markets, despite being the most tenant-friendly.
- But affordability concerns across Europe are keeping housing policy high on the political agenda and rental regulation needs to be carefully monitored to anticipate changes.
RESIDENTIAL REGULATION INDEX
Sources: OECD, Catella and AEW Research & Strategy
SOLID RESIDENTIAL & LOGISTICS RENTS POST- COVID
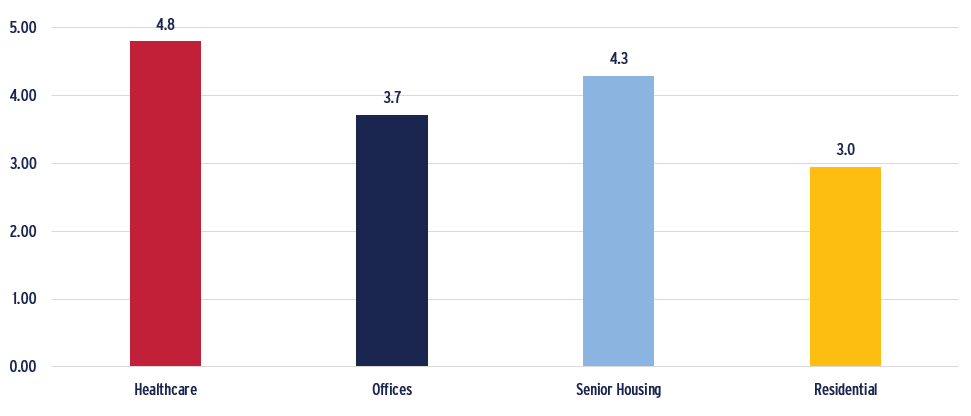
- Based on our macro economic scenarios and the latest market data, our revised rental growth forecasts highlight residential and logistics as the most resilient sector for prime rental growth.
- Despite an improvement in our forecasted logistics rents at 2.2% p.a., our newly covered residential market rents take the top spot with 2.6% annual increase over the next five years.
- With the boom of e-commerce sales expected to last, our current forecasts remain in line with our mid-year update and reach above 1.5% for our two current scenarios.
- With the retail sector hit worse than expected in 2020-21, our 5-year rental growth forecasts still show negative rental growth in 2022 for both high street retail and shopping centres.
- However, widespread lease re-negotiations should lead to more sustainable rent agreements and facilitate the sector’s structural adaptation post-Covid.
EUROPEAN AVERAGE PRIME RENTAL GROWTH BY PROPERTY TYPE OVER THE NEXT 5 YEARS (22-26, %)
Sources: CBRE and AEW Research & Strategy
MARKET OVERVIEW – VOLUMES, YIELDS & RETURNS
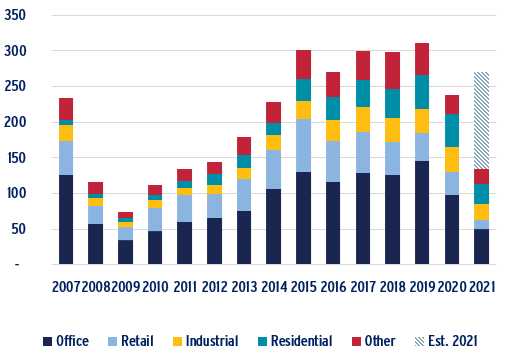
VOLUMES REBOUND LED BY LOGISTICS & RESIDENTIAL
- The latest RCA data shows year-to-date (YTD) 2021 volumes up by 8% versus the same period last year. This is after a 23% decline in 2020 compared to 2019.
- A strong 30% year-on-year increase in 3Q21 volumes of EUR 62bn confirms our expectations that volumes will come in at around EUR 368bn for 2021.
- Across sectors, 2021 YTD investment volumes were up for logistics (87%) and residential (37%) but down for retail (-49%) and offices (-27%) when compared to their respective 2015-19 pre-Covid averages.
- Amongst country leaders, Denmark, Sweden and Norway have already exceeded their pre-Covid average annual volumes.
- Laggards include Belgium, Netherlands, Austria and Finland still between 53% and 25% below their pre-Covid average deal volumes.
EUROPEAN ANNUAL INVESTMENT VOLUMES BY PROPERTY TYPE (€BN)
Sources: RCA and AEW Research & Strategy
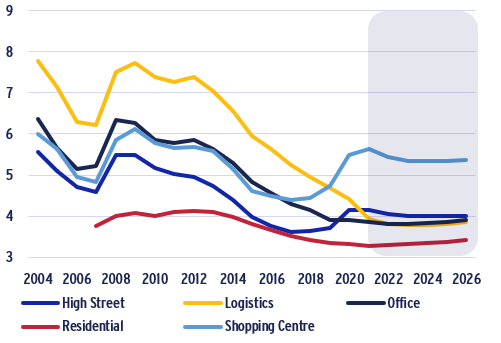
RETAIL YIELDS TO TIGHTEN AFTER RE-PRICING
- Yields moved apart for different property types in 2021 as the segments were impacted to various degrees by the pandemic.
- Logistics prime yields tightened further by 50 bps on average in 2021 despite the recession, while prime office yields remained stable at 3.9% on average.
- On the other hand, Covid amplified the already on-going yield widening for shopping centres by a further 15 bps on average. Since 2018, prime shopping centre yields have widened by over 120 bps with high street retail at over 50 bps.
- This significant re-pricing in retail recorded over the last three years did not take into account the difference in quality between prime and secondary assets. We expect prime retail yields to compress by 15 to 30 bps in the next five years to reflect the resilience of the best retail locations and formats post-Covid.
- The residential and office sectors are projected to see some minor yields widening over the next five years at 15 bps and 5 bps respectively. Logistics is projected to have just over 5 bps further tightening over the same period.
EUROPEAN AVERAGE PRIME YIELDS BY PROPERTY SECTOR (%)
Sources: OECD, Catella and AEW Research & Strategy
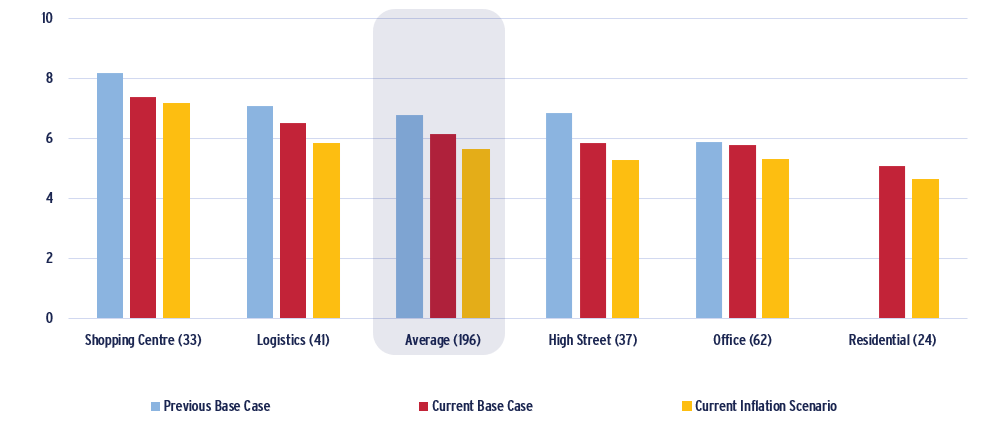
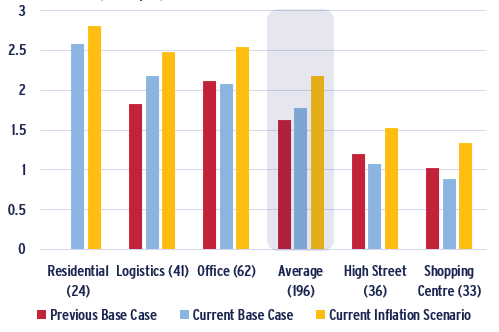
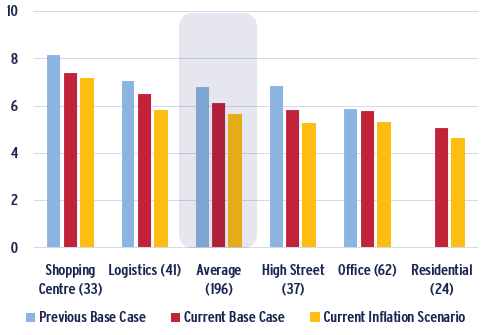
INFLATION UNFAVOURABLE FOR PROPERTY RETURNS
- Due to their attractive current yields and projected tightening, shopping centres are projected to have a 7.4% p.a. average return in the next five years -- the highest returns of any of our covered sectors.
- Prime logistics returns at 6.5% p.a. remain strong and are now driven by rental growth more than by yield compression.
- Office returns incorporate the long term impact from WFH on rental growth as well as the expected future yield widening.
- It should be noted that our total return calculation is now based on current prime market rents and no longer considers the longer term historical rents for each sector, favouring sectors with significant rent decline in recent years.
- Our inflation scenario produces unfavourable returns compared to the base case scenario, mostly due to the associated widening of yields as discussed above.
EUROPEAN AVERAGE PRIME TOTAL RETURNS BY PROPERTY TYPES (2022-26, %)
Sources: CBRE and AEW Research & Strategy
RELATIVE VALUE ANALYSIS
CLIMATE RISK DOES NOT REDUCE ATTRACTIVENESS
- Our risk-adjusted return approach is based on a comparison between the required rate of return (RRR) and the expected rate of return (ERR) over the next five years.
- Our graph shows that the RRR, based on our 168 European markets’ average stands at 345 bps while the ERR is 565 bps. On average, the ERR has a positive excess spread of 220 bps over the RRR up from 134 bps in our mid-year outlook.
- The liquidity premium and net depreciation are the largest component of the RRR while the risk-free rate (capped at zero for negative rates) and volatility premia have the lowest share.
- For the first time, we add a transition premium to the RRR based on our city and sector-specific assessment of climate-related transition risk as more fully explained in our May-21 report.
- By comparing the expected rate of return (ERR) with the required rate of return (RRR), we classify markets as attractive, neutral or less attractive.
REQUIRED (RRR) VS EXPECTED RATE OF RETURN (ERR) INCLUDING CLIMATE TRANSITION RISK PREMIUM – ALL PROPERTY TYPES

Sources: CBRE, RCA, INREV, Oxford Economics, OECD, CRREM, AEW Research & Strategy
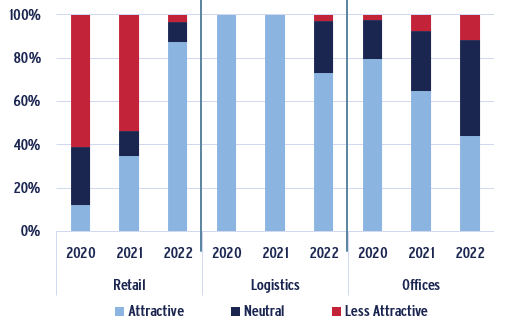
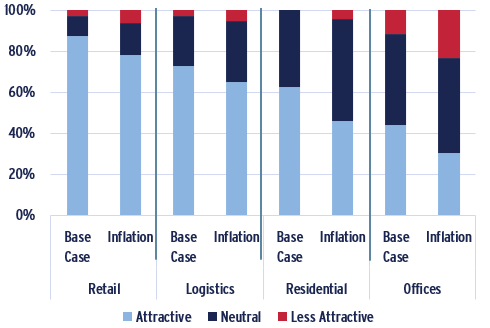
RETAIL STANDS OUT AS MOST IMPROVED SECTOR
- Since we have now done this analysis for three years, we consider the sector-level results across Europe in our base case over time.
- Due to its projected yield tightening in the next few years, prime retail has now become the most attractive sector. 56 of 64 covered markets are deemed attractive based on our methodology.
- As prime logistics yields have continued tightening in the last three years, not all logistics markets remain attractive in our latest assessment. 27 of 37 markets covered are classified as attractive, so there is still plenty to choose from.
- Finally, the office sector is impacted as more markets are classified as neutral. This is due to the impact of WFH on rental growth expectations on several markets. Regardless, 19 office markets of the 43 covered remain attractive despite this negative WFH impact.
% SECTOR MARKETS BY ATTRACTIVENESS (CURRENT VS PREVIOUS YEARS’ BASE CASE SCENARIOS)
Sources: CBRE, RCA, INREV, Oxford Economics, OECD, CRREM, AEW Research & Strategy
INFLATION SCENARIO HURTS RESIDENTIAL MOST
- If we then consider the difference between our base case scenario and inflation scenario, we notice that the impacts are evenly distributed across the sectors.
- Overall, our inflation scenario assumes higher bond and property yields which are only partially offset by stronger economic and rental growth.
- Indeed, yield movements, especially in the current low interest rate environment, have more substantial impacts on capital values and total returns than changes in GDP and rental growth.
- With the lowest yields of any sector to begin with, it seems unsurprising that residential is impacted most by the inflation scenario’s yield widening.
% SECTOR MARKETS BY ATTRACTIVENESS (CURRENT BASE CASE & INFLATION SCENARIO)
Sources: CBRE, RCA, INREV, Oxford Economics, OECD, CRREM, AEW Research & Strategy
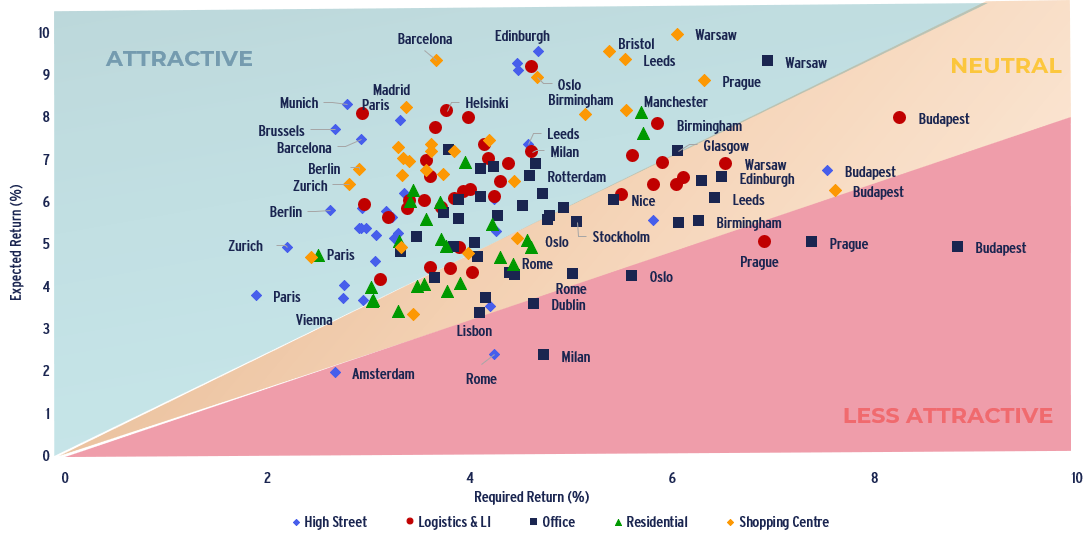
RELATIVE VALUE ANALYSIS (BASE CASE)
- The below scatter graph can be interpreted as follows: the required rate of return (RRR) is represented on the horizontal axis and the expected rate of return (ERR) for the next five years is represented on the vertical axis.
- Markets in the green area show ERR sufficiently in excess of the RRR as attractive. The red zone markets are classified as less attractive, given their ERR does not meet the RRR.
- The yellow background indicates a range of 20% of the difference between the two, which is deemed an appropriate range where markets are not clearly over- or underpriced. As a result, markets within this middle yellow range are labelled as neutral.
- When considering our base case chart we note first of all an increased number of classified markets. Our expanded universe of 168 markets (compared to 106 in 2021) is mostly due to inclusion of 24 residential markets.
- The scatter chart indicates the strength of the shopping centre and logistics sectors along with a number of high street retail markets, whilst the most less attractive markets are in the office sector and some remaining individual high street retail markets.
- Spanish and regional UK shopping centre markets stand out among the top performers in terms of risk-adjusted returns while Paris logistics also continues to be attractive.
- Finally, the mixed picture for offices continues as WFH affects markets differently whereby CEE and Italian markets seem to be less resilient than the larger gateway cities, a result broadly in line with our WFH March special report.
BASE CASE 2022-26 – EXPECTED VS REQUIRED RATE OF RETURNS
Sources: RCA, INREV EPRA and AEW Research & Strategy
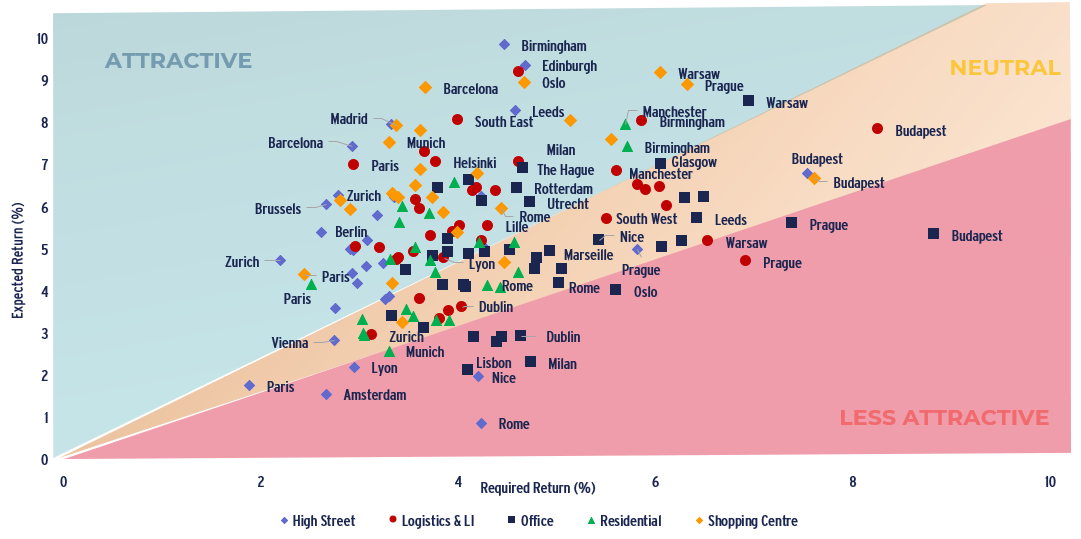
RELATIVE VALUE ANALYSIS (INFLATION SCENARIO)
- When considering our inflation scenario results, the scatter chart indicates the enduring strength of most shopping centre, high street retail and logistics sectors, compared to the base case on the previous page.
- More office and high street retail markets slip into the less attractive classification.
- Spanish and regional UK shopping centre markets continue to stand out among the top performers in terms of risk-adjusted returns when compared to the base case.
- Finally, the mixed picture for offices becomes more pronounced as yield widening affects CEE and Italian markets most.
INFLATION SCENARIO 2022-26 – EXPECTED VS REQUIRED RATE OF RETURNS
Sources: RCA, INREV EPRA and AEW Research & Strategy
