To date, 2025 has been marked by two distinct but related developments: slowing economic growth, as evidenced by weaker Q1 GDP growth, even when excluding the pull-forward effects of accelerated imports1, and rapidly rising economic and political policy uncertainty; specifically, policies related to tariffs and trade but also those covering areas such as federal government employment, research funding, taxes and immigration. Although new, higher U.S. tariff rates by country and product were not announced until after the end of the first quarter (April 2, aka “Liberation Day”); policy uncertainty during the first quarter had already risen to levels last seen during prior significant economic and political crises such as the period immediately following the September 11th terrorist attacks (2001); the onset of the global financial crisis (2009); and the outbreak of the COVID-19 pandemic (2020).
FIGURE 1: ECONOMIC POLICY UNCERTAINTY INDEX FOR UNITED STATES

Source: FRED, Baker, Scott R.; Bloom, Nick; Davis, Stephen J. via FRED. As of April 2025.
While other “hard” economic data such as employment and retail sales do not yet fully reflect impacts from changing and uncertain government policy, “soft” data such as consumer and CEO sentiment do. For example, the Conference Board survey of consumer confidence recently noted that “consumer confidence declined for a fifth consecutive month in April, falling to levels not seen since the onset of the COVID pandemic”2. Similarly, the most recent University of Michigan Survey of Consumers found a comparable decline in overall sentiment and, more specifically, recorded the largest share of consumers since the Global Financial Crisis who believe that unemployment will be higher over the next year, typically a harbinger of weaker consumer spending and overall economic growth.
FIGURE 2: SHARE OF CONSUMERS THAT EXPECTED HIGHER UNEMPLOYMENT OVER NEXT YEAR

Source: University of Michigan Surveys of Consumer. As of March 2025.
Survey data on sentiment is not a perfect predictor of future economic performance, but the abrupt change in sentiment is concerning. The U.S. economy remains consumption centric. Tariffs are a form of tax, specifically a tax on the consumption of goods produced outside of the country. Consumption-based taxes are typically regressive, disproportionately impacting lower income consumers. Tariffs, however, also touch many discretionary items (e.g., French wine or German automobiles). Economics teaches that if you tax something, you will get less of it. Thus, higher tariffs beget less consumption and, in a consumption-oriented economy, lower aggregate growth.
Not surprisingly, the higher base tariffs announced in April, even with the 90-day pause in the so-called reciprocal tariffs, combined with broader uncertainty about a range of additional policy areas, has led many macroeconomic forecasting groups to raise their probability of near-term recession. Looming tariffs have also complicated the Federal Reserve’s recent decisions regarding when and how much to lower policy interest rates. To this point, in the press conference following the most recent meeting of the Federal Open Market Committee (FOMC), Fed Chair Jerome Powell responded to numerous questions with some mention of federal government policy uncertainty.
“Forecasting right now, it’s—you know, forecasting is always very, very hard. And in the current situation, I just think it’s—uncertainty is remarkably high.”
Federal Reserve Chair Jerome Powell, March 19, 2025
Reflecting the Chairman’s statements, the Federal Reserve appears unlikely to make any significant changes to monetary policy until there is greater clarity of the impact that tariffs (and other recent changes in federal government policies) have on the economy generally and on future inflation. As such, we continue to expect the overall yield environment to remain elevated relative to what we had expected during the last quarter of 2024.
Hard data tracking the fundamentals of the economy remains in line with recent periods, with forward-looking surveys far weaker. For example, the April employment report showed a greater than expected increase in U.S. total employment, consistent with the growth recorded over the past year. Any direct employment impacts from the new higher tariffs would likely manifest with some degree of time lag reflecting the slowdown in new orders for now higher priced goods, the expected shipping time from point of origin to destination, the expected transit time from port of entry to store shelves and so on. Absent a meaningful change in the new tariff regime, we anticipate any direct employment impacts in logistics and retailers are likely to begin showing up in the data over the summer and into the fall.
Still, expectations can change as policy evolves. For now, AEW Research is not assuming near-term economic recession as our base case outlook, but we are certainly risk aware. Regardless of whether the broader economy slips into a period of outright economic contraction (i.e., a recession), we are concerned that near-term demand for specific property sectors could be constrained by the pernicious impacts of tariffs and other current policy initiatives.
FIGURE 3: YEAR-OVER-YEAR GROWTH IN U.S. TOTAL EMPLOYMENT SOURCE: BUREAU OF LABOR STATISTICS

Source: Bureau of Labor Statistics
Commercial Property Outlook
Despite these developments, our overall narrative for the near-term outlook for U.S. commercial property remains largely unchanged. Commercial property values declined over the two-year period from mid-2022 to mid-2024. This was the first time in the past 50 years where property values recorded sustained decline absent an economic recession. Rather, nearly all the change in value over this period reflected a commensurate change in investors’ required yield as the Federal Reserve dramatically raised interest rates to stem unexpected, outsized inflation. Over the next few years, we do not believe investors can underwrite meaningful decline in yields in most cases but must look instead to property income growth to drive valuations.
Higher tariffs and other disruptive federal government policy implementation do not change this but do narrow the potential opportunity set of markets and property sectors where investors may look for property income growth. While there has been no cyclical (i.e., recessionary) decline in property market fundamentals (i.e., occupancy rates, rental rates, etc.), there are sectors where excess new supply, triggered by the surge in property values in 2012 and 2022, has caused localized increases in vacancies and softening of rents, primarily in certain apartment growth markets and major industrial property hubs. As excess supply is absorbed, there will be targeted markets/property sectors where higher near-term expected rent and income growth may be expected.
Additionally, the seniors housing sector is both better insulated from the economic vagaries of tariffs and is also experiencing conditions comparable to cyclical recovery. Not surprisingly, our own projections as well as those from third-party sources indicate significantly stronger near-term property net operating income (NOI growth) in the seniors housing relative to other major property sectors.
FIGURE 4: EXPECTED AVERAGE ANNUAL GROWTH IN SAME STORE NOI BY PROPERTY SECTOR 2025-2029

Source: Green Street, 2025 Q1 Preliminary Forecast
For other property sectors, the anticipated impact of tariffs is varied. The obvious primary concern is centered on potential reduction in aggregate global trade flow and the ultimate impact of any slowdown this may have on demand in U.S. distribution centers and large port-oriented warehouse markets such as the industrial property markets of Southern California or Northern New Jersey (and others). Additionally, higher costs of goods resulting from tariffs will impact many retailers and, by extension, retail properties to some degree but seem likely to have a greater impact on discretionary consumer spending, at least in the near term. Generally, necessity economic activities are more likely to protect against the vagaries of policy uncertainty. For example, grocery-anchored retail should shoulder the impact of rising cost of goods better than other, more discretionary retail activities.
In addition to tariff and trade policy specifically, we are also mindful of the potential economic and property market impacts of policy changes and federal government actions including:
- Capricious, large scale and abrupt job cuts across wide swaths of the federal government workforce, with greater geographic impacts in areas of high federal government job concentrations such as suburban Maryland and Northern Virginia
- The freezing or elimination of previously approved federal funding of academic and scientific research, typically concentrated in and around college and university clusters with potential negative impacts to education/research/life science centers such as Boston or San Diego
- Generalized disruption of foreign student visa programs and other actions likely to discourage and decrease foreign student applications to colleges and universities with potential negative impacts for local economies with greater concentrations of universities with higher shares of foreign students such as Boston and Chicago
The folk singer Arlo Guthrie once remarked that “you can’t have a light without a dark to stick it in,” and there is a light for commercial property related to the darker demand-side uncertainty stemming from the new tariff regime. While tariffs and greater economic and political uncertainty may contribute to slower near-term economic growth and, consequently, property demand, it will also hasten the slowdown in new property construction (supply growth) in most markets. Across all major U.S. property sectors, the pace of growth of the total stock had already peaked for this cycle prior to the start of the year. Greater uncertainty around future labor and materials availability and cost will make it increasingly more difficult to underwrite future development projects and, more significantly, obtain financing for them. As the economy eventually adjusts to the new tariff regime through the remainder of the year, more limited new construction may set the stage for stronger than previously expected rent growth in later years.
FIGURE 5: YEAR-OVER-YEAR GROWTH IN TOTAL STOCK BY PROPERTY TYPE

Source: CBRE-EA
Despite heightened uncertainty, aggregate transaction volume, which has been muted throughout each of the past two years, has accelerated (from low levels) during the first part of 2025, rising nearly 14% during the first quarter as compared to the same period in 2024, though comparison to 2023 transaction volumes may be more appropriate given the much lower levels of transaction in 2024 in most cases. We continue to expect overall transaction volume to continue to build throughout the year but now have less conviction regarding the pace of that improvement. The fundamental drivers for this have not changed, however, as most institutional investors remain meaningfully below their target allocation for real estate and rebalancing discipline has not been repealed.
TABLE 1: Q1 U.S. COMMERCIAL PROPERTY TRANSACTION VOLUME BY PROPERTY SECTOR
$ BILLIONS
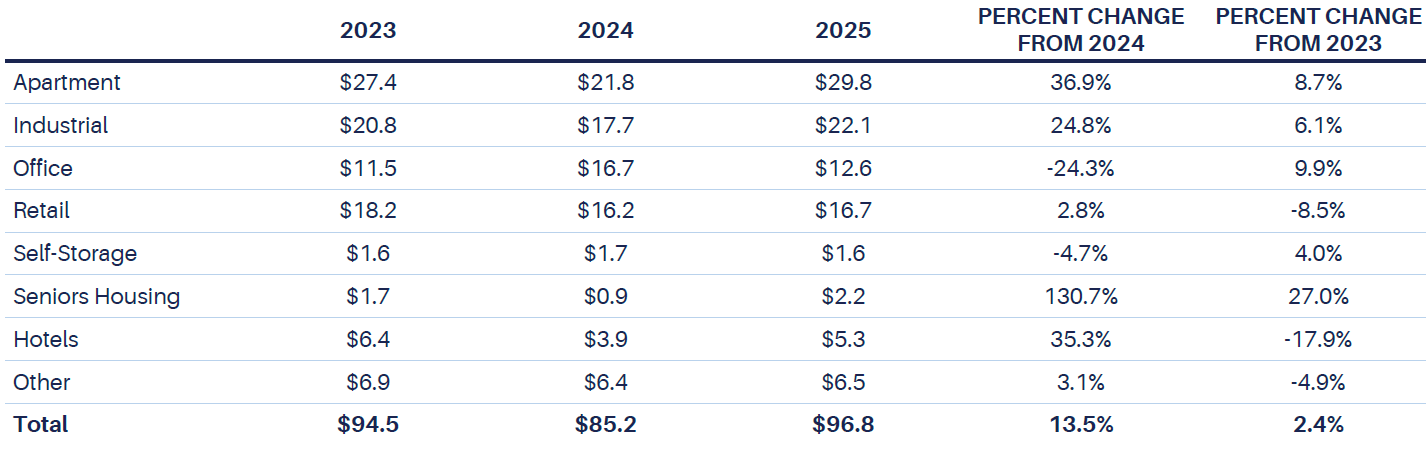
Source: RCA/MSCI. As of Q1 2025.
Finally, despite the current media focus on disruption originating from Washington, there is a larger backdrop to the commercial property outlook that should not be overlooked. Commercial and multifamily mortgages totaling approximately $2 trillion are scheduled to mature over the next three years (2025-2027), one-third of all outstanding CRE loans. This wall of maturity is occurring at the same time as property values have reached their trough for this valuation cycle.
These maturing loans represent a wide variety of loan types, asset type and quality and cash flow health. Some loans will, of course, be repaid, some will default and many others will likely be extended as the combination of new higher borrowing costs (relative to when the loans were originated) and more stringent lending conditions (e.g., lower loan-to-value ratios applied to now lower values) create capital structure stress, sometimes even in cases where there is no significant property operational stress. We continue to believe this intersection of peak loan maturity and trough valuations will reveal myriad new investment opportunities for both debt and equity investors.
FIGURE 6: EXPECTED COMMERCIAL PROPERTY LOAN MATURITIES

Source: Mortgage Bankers Association (MBA). As of December 31, 2024.
Conclusion
Q1 marked the third consecutive quarter of positive total return for U.S. commercial property. More significantly, the first quarter marked the first time the capital value component of the NCREIF Property Index (NPI) posted a positive return (albeit it a small one) since the second quarter of 2022. In some ways, the commercial property asset class is like a giant tanker sailing on the ocean; often the turn is signaled long before the ship shows change in course. We believe we are at this turning point, looking out over the beginning of the next, hopefully elongated, up cycle in property valuations and returns.
In most periods, go-forward expected return for unleveraged, stabilized core property can be approximated by the combination of the initial property yield and expected growth in property net operating income. Today, the average NPI cap rate is just shy of 5% and, as highlighted above (Figure 3), the average expected growth in NOI across the various property sectors (excluding the seniors housing outlier) is 2.5%, or 7.5% in total. Interestingly, 7.5% is also the average discount rate currently employed in the valuation of properties held by core, open-ended real estate funds (ODCE funds). More significantly, this average discount rate is now above the average U.S. public pension fund expected return on plan assets for the first time since 2010, signaling what we believe is a positive absolute and relative expected return environment for U.S. commercial property investment.
FIGURE 7: PRIVATE MARKET CRE QUARTERLY TOTAL RETURN

Source: NCREIF
FIGURE 8: ODCE FUND AVERAGE PROPERTY DISCOUNT RATE AND PUBLIC PLAN EXPECTED RETURN ON ASSETS

Source: Altus, NASRA. Annual data 2024.
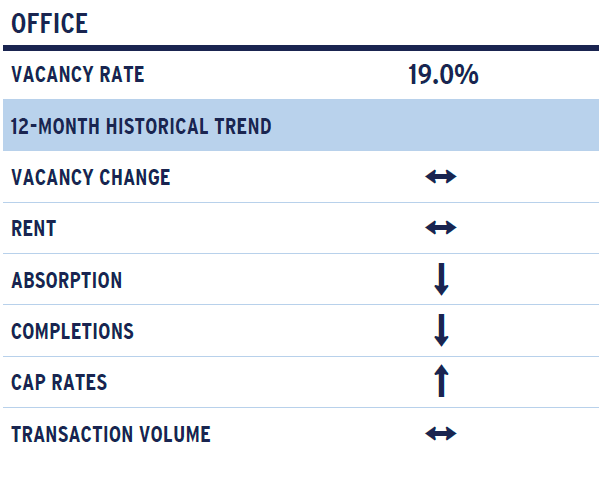
Office
The tenor of the office market fundamentals has not changed materially. The environment remains challenging with vacancies sitting at uncomfortably high levels, crimping any leverage owners may have even in the higher quality buildings. Tenants maintain the upper hand, whether looking to move to new space or adjusting their existing space needs. While there are select examples of new, high-quality buildings commanding better terms in negotiations, these remain exceptions to the rule. Many newly delivered assets and assets underway are dealing with significant availability issues and a muted leasing environment. The most notable exception may be New York, where the finance and legal sectors continue to command prime space compounded by more robust work-from-office pressures. More broadly, availability across the 44 million square feet (msf) of space currently under construction stood at 46% through the end of the first quarter3.
Leasing momentum (including both new leases and renewals) in aggregate trended down slightly for much of 2024 and that pattern has persisted in the first quarter. The pace of leasing averages about 75% of pre-pandemic levels per CoStar, although high-quality assets, despite the comments above, have fared better as tenants that do move are consolidating into better space. Office vacancy rates recorded a 10-basis point (bps) increase in the first quarter to 19.0%, with the availability rate holding just shy of 25%. These numbers have not moved materially over the past year according to CBRE. The small increase reflected a continued reduction in sublease space, which accounts for 2.0 percentage points of overall vacancy while direct vacancy ticked higher to 17.0%. While CBRE reported a strong close to the year in terms of absorption, those numbers slipped back into negative territory in Q1 with net absorption dropping by 740,000 square feet.
Despite continuing commentary and announcements around more companies adjusting return-to-office policies requiring more time in the office, those trends have been beneficial on the margin but have not translated into materially higher demand for aggregate space. Return-to-work is often matched with a paring down of employees, the option to leave or a shifting of resources by location so multiple dynamics are at play. The most recent was Google’s shift towards more in-office work, especially for some remote employees, with a focus on a hybrid model of three days per week in the office.
In aggregate, the net effect of tenant decisions has been towards a downsizing in space needs. While the number of leases signed is trending closer to pre-pandemic levels, average sizes have been trending notably lower. Our expectation is that this will likely continue and weigh on the market as the larger tenants with longer lease structures (7-10 years) adjust to the new market realities. While these firms have been growing and adding new employees, that has not yet proven to be sufficient to offset shifting space use patterns. CoStar estimates that 37% of leases signed prior to the pandemic have yet to roll. By definition, these leases are longer, tend to be larger and more concentrated in major markets often in a downtown setting.
So where can we look for positives? A confirmation of value losses highlighted by appraisal and public market pricing indices is gaining more clarity as transaction volumes notched higher. Sellers and lenders appear more willing to move on from stressed investments as more buyers get comfortable with the risk-adjusted return potential at reset values. There remains a wide divide between buildings with value and those without and the path forward seems to also vary widely ranging from demolition and repurpose to necessity support and strategically relevant. The impact on aggregate values, however, continues to play out with private equity adjusting at a more measured pace relative to the dynamics seen in the public markets. Through 2025 Q1, NCREIF’s capital appreciation index for office reflected an aggregate decline of 37% from previous highs, including a 9% downward adjustment over the past year and a slight 0.6% adjustment for the quarter. Green Street’s estimate of the overall price decline was a comparable 40% for higher quality assets held by REITs with a bottoming taking place more recently with values flat over the past year.
Annual transaction volume for assets above $20 million remained muted by historical standards but increased through the year to $15 billion in the fourth quarter, bringing the annual total to $40 billion, 26% ahead of 2023. The start to 2025 was a step back in pace at $7.8 billion versus 2024 at $9.8 billion although the timing of sales is always a factor. That said, since the close of the quarter, the market has seen further moderation with shifting tariff policies creating elevated market uncertainties. Institutional capital and listed REITs were marginally active buyers, but overall, remain net sellers. The most active net buyer of office space has been the private buyer (including owner/users) with owner/users increasing their share of purchases from 12% to nearly 30% of transactions at the end of 2024, although that settled closer to 23% in the first quarter for all deals over $5.0 million according to CoStar.
The pressure to transact has increased, coinciding with the amount of office debt maturing over the near-term. Stress is apparent as banks and other lenders increase loan-loss reserves and the CMBS market reports a rising percentage of office loans in special servicing and delinquency. The 30-day office delinquency rate remained in double digits in April at 10.3% according to Trepp although down slightly from year-end. Outstanding CMBS office loans in special servicing closed the quarter at 10.1%. Correspondingly, financing is highly constrained with many lenders (and owners) looking to reduce their office exposure while opportunistic buyers continue to look for opportunities that can provide outsized returns and owner/users consider the opportunity to own versus lease.
Overall, many of the patterns we have seen over the second half of 2024 have remained solidly in place thus far in 2025. The caveat on the horizon appears to be the dynamics playing out with tariffs and how those translate through the economy, inflation and interest rates (aka borrowing costs and liquidity). At this juncture there appears to be more downside risk to the office sector as it relates to demand for space and transaction liquidity with both likely to experience a degree of softening as investors and tenants wait for a calming in the waters.
FIGURE 9: OFFICE TRANSACTION VOLUME (ASSETS $20+ MILLION)

As of April 30, 2025 Source: MSCI/Real Capital Analytics
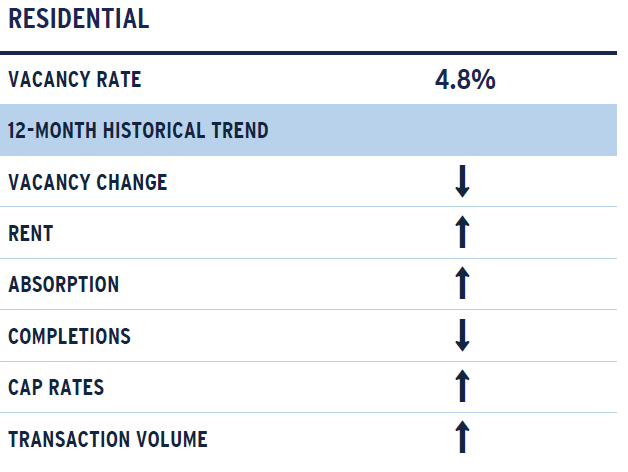
Apartment
Despite ongoing uncertainty in the broader economy, the apartment market recovery is well ahead of expectations following a solid start to the year. Vacancies dropped 20 basis points (bps) in the quarter to 4.8% and are down by nearly 100 bps year-over-year. Completions slowed notably in the quarter with only 70,600 units delivered, well below the 125,000-unit quarterly average over the previous three quarters. Demand, meanwhile, was robust with net absorption of roughly 100,600 units, the second strongest first-quarter demand ever reported per CBRE-EA (versus 2000 Q1 with 155,000 units). Putting the first-quarter demand into further perspective, first-quarter net absorption was more than seven times the 13,500-unit historical average since 1996.
Another encouraging sign for the quarter was the recovery in many Sunbelt markets. Demand in Atlanta, Jacksonville, Greenville, Fort Worth and Miami was particularly strong, with Q1 net absorption being six to 23 times the respective Q1 average historical demand. New York, Northern NJ, Washington, DC, Salt Lake City, Dallas, Charlotte, Orlando and San Antonio also posted solid, above-average demand, with Q1 demand between four and six times their norm. Further, the bulk of Sunbelt markets reported a quarterly absorption rate that was roughly double the U.S. average.
On the supply side, construction activity slowed across the vast majority of markets. Indeed, completion rates slowed in 56 of 69 markets quarter-over-quarter and 38 markets year-over-year. The deceleration in construction was greatest in Sunbelt markets. Raleigh, Orlando, Tampa, Austin, Charlotte, and Fort Lauderdale all reported significant reductions in construction quarter-over -quarter, while Orlando, Tampa, Austin, Jacksonville, Las Vegas and Houston reported notable year-over-year improvements. That said, Sunbelt markets still lead the way in terms of overall supply growth. For the most part, Sunbelt markets saw inventory grow between 0.5% and 1.3% in the quarter, outpacing the U.S. average of 0.4%, while the Gateway markets were all in line with or below the U.S. average.
Given the demand improvement and the supply slowdown, nearly all markets saw a shift in vacancies in favor of landlords. More than half of markets (47) saw vacancies decline quarter-over-quarter while all but one market (Madison, WI) reported a year-over-year reduction in vacancies. Additionally, vacancies across all markets have improved considerably from their post-COVID peak. Over 40 markets now have vacancies 100 bps or more below their recent peak, while vacancies in 34 markets are down between 50 and 100 bps. The only markets that are lagging in recovery are Denver, Orange County, Milwaukee and Madison; of note, however, vacancies in Orange County, Milwaukee and Madison remain well below the U.S. average. Denver, however, has experienced only a very modest recovery in fundamentals. Supply growth has slowed in Denver; however, demand has been somewhat tempered.
Going forward, volatility and uncertainty is expected to persist in the near-term, adding risk to the baseline outlook. That said, the continued thinning of the supply pipeline and expectations for positive employment and demand growth should allow fundamentals to continue to improve and support future rent growth.
With respect to the capital markets, prior to the April tariff announcements apartment transaction volumes had been improving and lenders appeared to be opening up with credit conditions improving and demand for credit increasing. Spreads had narrowed slightly, LTVs expanded, and all-in fixed rates were down. In April, however, the improvement in debt markets has stalled with volatility in the bond market pressuring lenders and, anecdotally, deals facing greater scrutiny by lender investment committees.
FIGURE 10: STRONG DEMAND HELPED SUNBELT MARKETS IMPROVE NOTABLY IN Q1

As of 1Q 2025
Source: CBRE-EA
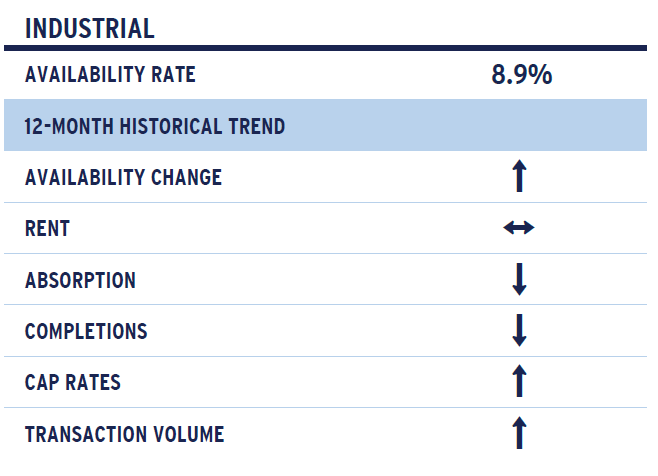
Industrial
The industrial market faces perhaps the greatest uncertainty today among all the property sectors. The ongoing trade war has added further pressure to a market that was already strained. Availability increased to 8.9% in the first quarter, up 30 basis points (bps) from the previous quarter and 110 bps from a year earlier. Availability has increased for 12 consecutive quarters now and stands at its highest level since early 2016. Availability is now well above the five-year (6.5%), 10-year (7.7%) and five-year pre-COVID (7.1%) averages but remains meaningfully below the 10-year pre-COVID average (10.1%).
Over the three-year run up in availability, demand remained strong in 2022, coming out of COVID as companies refilled inventories, but has since moderated considerably. Only 4.9 million square feet (msf) was absorbed in the most recent quarter. This follows average quarterly demand of only 21.7 msf per quarter over the past two years, which was already a mere fraction of the nearly 90 msf absorbed per quarter over the 2018-2022 period. Putting the current demand slump into further perspective, the average demand over the previous two years is considerably below the pre-same-day delivery push (35 msf average 2005-2014).
Fluctuations in demand by the nation’s largest industrial tenant have contributed to recent softness. According to CoStar, Amazon currently leases or subleases nearly 456 msf of space across the U.S. and their importance in the overall market has grown substantially. Over the 2020-2024 period, Amazon moved into over 300 msf of leased space, accounting for 20.6% of net new demand; this was up from roughly 93 msf and 7.0% of all space in the 2015-2019 period. The push to shorten delivery times and expand their distribution network was the primary driver behind this; however, Amazon’s demand has moderated notably since the end of 2022. The e-commerce company moved into an average of roughly 82 msf of leased space from 2020 through 2022; since then, however, their leasing demand has dropped by more than 50% with average move-ins of 28 msf in 2023 and 2024. Meanwhile, 2025 is off to an incredibly slow start with Amazon moving into only eight buildings, totaling 1.3 msf of leased space through April.
Notwithstanding Amazon’s weakness, prior to Liberation Day, there was an uptick in leasing activity among Chinese 3PLs, particularly in Southern California as companies worked to get product into the U.S. ahead of any potential tariffs. Additionally, a surge in freight trucking activity at the Texas-Mexico border was reported at the end of March. Per data from Motive, trucking activity at the Port of Laredo, the busiest U.S. land port, was up 48.5% year-over-year on March 31, with freight crossings reaching a record high. Additionally, trucking visits to North American distribution facilities for the top five retailers also rose to a record high, with the surge in volume more typical of the run up to the holiday season. Likewise, a similar 50% increase in freight volume between Toronto and Chicago was reported by ITS Logistics while freight rates increased between 10% and 50%, depending on the expediency of the shipment. Finally, there was a notable increase in drug shipments by air freight, particularly for higher priced drugs, with pharmaceutical companies pulling forward shipments from Ireland, Germany and Switzerland.
Since Liberation Day, however, uncertainty has been the prevailing theme across the economy and property markets, particularly the industrial sector. The breadth and scope of tariffs imposed on Liberation Day and since have outpaced many expectations and rocked the very foundation of the economy. The volatility in the stock market that ensued after Liberation Day eventually forced a 90-day pause on the proposed tariffs for all countries except China. Instead, the trade war with China has escalated with the U.S. putting a 145% tariff on China, and China reciprocating with a 125% tariff on U.S. goods.
The escalation with China is particularly concerning for West Coast ports; already, a 60% reduction in cargo shipments from China has been reported. Further, in April, there were about 80 canceled sailings from China to the U.S., roughly 60% more than any month during the COVID pandemic, according to John McCown from the Center for Maritime Studies4. The 90-day pause in the tariff implementation has allowed some substitution of imports from other countries like Cambodia, Thailand and Vietnam; however, it does little to alleviate fears or ease the uncertainty that persists today. At risk too is the inventory build-up to the back-to-school and holiday shopping seasons. All of this points to higher inflation expectations, less consumer spending, a weaker overall economy and likely lower industrial demand.
While the ongoing trade war will continue to pressure demand, supply is slowing quickly. Per CBRE-EA, less than 50 msf of space was completed in Q1 and only 172 msf is underway for completion by year-end. In aggregate, the total expected deliveries of 221 msf in the year is a marked deceleration from 345 msf (-36%) added in 2024 and 490 msf (-55%) completed in 2023. Moreover, less than 41 msf is currently underway for delivery beyond 2025.
Given the weaker economic outlook today and higher inflation expectations, particularly for construction materials, supply should remain relatively tempered in the near-term. That said, supply is expected to outpace the more moderate demand expectations leading to slightly higher availability by year-end 2025. Thereafter, fundamentals are expected to stabilize with availability hovering around the 10-year pre-COVID average. Hence, rent growth will be more modest relative to previous expectations; however, long-term rent growth expectations remain solid.
FIGURE 11: AMAZON'S LEASING IMPACT

As of 1Q 2025 Source: CoStar
Retail
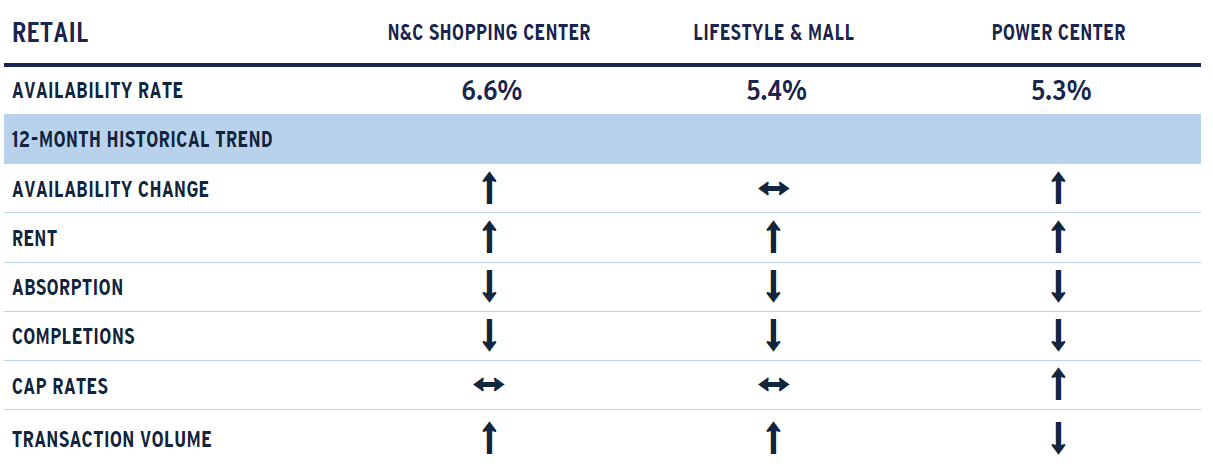
The retail market remains tight and the healthiest of the property types today; however, there are areas of near-term concern. First, total retail availability increased in 2025 Q1 to 4.8%. While this was a very modest 10 basis point (bps) increase, it marked the first increase since 2023 Q1. Among the property subtypes, availability in the largest segment of the market, the neighborhood and community center (NCSC) market, increased 10 bps to 6.6%, the first quarterly increase since mid-2020. Likewise, power center (PC) availability increased in the quarter; however, this was the third consecutive quarterly increase with availability edging up 20 bps to 5.3%. Finally, lifestyle and mall (LM) availability was flat in the quarter at 5.4%; availability in the sector has declined or remained flat for seven consecutive quarters. Overall, while availability has generally edged higher, it is exceptionally tight in historical context; indeed, NCSC availability remains 300-430 bps below the five- and 10-year pre-COVID historical averages while PC availability is roughly 100-140 bps below average and LM availability sits right in the middle of the historical averages.
The uptick in availability in the quarter was primarily demand driven; contrary to the apartment and industrial property sectors, new supply is a moot issue in the retail sector. Roughly 1.5 million square feet of space (msf) was returned to the market in 2025 Q1, the first quarter of negative net absorption since the midst of the pandemic. Increasing bankruptcies and store closing announcements since the second half of 2024 were the drivers behind the weaker than expected demand in 2025 Q1. In all, 2024 saw more than 7,300 store closings, the highest level since the pandemic when 10,000 stores closed in 2020. The wave of bankruptcies and closings has continued into 2025. Notable bankruptcies include Joann Fabrics and Party City, which, closed all 800 and 700 of their stores, respectively, and Liberated Brands (Volcom, Billabong and Quicksilver, RVCA, Roxy, Honolua and Spyder), which will close all 122 of their locations over the course of the year. Additionally, Walgreens (500), CVS (270), Macy’s (66), J.C. Penney (8), Dollar General (141; includes 45 Popshelf stores) and Kohl’s (27) have announced the closing of underperforming stores.
Further adding to slightly more subdued conditions and outlook for the sector are the potential impact of tariffs on inflation, consumer spending, retailer performance and ultimately property market fundamentals. While the bulk of tariffs have been paused for now, they remain in place for goods from China at a worrying 145%. This is leading to some changes in supply chains as other countries take share from China; however, many retailers are warning of shortages that will undoubtedly drive prices higher, in addition to the upward pressure on prices from tariffs. It is not improbable that shortages and price hikes could rival what was seen during the pandemic. The strain of reduced foot traffic and lost sales due to higher prices and shortages during the pandemic caused record store closures as noted above. Coresight Research is currently projecting 15,000 store closures for 2025, which would be a 50% increase over pandemic levels. To date, there has generally been enough demand among stronger retailers to backfill vacated spaces, although this does take time, particularly for stores in bankruptcy as they make their way through the legal process.
With respect to the potential for inflation, consumers are already feeling squeezed by mounting debt, particularly for lower income households. According to a report by the Federal Reserve Bank of Philadelphia (FRBP), more people were falling behind on their credit card payments and more people were making only the minimum payment. Indeed, in 2024 Q4, 11.1% of credit card users were making only the minimum payment, the highest level ever reported since the FRBP began tracking the data 12 years ago. Moreover, according to the Federal Reserve Bank of New York, Americans had $1.21 trillion in credit card debt as of 2024 Q4, a record high, while delinquencies increased to 3.6% overall with those past due by 90 days or more also reaching a record high 0.9%. According to U.S. credit card lenders, lower income households, who are feeling the stress, have pulled back on spending and these sentiments were echoed on earnings calls by retailers and fast food/fast casual restaurants like Walmart, Dollar General, Five Below, McDonald's, Chipotle, Domino’s Pizza and Pizza Hut. This is worrisome in light of the ongoing trade war as we stated in our macroeconomic overview, tariffs are generally regressive in their impact.
Against this backdrop, we remain cautious with respect to the consumer given the historic peak in credit card debt and rising delinquencies. The threat of higher inflation due to tariffs and the likelihood that this could push out any potential rate cuts clearly adds downside risk to the outlook for the consumer and retail sector. Given the downside risks, we expect necessity-based and off-priced retail will hold up better relative to lifestyle centers and malls, which generally have more discretionary-based tenants. Longer term, still low levels of construction and positive demographic shifts signal a relatively strong outlook for the sector. Indeed, the Millennial population, the largest generational cohort today, is entering their prime wage earning and spending years. As they continue to age, form their own households and hit milestones like parenthood, their spending should accelerate, helping to shore up retailer balance sheets and retail fundamentals.
FIGURE 12: CREDIT CARD STRESS IS RISING

Source: Federal Reserve Bank of Philadelphia
1 The preliminary estimate for first quarter real GDP growth showed a small contraction for Q1 but this includes a more than 50% increase in Q1 imports in advance of expected tariff increases. GDP includes the net of exports and imports and the unusually large increase in Q1 imports subtracted five percentage points from overall annualized growth.
2 https://www.conference-board.o... “US Consumer Confidence Plunged Again in April.” April 29, 2025
3 Source: AEW Research and CoStar based on assets under construction over 20,000 sf in major markets
4 https://www.forbes.com/sites/p...
For more information, please contact:
MICHAEL ACTON, CFA®
Managing Director, Head of Research & Strategy, North America
michael.acton@aew.com
+1.617.261.9577
ADRIENNE ORTYL
Director, AEW Research
adrienne.ortyl@aew.com
+1.617.261.9159
RICK BRACE, CFA®
Director, AEW Research
rick.brace@aew.com
617.261.9170
JAY STRUZZIERY, CFA®
Head of Investor Relations
jay.struzziery@aew.com
+1.617.261.9326
This material is intended for information purposes only and does not constitute investment advice or a recommendation. The information and opinions contained in the material have been compiled or arrived at based upon information obtained from sources believed to be reliable, but we do not guarantee its accuracy, completeness or fairness. Opinions expressed reflect prevailing market conditions and are subject to change. Neither this material, nor any of its contents, may be used for any purpose without the consent and knowledge of AEW. There is no assurance that any prediction, projection or forecast will be realized.