Shifting Balance of Risk
“… the balance of risks appears to be shifting …”
Jerome Powell Fed Chairman, August 22, 2025. Jackson Hole, WY
In 1977, Congress amended the Federal Reserve Act, directing the Board of Governors of the Federal Reserve System and the Federal Open Market Committee (FOMC) to "maintain long run growth of the monetary and credit aggregates commensurate with the economy's long run potential to increase production, so as to promote effectively the goals of maximum employment, stable prices and moderate long-term interest rates.1" At times, the policy choices likely to advance one goal may not be appropriate to advance the others. At the Federal Reserve’s oft anticipated Jackson Hole policy summit in August, Fed Chairman Jerome Powell ushered in the beginning of the next period of monetary policy easing by citing the emerging change in the balance of risks in the U.S. economy as worries over inflation give way to perhaps greater concerns for labor and unemployment2. Reflecting this, the FOMC agreed in September to lower the Fed’s overnight borrowing rate by 25 basis points with an expectation of additional cuts over the next 12 to 18 months as new economic data warrants. To this point, the FOMC voted to lower the policy rate by an additional 25 basis points at their most recent meeting during the last week of October.
FIGURE 1
SIZE OF THE FEDERAL RESERVE BALANCE SHEET

Source: Federal Reserve
Perhaps more significantly, during the press conference following the October meeting, Fed Chairman Powell announced that on December 1, 2025, the Federal Reserve will end its quantitative tightening (QT) program, which began in June 2022. Powell emphasized that the Fed’s reserves are now “somewhat above the level we judge consistent with ample reserve conditions,” suggesting that the Fed is approaching its target for liquidity in the banking system. Additionally, the Fed will transition to a bills-heavy reinvestment approach, meaning it will reinvest maturing securities primarily into short-term Treasury bills rather than longer-duration assets. From this, we affirm our prior assessment that the yield curve is likely to steepen as short rates decline (i.e., long rates are unlikely to decline as quickly or as much as short rates) while broader financial market liquidity persists. In all, the Fed’s holdings of Treasury and mortgage-backed securities declined by more than 25% since QT began, an aggregate reduction of approximately $2.5 trillion.
FIGURE 2
MARKET EXPECTATION OF YIELD CURVE STEEPENING

Source: Chatham Financial. October 30, 2025
From the minutes of the September meeting, we know the FOMC discussed labor market weakness, noting that for the first time since the pandemic, there are now fewer open positions nationwide than the total number of unemployed, creating an expectation of upward pressure on the unemployment rate.
FIGURE 3
TOTAL JOBS OPEN AND UNEMPLOYED PERSONS

Source: Job Openings and Labor Turnover Survey (JOLTS), Bureau of Labor Statistics
Currently, there is no official measure of U.S. GDP growth for the third quarter due to the ongoing federal government shutdown, but recent business cycle analysis from Moody’s Chief Economist, Mark Zandi, suggests that as many as half of U.S. states are likely in or near recession3. According to Zandi, “the states most impacted are the ones more reliant on agriculture and manufacturing. Those sectors are more likely to be impacted by tariff increases.” If correct, this assessment suggests the return to a more typical pattern of economic expansion and contraction, similar to what was referred to as “rolling recession” prior to the Global Financial Crisis (GFC). In contrast, economic contraction during the GFC period and later during the pandemic period, was both abrupt and geographically widespread. For the GFC, this reflected the broad and rapid shutdown of credit and liquidity and for the pandemic, the catalyst was the rapid contraction in demand due to mandated restrictions of activity.
FIGURE 4
STATES LIKELY IN OR NEAR RECESSION
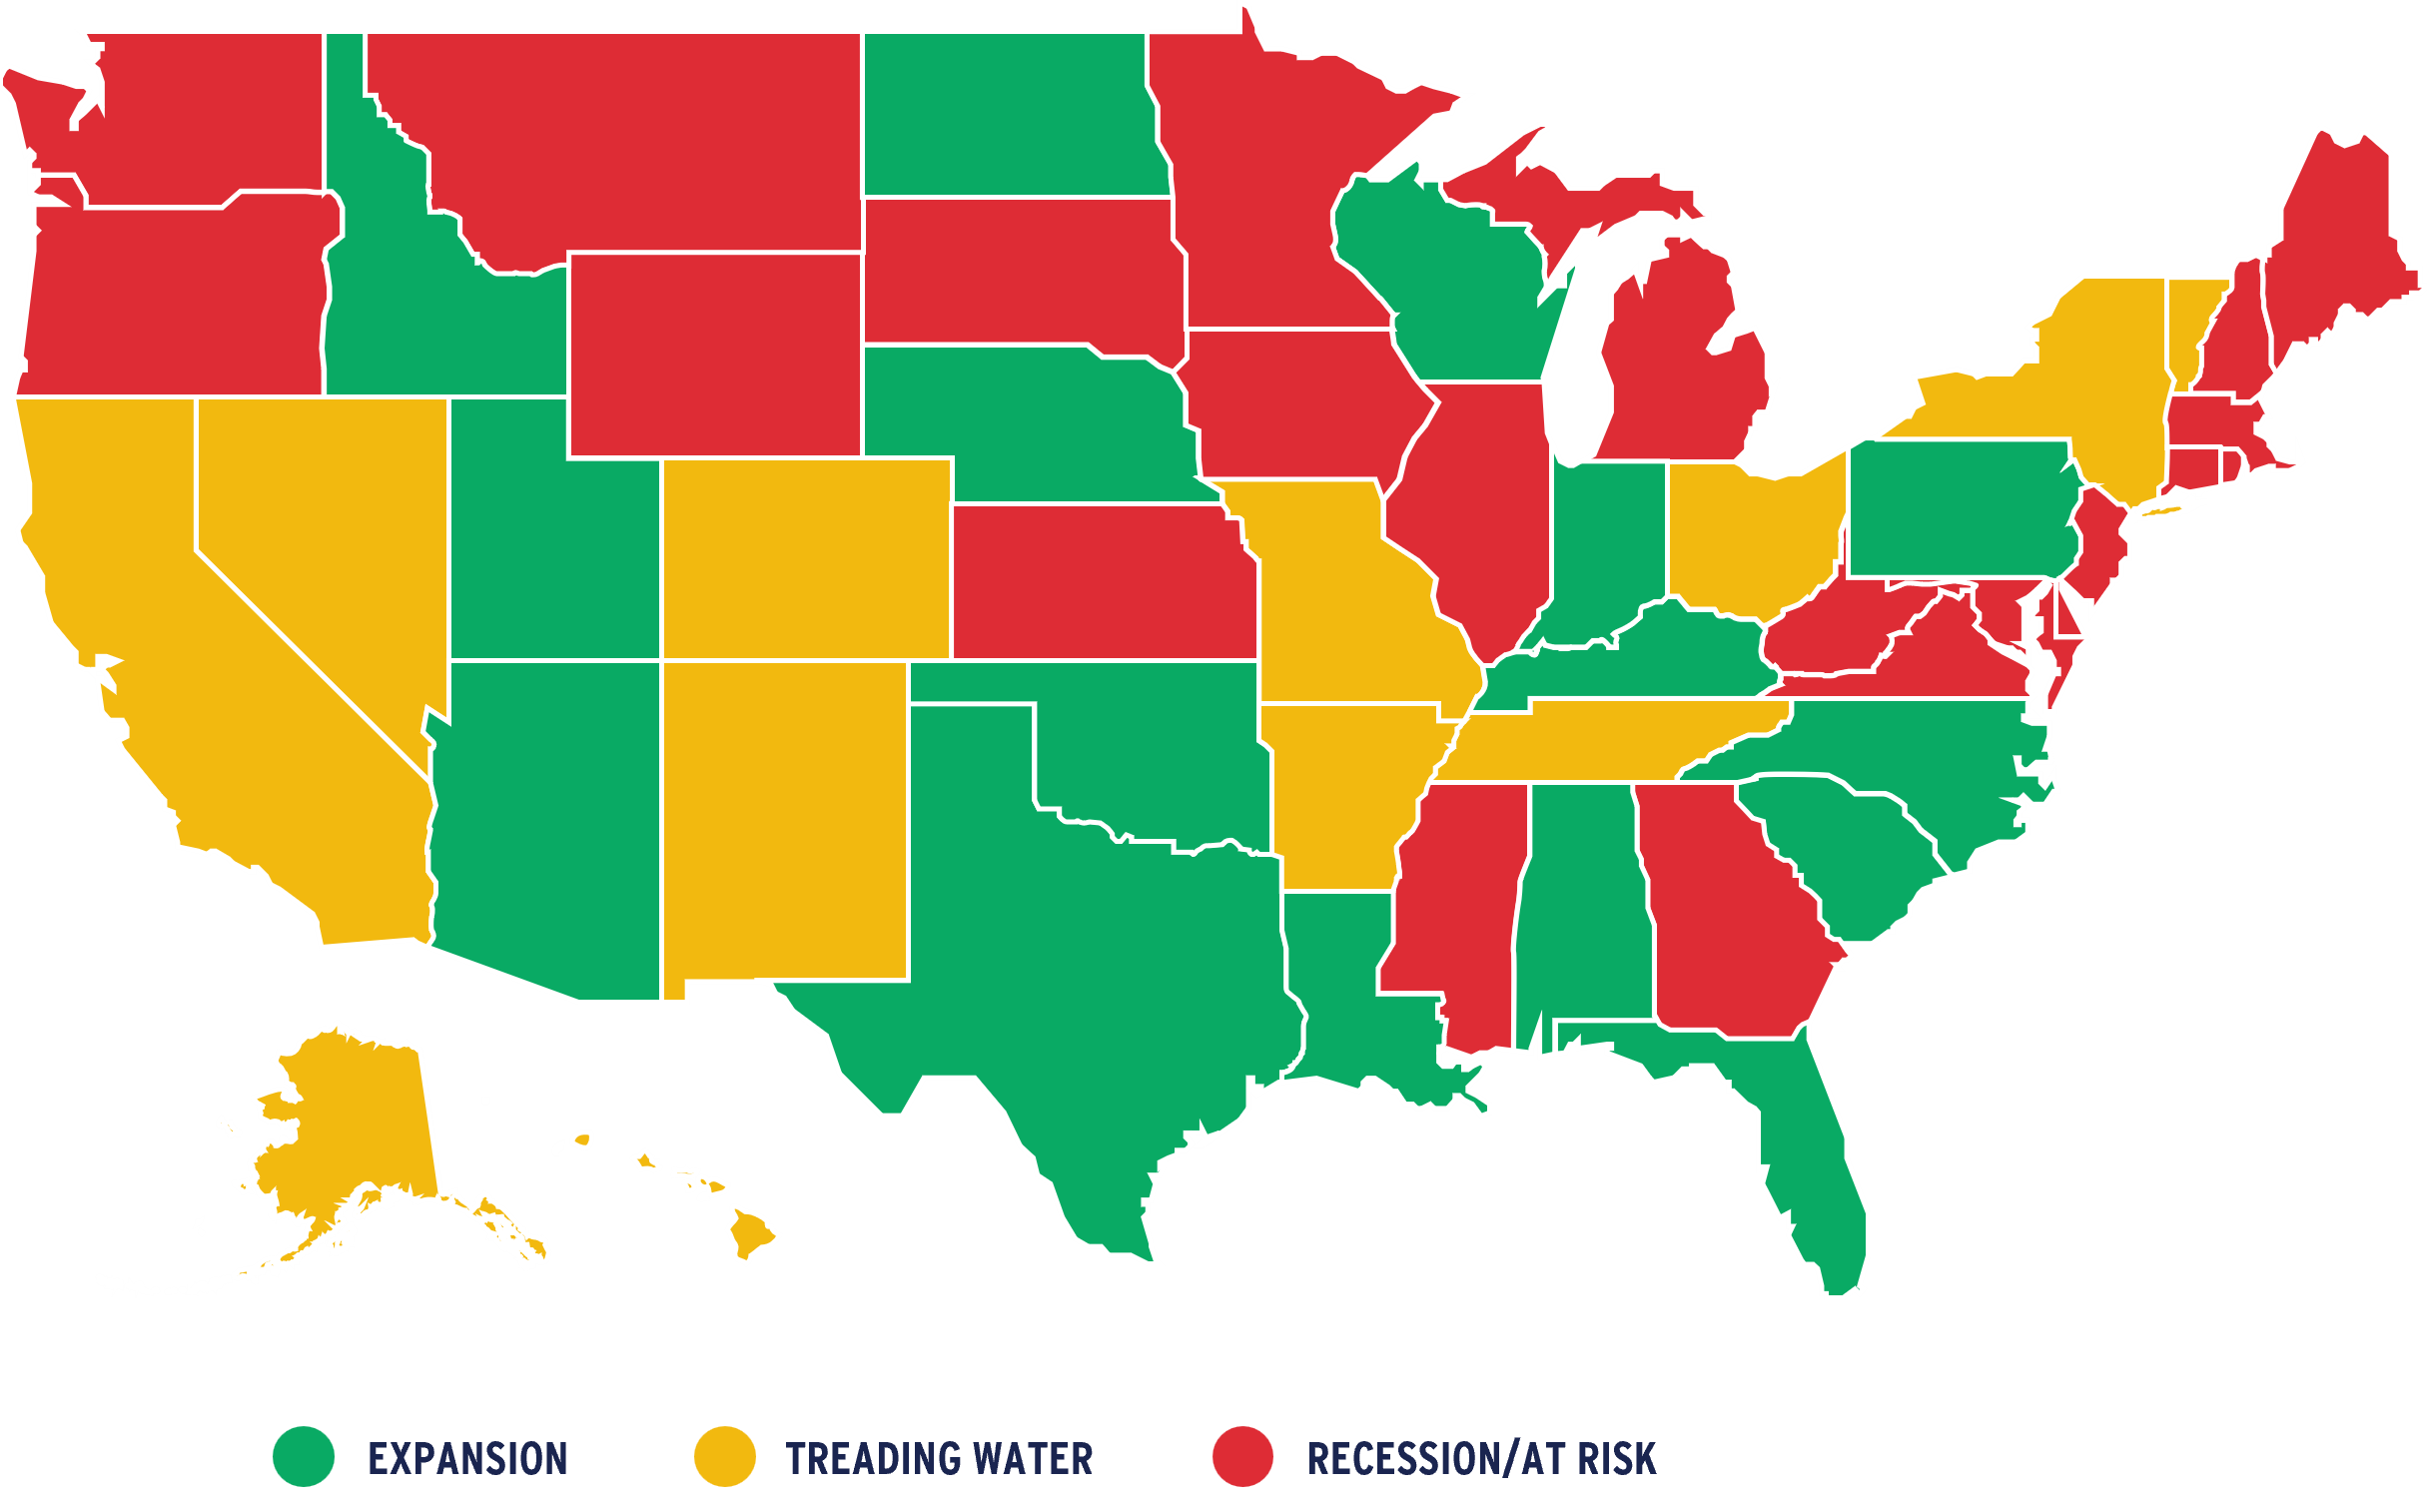
Source: https://www.linkedin.com/pulse...
Our current base case outlook assumes slow aggregate near-term economic growth but no broad-based contraction (i.e., no recession). While economic uncertainty remains elevated, significant income and wealth effects related to all things AI (data centers, chips, equity valuations, etc.) seem likely to keep aggregate consumption growing, as long as these conditions persist. We do, however, acknowledge heightened risk in this system, particularly the risk embedded in current equity market valuations. To this point, various metrics of extreme valuation in the past such as the so-called Buffet Indicator (ratio of equity market capitalization to GDP) and Shiller’s cyclically adjusted price to earnings ratio (CAPE) suggest similar concerns today. Obviously, any sudden meaningful change in stock market valuations would represent a corresponding change in the current outlook.
FIGURE 5
U.S. EQUITY MARKET VALUATION INDICATORS

Source: Wilshire, Bureau of Economic Analysis, as of 2025 Q3, http://www.econ.yale.edu/~shil...
More fundamentally, U.S. economic growth and, by extension, property demand is tied to broad metrics such as population, household and labor force growth. On this, a recent paper published by the American Enterprise Institute in conjunction with Brookings finds current federal immigration policy to be broadly negative for economic growth.
“We assess the macroeconomic implications of the observed and expected changes to immigration policy during the second Trump administration. We project that net migration in 2025 will be between −525,000 and 115,000, reflecting a dramatic decrease in inflows and somewhat higher outflows. Net migration may be reduced even further in 2026 before rebounding in 2027 and 2028. These changes will reduce gross domestic product growth by 0.3–0.4 percentage points in 2025 and put significant downward pressure on growth in the labor force and employment. Monthly payroll employment growth could be near zero or negative in the next few years.4”
Other groups such as Pew Research5 and the Center for Immigration Studies6 estimate that the number of foreign-born people leaving the United States this year range from 1.5 million to as many as 2.2 million, and these estimates are obviously only partial-year totals at this point. Longer term, the U.S. Census Bureau regularly produces a “zero immigration” population forecast that starkly shows the impact of reduced or, in the extreme, zero immigration on the long-term demographic outlook for the country. With fertility rates well below replacement, the U.S. and most advanced economies would experience significant population decline absent positive net immigration.
FIGURE 6
U.S. BASELINE POPULATION PROJECTION VS. NO IMMIGRATION SCENARIO

Source: 2024 U.S. Census forecast
While it is unclear how long the phenomenon of U.S. negative net migration might persist, there are likely geographic implications. The largest concentrations of foreign-born persons in the U.S. are, understandably, found in large coastal gateway markets such as New York and Los Angeles. In terms of share of population that is foreign born, southeast Florida, Miami in particular, stands out with roughly 45% of the total population being born outside of the U.S. In the current political environment, the demand outlook, particularly for demographically oriented property sectors such as residential and retail, in markets with outsized foreign-born, populations will remain uncertain.
Commercial Property Outlook
Through the third quarter, U.S. commercial property has delivered positive total return for five consecutive quarters, predominantly or entirely due to income return. While we believe that the next cycle of positive property appreciation began during the second half of 2024, property value increases have, thus far, been limited.
FIGURE 7
NCREIF PROPERTY INDEX (NPI) QUARTERLY RETURN

Source: NCREIF, 2025 Q3
Prior value recovery cycles in U.S. commercial property have been marked by two complementary forces, strong growth in property net operating income (NOI), typically driven by cyclical recovery in occupancy and rent following a period of economic contraction (recession), and declining required yield (capitalization rates), typically in response to falling Treasury yields. In the current environment, aggregate NOI growth is modest, consistent with slower late-cycle economic growth, and property yields are largely stable, consistent with gradual steepening of the yield curve as the Fed lowers short rates. Additionally, property yields, as measured by average appraisal cap rates, remain at historically low spreads to Treasury yields. As such, we expect little or no near-term compression in average appraisal (carrying value) yields and, consequently, limited near-term appreciation.
FIGURE 8
NPI AVERAGE CAP RATE SPREAD TO 10-YEAR TREASURY YIELD

Source: NCREIF, 2025 Q3
Currently, the range of existing yield spread relative to long-term average varies considerably by property sector, with appraisal cap rates still quite low in sectors such as industrial and apartment and much closer to long-term norms in office and retail. Near-term, go-forward investment returns will likely reflect the differences in initial yield adjusted for differences in the durability of in-place income as well as the capital expenditure demands of the property. On this point, office properties, for example, might provide higher initial yield even with reduced occupancy, but investors will likely question the durability of that income as leases roll and future leasing becomes dependent upon significant capital expenditures.
FIGURE 9
CURRENT APPRAISAL CAP RATE SPREAD TO TREASURY YIELD AND LONG-TERM AVERAGE SPREAD

Source: NCREIF, AEW Research, 2025 Q3
Reflecting the unique nature of the nascent valuation reflation cycle, the outlook for go-forward, near-term returns is somewhat range bound. Given the absence of true cyclical downturn and recovery, the outlook for most property sectors is clustered near 7.0% to 7.5% in the most recent survey of institutional investors, with seniors housing and office properties representing the upper and lower bounds, respectively.
FIGURE 10
NPI+ EXPECTED RETURN 2026-2029

Source: PREA Consensus Survey, 2025 Q3
FIGURE 11
CUMULATIVE TOTAL CRE TRANSACTION VOLUME BY YEAR

Source: RCA/MSCI, 2025 Q3
Aggregate commercial property transaction volume has improved considerably throughout the year and, as of the end of Q3, is running more than 15% ahead of last year’s pace. Volume in all property sectors except hotel is above year-ago pacing and seniors housing is likely to finish the year at nearly twice the total volume of 2024, albeit still a relatively small aggregate dollar level given the comparative size of the sector.
TABLE 1
TRANSACTION VOLUME THROUGH Q3 BY SECTOR ($ BILLIONS)
Source: RCA/MSCI
Conclusion
The next commercial property value reflation cycle has begun, but progress has thus far been limited, and is likely to remain tepid through 2026. Economic growth is mixed with most things and places related to artificial intelligence booming while many other sectors and areas are soft or worse. More accommodative monetary policy is certainly positive for asset markets but, for reasons discussed, we continue to believe that the yield effect for property valuation will be limited, at least in the near-term. Positively, capital has and will be moving into property, likely at an accelerating pace. Most institutional investors find themselves well below target allocations for real estate and as equity market valuations grow higher, property allocations inevitably fall farther behind, necessitating additional capital deployment. Given this, we expect transaction volume to continue to increase through 2026 and beyond as property yields gradually grow back into reasonable spreads. Overall, go-forward return expectations for property, while lower than previous recovery cycles, are reasonable and competitive with equities and fixed income and property is well-positioned for a potentially longer, albeit less extreme, period of income oriented total return.
FIGURE 12
PENSION FUND REAL ESTATE ALLOCATIONS RELATIVE TO TARGET

Source: Hodes-Weill & Associates
Office
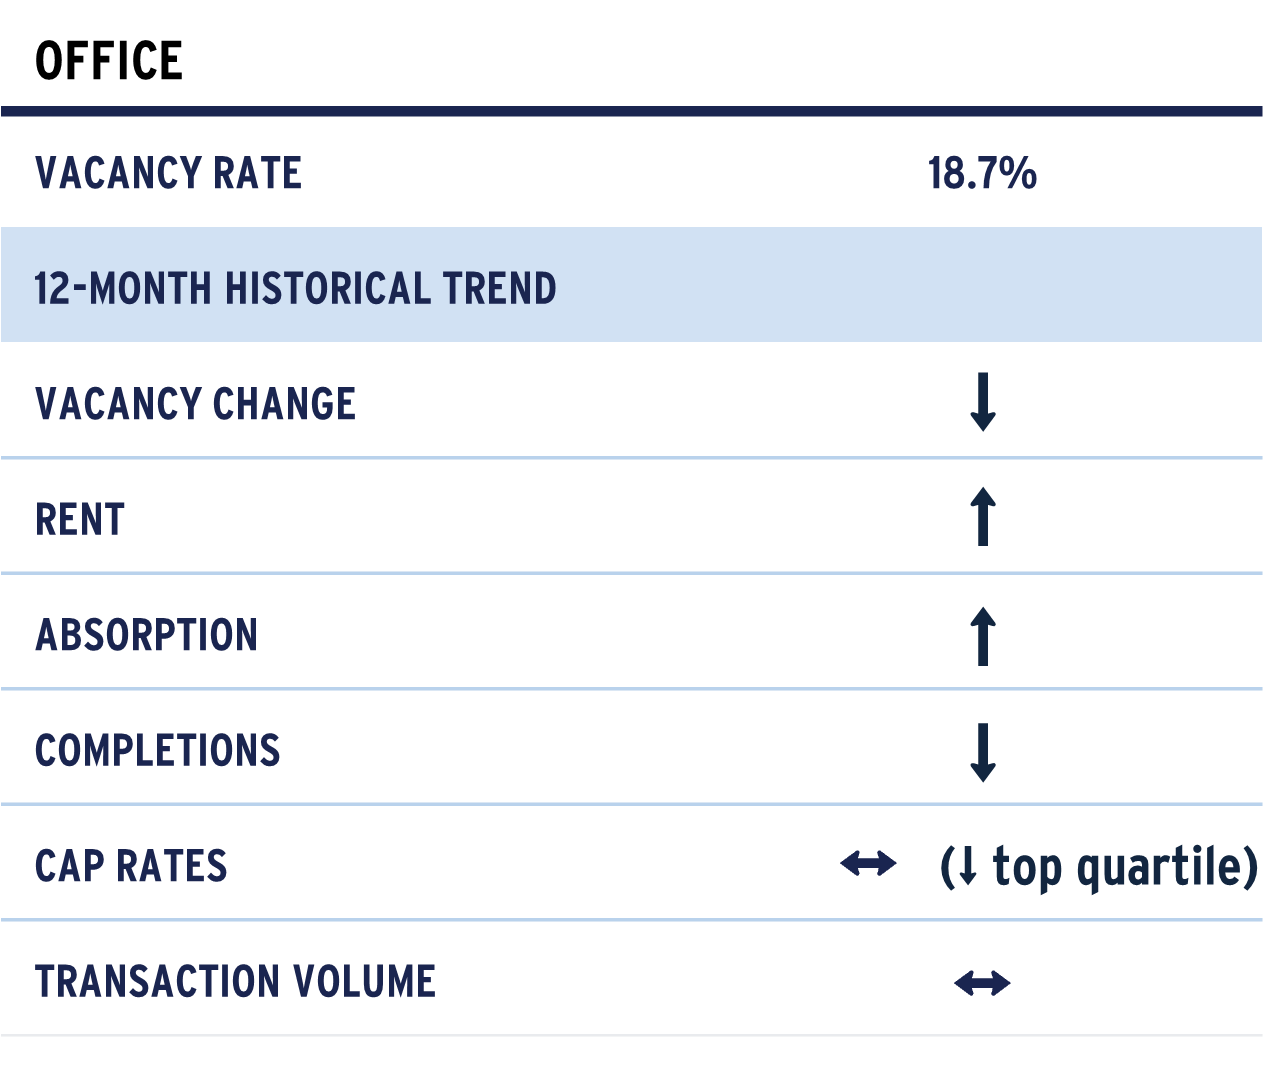
The office market remains under pressure, though signs of optimism are emerging. Elevated vacancy rates, even in premium buildings, reduced negotiating power for landlords, giving tenants significant bargaining power. While a few newly built, high-end properties have secured leases favorable to owners, these are outliers. Overall, leasing activity did pick up in the third quarter, but is very locationally bifurcated, and availability remains high across both new and existing assets. Notably, New York and Dallas stand out, with strong demand for prime space driven by the financial and legal sectors.
According to CBRE, leasing activity rose sharply in Q3, as the 14 million square feet (msf) absorbed during the quarter would have been above average even pre-pandemic. Indeed, this marks the highest quarterly absorption since the post-COVID reopening in late 2021. Top-tier buildings benefited despite tenant consolidation, leading to a modest 30 bps drop in total vacancy to 18.7% in Q3. Availability also declined slightly to 24.2%. Sublease space now accounts for 1.8% of all vacancies, while direct vacancy fell to 16.9%.
Despite more firms mandating in-office work, overall demand for space has only slightly increased because these policies often coincide with downsizing, relocations or staff reductions. New York and Dallas continue to outperform, posting five or more straight quarters of positive absorption, while other urban markets struggle with weaker demand amid economic uncertainty and space givebacks. In New York, we continue to monitor developments surrounding the mayoral race and its implications for the city’s office market and broader business climate. The long-term impact to office demand of labor-saving tech like AI versus return-to-office mandates remains unclear.
Absorption trends across the top ten markets are split. As noted, New York and Dallas posted well above-average net absorption over the past year, with Atlanta, Chicago and San Francisco also in positive territory, albeit below long-term averages. In contrast, Boston, Seattle, Houston, Los Angeles and Washington, D.C. lag behind, with net negative absorption and performance below their 2010–2019 averages. This divergence reflects uneven recovery paths shaped by local demand drivers and market-specific challenges. These factors, including migration patterns, economic drivers and space utilization preferences, will need to be monitored to understand the durability of recent trends.
FIGURE 13
ANNUAL VS. LONG-TERM AVERAGE ABSORPTION

Source: CBRE
Tenant behavior continues to shift toward smaller footprints. While lease volumes are near pre-pandemic levels, lease sizes have contracted by 15–20%. This trend is expected to persist as larger firms with long-term leases (7–10 years) adjust to changing conditions and practices. Headcount growth has stalled, with BLS data showing a 2% decline in payrolls since April 20237.
On a brighter note, clarity around valuation losses is improving as transaction volumes rise. Sellers and lenders are increasingly willing to exit distressed assets, and investors are warming to recalibrated return profiles at reset pricing. A clear divide remains between assets with lasting appeal versus those at risk of obsolescence, with some owners looking to demolition or conversion as potential solutions. NCREIF’s value-weighted cap rate index for office declined slightly to 5.8% in Q3 from just over 6% in Q1.
Apartment
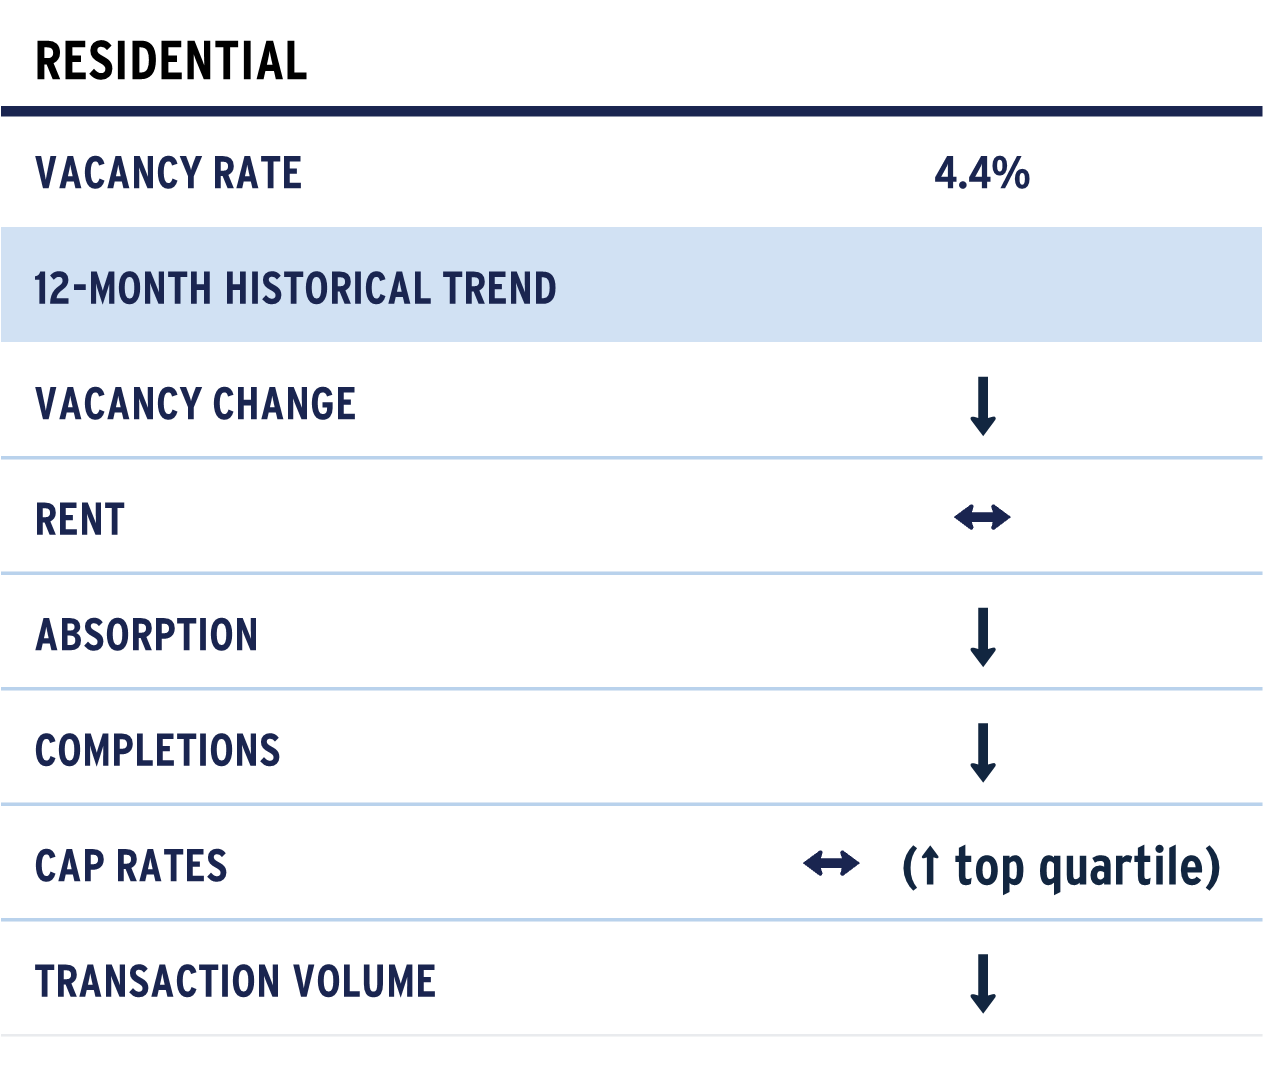
Mirroring slower employment growth nationally, apartment absorption moderated during 2025, both on a rolling four-quarter basis as well as in Q3 specifically. Despite this, overall absorption remains ahead of new supply over the past year, but the overall vacancy rate did tick up slightly during the third quarter.
FIGURE 14
APARTMENT DEMAND AND SUPPLY GROWTH VS. VACANCY RATE

Source: CBRE-EA, 2025 Q3
FIGURE 15
APARTMENT VACANCY RATE AND RENT GROWTH

Source: CBRE-EA, 2025 Q3
While national completions were essentially unchanged from Q2 to Q3 (90k to 91k), the rolling four-quarter average shows that the rate of new supply coming to market has continued to decline. New supply is expectedly highest in Sunbelt markets like Charlotte, Richmond and Raleigh.
TABLE 2
APARTMENT MARKETS WITH 5% OR MORE OF STOCK CURRENTLY UNDER CONSTRUCTION
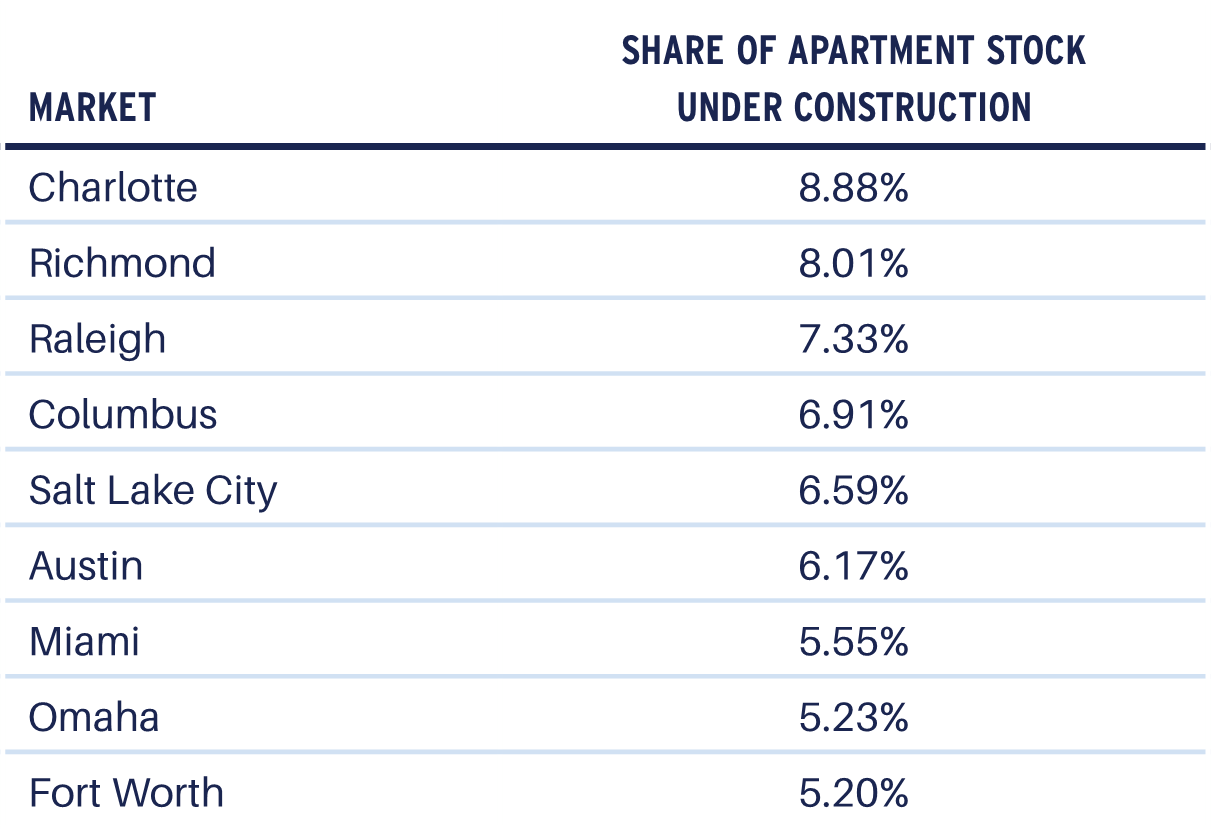
Source: CBRE-EA, 2025 Q3
Vacancy improved in all major markets except Denver over the past year. Growth markets struggling with high vacancies improved dramatically, such as the Texas and North Carolina markets, Atlanta, and Phoenix, but vacancy also improved significantly in markets with already low vacancy rates such as Orange County, New York, San Francisco as well as various smaller Midwest markets. As such, there remains significant near-term variation in expected rent growth with stronger gains expected in smaller Midwest markets over the next one to two years, giving way to faster growth in most Sunbelt markets during the latter part of 2027 and into 2028.
FIGURE 17
CURRENT APARTMENT VACANCY RATE AND CHANGE IN VACANCY RATE OVER PAST YEAR

Source: CBRE-EA
Myriad recent federal government policy changes are likely to impact the apartment sector to varying degrees. Apartment markets are not typically directly impacted by higher tariffs, but new tariffs on imported timber, lumber, kitchen cabinets and furniture will contribute to the headwinds facing new development in both the apartment and single-family housing markets. Additionally, while past federal government shutdowns have been relatively short in duration and generally had little or no impact on renters, the current shutdown seems different. Suspended pay for various categories of federal employees with growing rhetoric regarding limited or no back pay following the shutdown may cause rental payment stress in markets where those populations are high. Suspensions in federal SNAP funding, if prolonged, will increase the cost burden for low-income households, potentially causing delinquencies in rent payments as housing-cost burdened families scramble to adapt their finances. Similarly, potential Affordable Care Act (ACA) subsidy reductions would affect many households as insurance premiums increase across the board. More significantly, changes in federal immigration policy may substantially and persistently slow U.S. aggregate population growth, leading to fewer new households—especially among renters.
FIGURE 18
APARTMENT TRANSACTION VOLUME

Source: CBRE-EA, 2025 Q3
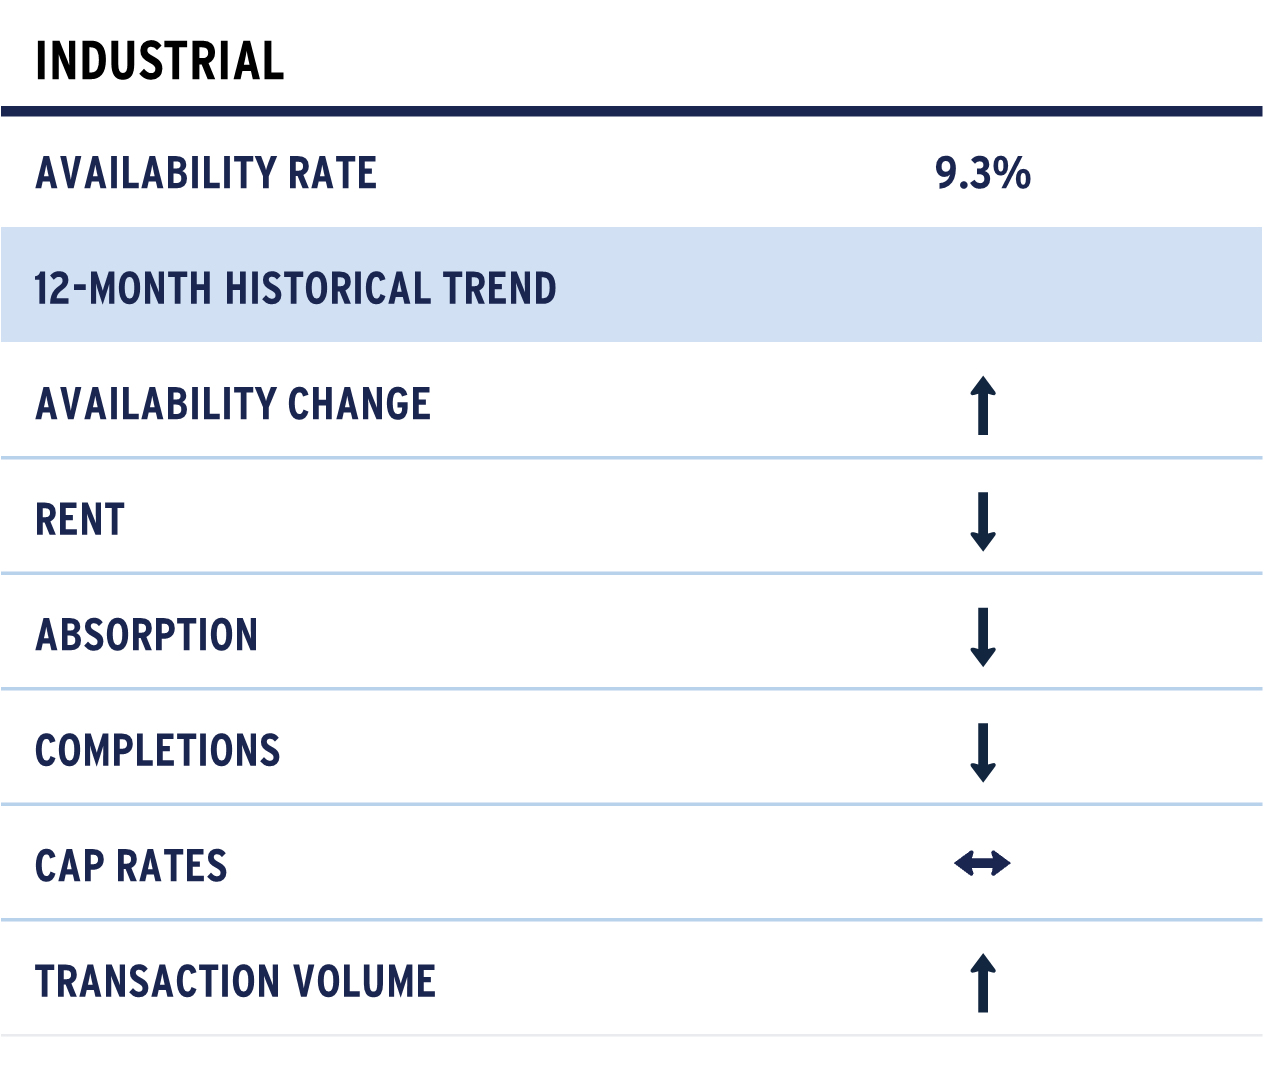
Industrial
U.S. industrial property demand has been slowing steadily over the past two years as the demand surge that occurred during and immediately after the pandemic has abated. Exacerbating this trend, heightened uncertainty around trade generally and tariffs specifically likely contributed to very weak demand growth during the first two quarters of 2025. During the third quarter, demand turned positive, posting the strongest net absorption since mid-2024. Despite this, four-quarter rolling net absorption has fallen from a high of around 100 million square feet (msf) in the first quarter of 2025 to less than 50 msf in Q3, a 10-year low. For perspective, pre-COVID U.S. industrial net absorption was typically 200 to 300 msf per year.
For its part, new supply (completions) also continued to slow from a recent peak of nearly 140 msf at the end of 2023 to less than 50 msf as of the third quarter. With supply still running ahead of demand, overall availability continued to rise to 9.3% at the end of the third quarter, the highest level since 2015.
FIGURE 19
INDUSTRIAL SUPPLY AND DEMAND

Source: CBRE-EA, 2025 Q3
While tenants continue to evaluate the impact of tariffs on demand and profitability, new trade wrinkles continue to emerge. For example, the end of the de minimis exception for small parcels has been one of the most understated yet impactful changes in trade policy to come from the current administration8. Nearly 1.4 billion duty-free packages entered the U.S. in 2024. According to the UN’s Universal Postal Union, there has been a measurable difference in the volume of packages coming into the country. After the termination of the exception, which allowed packages valued below $800 to enter the U.S. duty-free, total postal shipments to the U.S. had fallen 81% since August 29th9. National postal carriers in countries such as Germany, France and Japan temporarily suspended shipping packages to the U.S. to develop new systems for compliance.
Those most sensitive to this change in policy have been U.S. shoppers, small businesses and the formerly booming direct-to-consumer e-commerce that rose to prominence directly after the pandemic. As seen in Figure 20 below, the growth in de minimis imports has followed the post-pandemic boom in e-commerce.
FIGURE 20
DE MINIMIS PACKAGES SINCE 2020

Source: CBP.gov
Not surprisingly, the earlier period of surging demand, well ahead of new supply, resulted in rapidly falling availability and rising rent. Indeed, by the end of 2022, year-over-year growth in average industrial rents briefly touched 14% nationally and much higher levels were recorded in specific markets where this supply and demand phenomena was most acute, such as Southern California. In response to rent and value growth, industrial space completions rose quickly during 2023 and 2024, just as the surging demand began to normalize, resulting in today’s higher-than-average availability rate of 9.3% and little or no year-over-year average rent growth.
FIGURE 21
INDUSTRIAL AVAILABILITY AND RENT GROWTH

Source: CBRE-EA, 2025 Q3
While some normalization has taken place in the months since “Liberation Day,” the market is still defined by significant uncertainty. The average U.S. industrial market has seen YTD increases in availability of around 100 basis points, with southwestern markets such as San Antonio, Las Vegas and Austin seeing much higher increases. Per CBRE, the markets with the current highest levels of availability are Charleston, Austin and San Francisco at 17%, 16.8%, and 15.6% respectively.
FIGURE 22
INDUSTRIAL AVAILABILITY RATE IN Q3 VS. YEAR-END 2024

Source: CBRE-EA, 2025 Q3
While lower than the extreme levels announced on and around Liberation Day, the trade-weighted effective tariff rate remains near 18%10, with the effective tariff rate with China falling below 50% following the recent meeting between Presidents Trump and Xi, still concerning for West Coast ports. For example, the ports of Seattle and Tacoma reported a 20% reduction in trade volume in September from the previous year. Against this backdrop, we expect near-term leasing activity in port markets to remain soft as tenants and logistics firms continue to assess tariff impacts on their businesses, particularly in the e-commerce sector. Overall, vacancy/availability is expected to continue leveling off in late 2025 and begin tightening in 2026 as the supply pipeline continues to slow. Looking ahead, we expect demand to continue normalizing toward pre‑pandemic drivers including more sustainable e-commerce growth, just‑in‑case inventorying and 3PL expansion. At the same time, general economic uncertainty and tariff-related inflation concerns should help slow new industrial construction even more. Near-term rent growth will likely be more modest relative to previous expectations; however, long-term rent growth expectations remain solid.
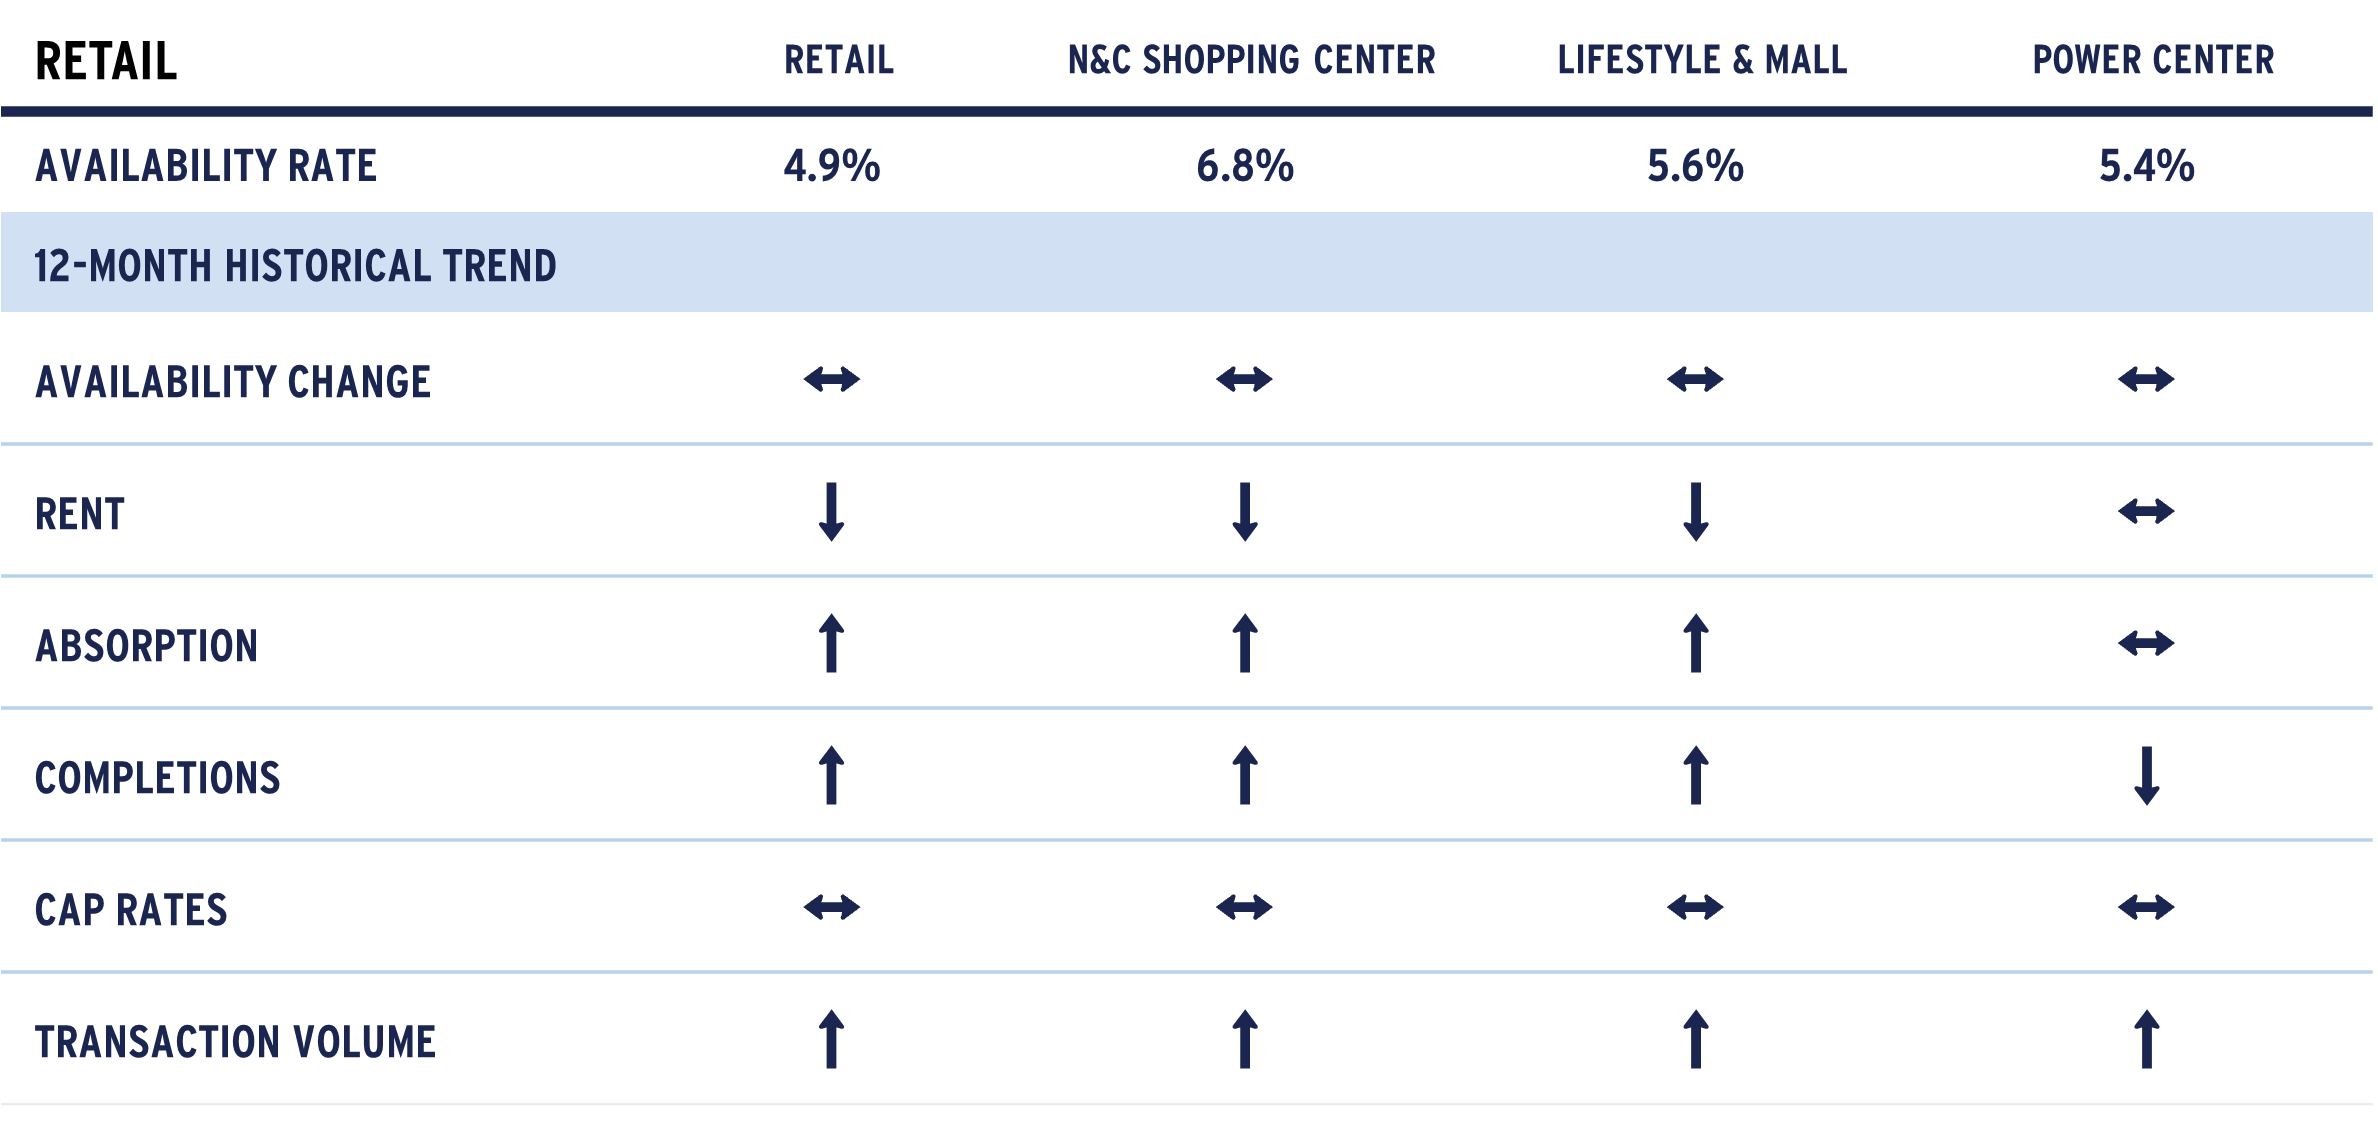
Retail
In Q3 2025, the U.S. retail real estate sector showed signs of rebalancing. National availability rose slightly to 4.9%, up from 4.7% a year earlier, though unchanged from Q2. While still historically low, this modest increase reflects a gradual easing of the tight conditions seen in 2022 and 2023.
FIGURE 23
RETAIL FUNDAMENTALS

Source: CBRE-EA ,2025 Q3
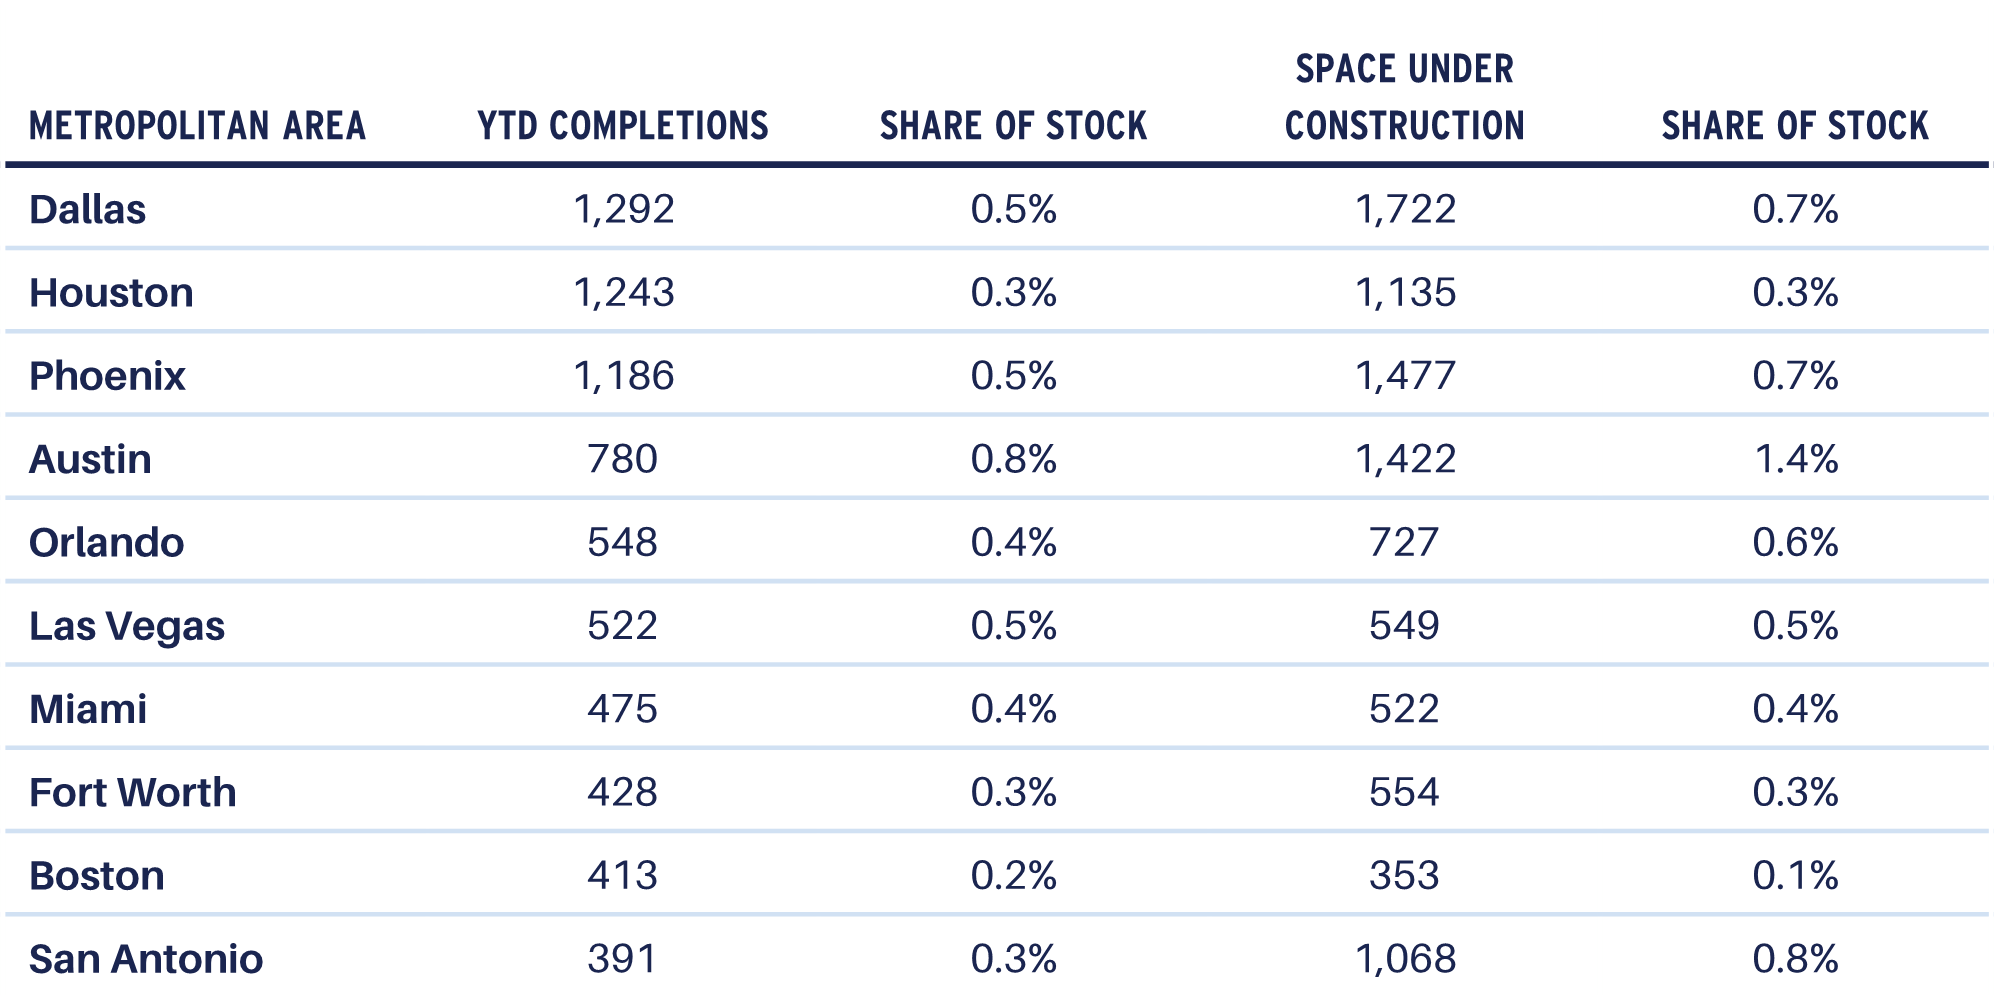
Construction activity remains subdued. Just 5.1 million square feet (msf) of new retail space was delivered in Q3, bringing the year-to-date total to 13.8 msf—well below the 20 msf delivered in the same period of 202411. Inventory grew by only 0.3% year-over-year, as developers continue to favor necessity-based centers and redevelopments over speculative mall projects. Experience-oriented and grocery-anchored formats dominate new construction while the small pipeline helps prevent oversupply and supports long-term market stability.
TABLE 3
TOP 10 MARKETS BY YTD COMPLETIONS
Source: CBRE-EA
Retailer demand stabilized after a weak first half of the year. Net absorption turned positive at 1.8 msf in Q3, a rebound from earlier quarters but still below 2024’s quarterly average of 6.2 msf12. Vacant spaces from recent closures are being refilled or repurposed, and new stores are opening in select projects and markets. Leasing activity is steady, led by value and grocery chains, while others remain cautious amid ongoing e-commerce pressures. The slight rise in availability reflects a shift toward a more balanced market, though space remains scarce in prime locations, with many areas still reporting waiting lists.
The modest increase in availability has tempered rent growth, giving retailers slightly more leverage. However, the sector’s structural undersupply, stemming from a decade of limited development, continues to support healthy fundamentals. Many shuttered stores have been replaced by discount grocers, fitness centers and entertainment venues, keeping occupancy high. Grocery-anchored neighborhood centers are especially tight, while some Class B malls and power centers contribute to localized vacancies, often addressed through redevelopment.
New construction remains cautious, with Q3 deliveries totaling just over 5 msf, down from 6.6 msf in Q3 202413. A majority of current projects are open-air centers or mixed-use developments, often pre-leased to strong tenants. High construction costs and financing challenges have curbed speculative building, with developers focusing on proven demand in growing suburbs and top-performing districts. Few new enclosed malls are being built, and most large projects blend retail with residential or entertainment uses.
The construction that is occurring is targeted, favoring experiential retail and major redevelopments. New formats emphasize food, entertainment and multichannel capabilities, with this focus on qualitative improvements to the existing retail stock making the sector more competitive without adding too much to vacancy. The pipeline remains subdued, with high interest rates and long entitlement timelines slowing project starts. Supply growth is expected to remain moderate in the near-term.
In summary, Q3 2025 reflects cautious growth and a shift toward normalization. Supply is slowly increasing, and availability has edged up, but fundamentals remain strong. Landlords are focused on differentiation and tenant retention, while retailers are leveraging limited supply to secure prime locations. After years of volatility, the sector is settling into a sustainable equilibrium, positioning it for steady performance ahead.
1 Federal Reserve Reform Act of 1977. November 16, 1977.
2 See https://www.aew.com/research/f...
3 “23 States in Recession Reveal the Fragility of the U.S. Economy”. Mark Zandi, Chief Economist at Moody's Analytics. October 22, 2025.
4 “Immigration Policy and Its Macroeconomic Effects in the Second Trump Administration.” Wendy Edelberg, Stan Veuger, and Tara Watson. AEI Economic Perspectives. July 02, 2025.
5 “What the data says about immigrants in the U.S.” Stephanie Kramer and Jeffrey S. Passel. August 21, 2025. https://www.pewresearch.org/sh...
6 “Why the Decline in the Foreign-Born in the Monthly Household Survey in 2025 Is Very Likely Real.”Steven A. Camarota and Karen Zeigler. October 8, 2025. www.cis.org
7 CoStar Q3 2025 U.S. Office Report
8 Data from CBP.gov, section 321 BOL – De Minimis. https://www.cbp.gov/trade/basi...
9 “Press Release: UPU launches solution to move mail as postal flows to US reach near standstill”, 6/9/2025
10 https://budgetlab.yale.edu/res...
11 CBRE-EA Total Retail Q3 2025 Fundamentals
12 CBRE-EA Fundamentals History
13 CBRE-EA Fundamentals History
For more information, please contact:
MICHAEL ACTON, CFA®
Managing Director, Head of Research & Strategy, North America
michael.acton@aew.com
+1.617.261.9577
JAY STRUZZIERY, CFA®
Head of Investor Relations
jay.struzziery@aew.com
+1.617.261.9326
This material is intended for information purposes only and does not constitute investment advice or a recommendation. The information and opinions contained in the material have been compiled or arrived at based upon information obtained from sources believed to be reliable, but we do not guarantee its accuracy, completeness or fairness. Opinions expressed reflect prevailing market conditions and are subject to change. Neither this material, nor any of its contents, may be used for any purpose without the consent and knowledge of AEW. There is no assurance that any prediction, projection or forecast will be realized.
