“It was the best of times, it was the worst of times, it was the age of wisdom, it was the age of foolishness, it was the epoch of belief, it was the epoch of incredulity, it was the season of light, it was the season of darkness, it was the spring of hope, it was the winter of despair.”
Charles Dickens
U.S. economic data, delayed by the prolonged fourth-quarter federal government shutdown, are slowly catching up to pre-shutdown release schedules and are revealing a mixed view of overall economic strength. To the positive, U.S. real GDP growth accelerated in both the second and third quarters of 2025 and the current real-time estimate from the Atlanta Federal Reserve calls for annualized Q4 growth of 4.2%1, which would imply year-over-year growth for 2025 of slightly less than 3%, nearly matching 2023 and well ahead of the less than 2.5% growth for 2024. Reflecting this, investors continue to drive U.S. equity market valuations to record levels with indices such as the S&P500 finishing 2025 up more than 16% over 2024.
FIGURE 1: S&P500 INDEX

Source: Standard & Poor’s
In contrast, U.S. employment growth continues to wane with year-over-year growth slowing every month in 2025, particularly since the April “Liberation Day” announcement of the new U.S. tariff regime. For the year, the U.S. added slightly more than 500,000 new jobs, the smallest annual increase since the Global Financial Crisis (GFC), aside from the 2020 pandemic. For its part, consumer sentiment finished 2025 at one of the lowest levels ever recorded, a level typically associated with past economic recessions.
FIGURE 2: U.S. EMPLOYMENT GROWTH

Source: Bureau of Labor Statistics (BLS)
FIGURE 3: CONSUMER SENTIMENT INDEX

Source: University of Michigan, as of December 2025
Not surprisingly, conflicting economic and investor/consumer sentiment data, what Dickens might have called 'the best of times and the worst of times', has heightened concern for the near-term economic outlook. Currently, we see little reason to expect a recession during 2026 as there is simply too much stimulus already in the economy, with more to come. Most significantly, the sheer volume of capital investment currently flowing into artificial intelligence (AI), the chips that power it and the data centers that house it is staggering, and this will only likely accelerate, at least in the near-term. For perspective, the most recent national accounts (GDP) data show the most recent four-quarter increase in U.S. nominal GDP was nearly $1.6 trillion2. Over the same period, private investment in information processing equipment (e.g., data centers and advanced chip manufacturing plants) totals approximately $1.4 trillion.
FIGURE 4: NOMINAL GDP GROWTH AND DATA CENTER CAPITAL INVESTMENT

Source: Bureau of Economic Analysis (BEA), as of 2025 Q3
While this in no way implies that the growth occurring in the U.S. economy is coming entirely from data center construction, it does help conceptualize the absolute size of that investment. Looking ahead, the companies driving this investment, the so-called Magnificent Seven technology companies, have committed to investing more than five trillion dollars in this area over the next decade. When AI and Mag 7 adjacent companies are included, this number may grow to as much $7-$8 trillion according to various estimates3.
FIGURE 5: MAGNIFICENT SEVEN AI-RELATED PROJECTED CAPITAL INVESTMENT

Source: Company report and earnings call transcripts, as of 2025 Q3
In addition to outside capital investment, it is expected that typical refunds to U.S. taxpayers will be much larger than normal this year, roughly 20% to 30% bigger depending on household income. The primary reason for this is the implementation of various temporary tax cuts included in the omnibus tax and spending bill known as the “One Big Beautiful Bill.” These tax cuts include such things as no tax on tipped or overtime income, reduced tax on some social security income and a greater deduction limit for state and local taxes (SALT), as well as more permanent increases to the standard deduction. In 2024, IRS tax refunds totaled nearly $300 billion and most current estimates suggest aggregate refunds will be 20% to 30% larger, an increase of $50 to $100 billion. Not surprisingly, analysts expect higher than normal tax refunds to spur greater consumer spending and overall economic activity, adding as much 0.25% to 0.50% to the GDP growth rate if consumers are confident enough to spend.
TABLE 1: EXPECTED INCREASE IN TAX REFUNDS BY HOUSEHOLD INCOME LEVEL
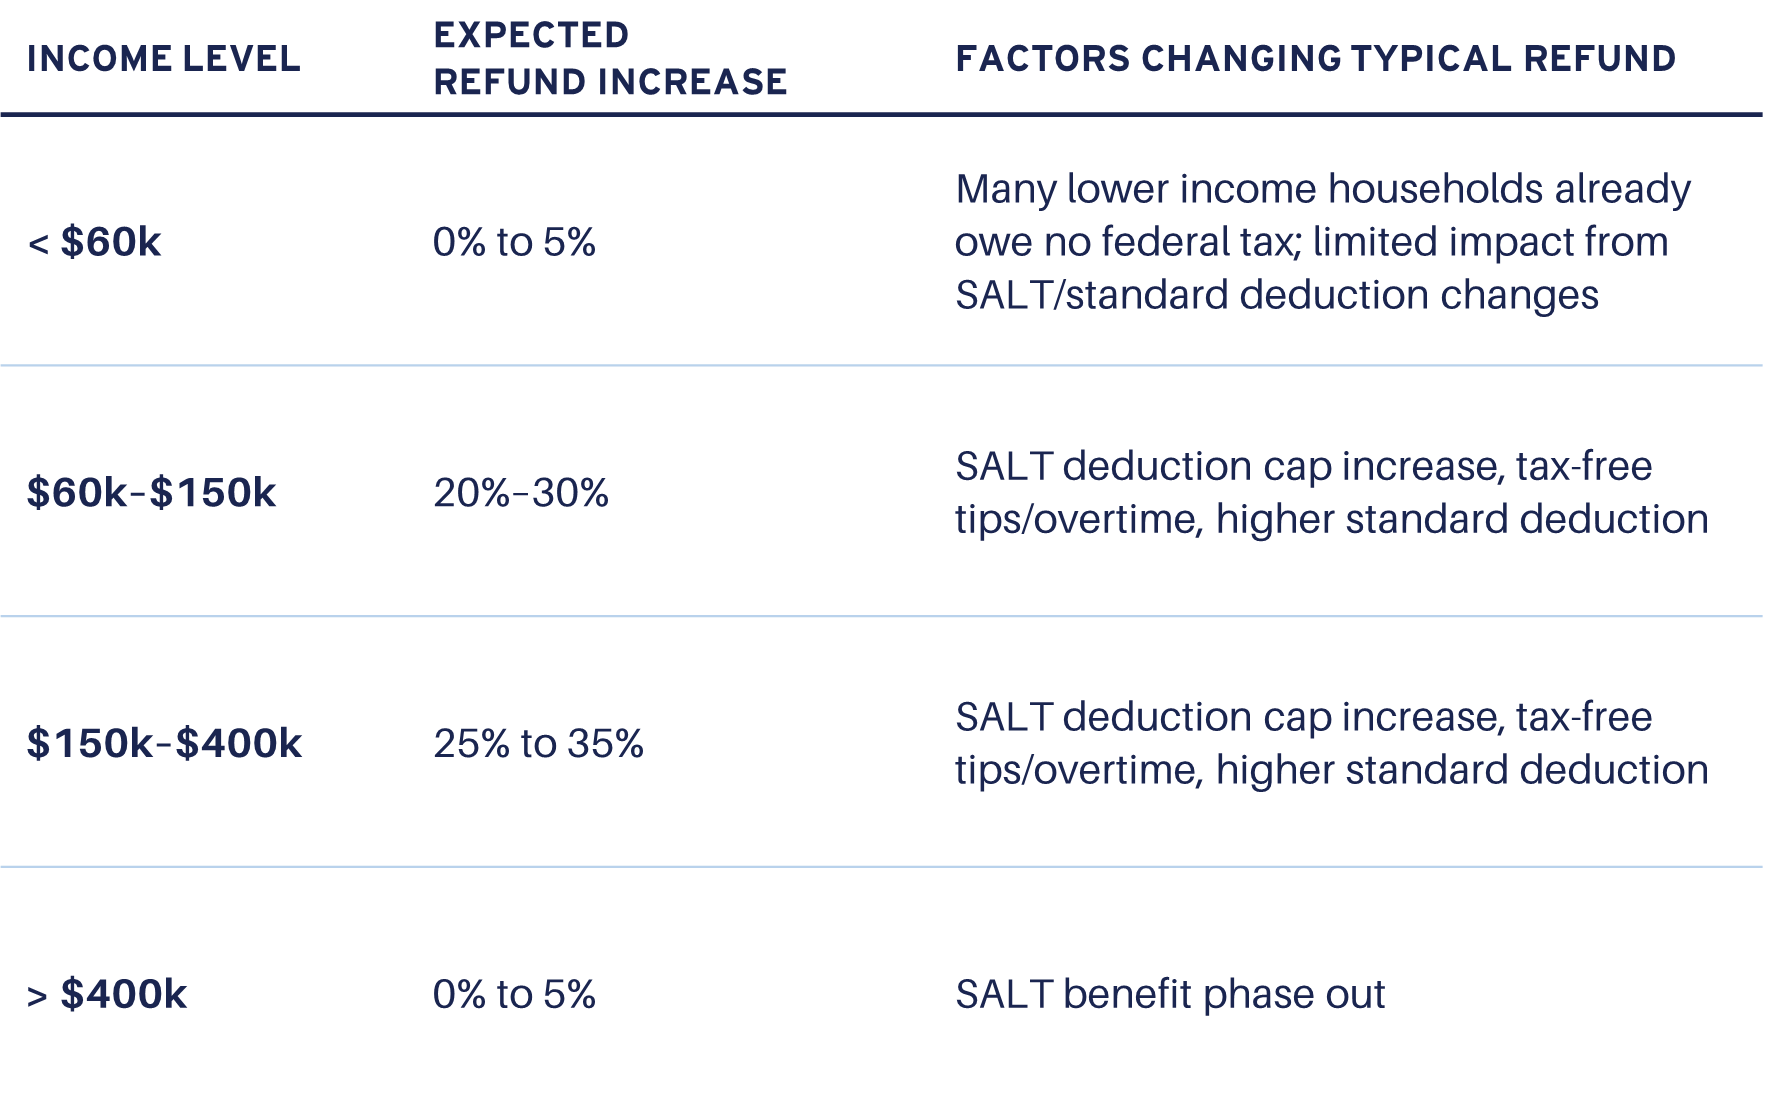
Sources: Treasury, Internal Revenue Service (IRS), Piper Sandler, as of January 2026
We also note that 23 states (including the District of Columbia) will see increases in the state minimum wage during 2026. While many of these scheduled increases are moderate, in line with inflation, workers in several states such as Hawaii, Nebraska and Michigan will experience double-digit increases in the state minimum wage, again providing significant near-term spending stimulus.
TABLE 2: SCHEDULED INCREASES IN STATE MINIMUM HOURLY WAGE
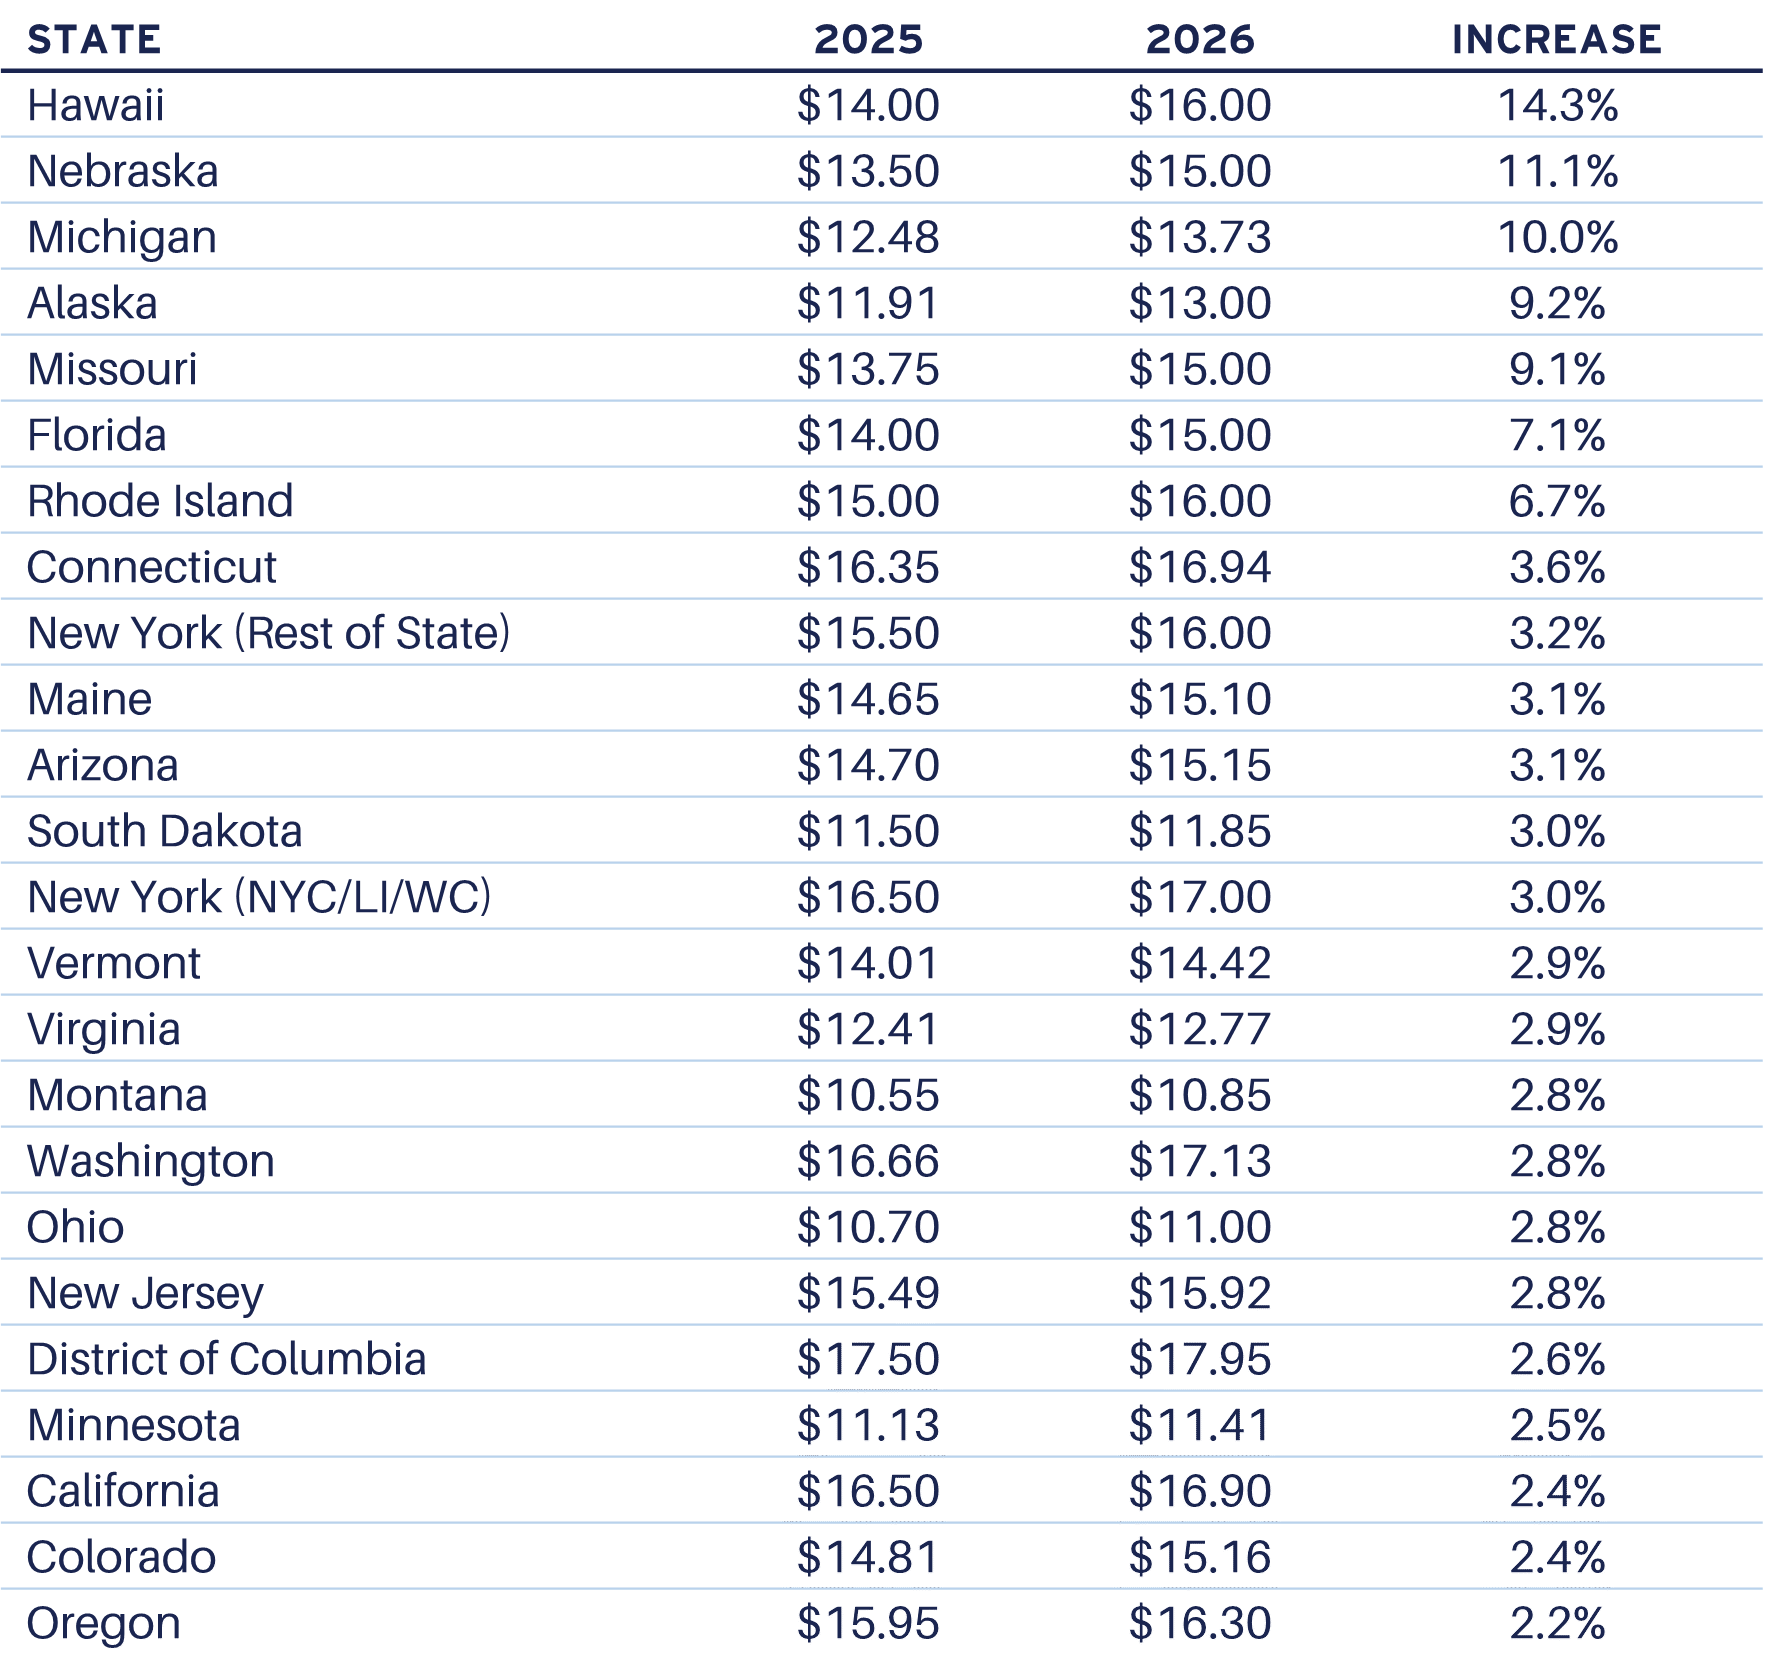
Source: Various, as of January 2026
Near-term stimulus aside, recent U.S. Census Bureau estimates suggest U.S. population growth slowed significantly during 2025, largely the result of much slower net foreign immigration4. According to the Census Bureau, total foreign immigration to the U.S. during 2025 is estimated to be approximately 1.2 million, well below the 2.7 million in 2024 and 2.2 million in 2023. Currently, the Census Bureau expects slower foreign immigration to the U.S. to continue during 2026 and is currently projecting total population growth of only 0.2% for the year. We note that numerous reports from groups outside of the Census Bureau suggest much lower net immigration during 20255. For example, Brookings estimates that net foreign immigration was likely negative for 2025, perhaps as low as -300,000. If correct, the Census Bureau estimate of 2025 total population may prove to be above actual and the projected growth for 2026, while quite modest, may also be overly optimistic.
FIGURE 6: U.S. POPULATION ESTIMATE FOR 2025 AND PROJECTION FOR 2026

Source: U.S. Census Bureau, January 2026 Estimates
While near-term aggregate population appears constrained, there will continue to be significant growth in specific age groups. Figure 7 shows the U.S. population by one-year age cohorts and makes clear where we expect significant temporal growth. Ages where the red arrow is downward sloping will see an increase in cohort size as the larger number of people behind that group age into that group each year. Conversely, ages where the red arrow is upward sloping will, absent offsetting foreign immigration, experience a shrinking cohort as the smaller group behind ages in. While there will be meaningful positive change in the size of the 40-50 year old group and negative change in the size of the 20-30 year old group, these will both be overshadowed by tremendous built-in growth in the older age groups as the large Baby Boom begins to turn 80 this year (people born in 1946). To put this in perspective, the Census Bureau estimates there are currently nearly 45% more people age 79 than age 80, reflecting the start of accelerated post-war births in 1946 as compared to lower war-time births in 1945.
FIGURE 7: U.S. POPULATION BY ONE YEAR AGE COHORTS

Source: U.S. Census Bureau, as of 2025 Q4
Finally, despite generalized concerns of slowing employment and labor force growth, the larger backdrop of significant near-term stimulus seems likely to temper moves by the Federal Reserve to further ease monetary policy. While we expect the Fed to further cut policy rates during 2026, most likely after the current chairman steps down in May, we also expect the yield curve to continue to steepen (i.e., long yields will decline less than short yields), limiting any near-term boost to property market valuations from generalized yield compression.
Commercial Property Outlook
Through 2025, U.S. commercial property delivered positive total returns in each quarter, almost entirely from income, not appreciation. While we believe the next cycle of positive property appreciation began during the second half of 2024, property value increases have thus far been limited and the NCREIF Property Index (NPI+) capital value index is essentially unchanged since mid-2024.
FIGURE 8: NCREIF PROPERTY INDEX (NPI+) QUARTERLY RETURN

Source: NCREIF
Across property sectors, there has been a wide range in performance over the past year, with seniors housing both exceeding the total return of all other property sectors in each of the last four quarters and also accelerating away from the other major sectors. These differences in property sector total return performance over the past year are largely explained by significant differences in property net operating income (NOI) growth, with seniors housing (+21%) and office properties (-6%) representing the two extremes of K-shaped growth.
FIGURE 9: 2025 NPI+ QUARTERLY TOTAL RETURN BY PROPERTY SECTOR

Source: NCREIF, 2025 Q4
FIGURE 10: K-SHAPED PROPERTY PERFORMANCE: NOI GROWTH BY PROPERTY SECTOR, 2024 Q4 = 100

Source: NCREIF, 2025 Q4
Looking ahead, we expect seniors housing to continue to lead in NOI growth given the demographic story described above. Outside of seniors, there is little current consensus for significant outperformance, and expected growth is range bound across most property sectors, largely between 3% to 4% expected growth. From this, we suggest that property investment performance will be driven not by overweighting specific sectors or even specific markets but rather by more traditional real estate investment skills including asset selection, property and asset management, and sell discipline.
FIGURE 11: EXPECTED AVERAGE ANNUAL NOI GROWTH BY PROPERTY SECTOR

Source: Green Street January 2026
Conclusion
The next property valuation up-cycle has begun but progress has been slow and variable, and we expect this to continue through 2026. Uncertainty will continue to weigh on decision makers, but significant stimulus will likely stave off recession. We believe the next few years will be a period that rewards fundamental property investment skill over sector or market bets; pick the best property in the best location, maintain occupancy and control expenses, and be thoughtful about the additional capital invested. Investment skill is, of course, important in all time periods but we would argue that for most of the period following the Global Financial Crisis (GFC), valuation creation simply from ever compressing interest rates and property yields overwhelmed value creation from traditional real estate investment and asset management skill. In a world where yield compression is much less likely, we think property investment skill will be what shapes investment outcomes once again.
Office
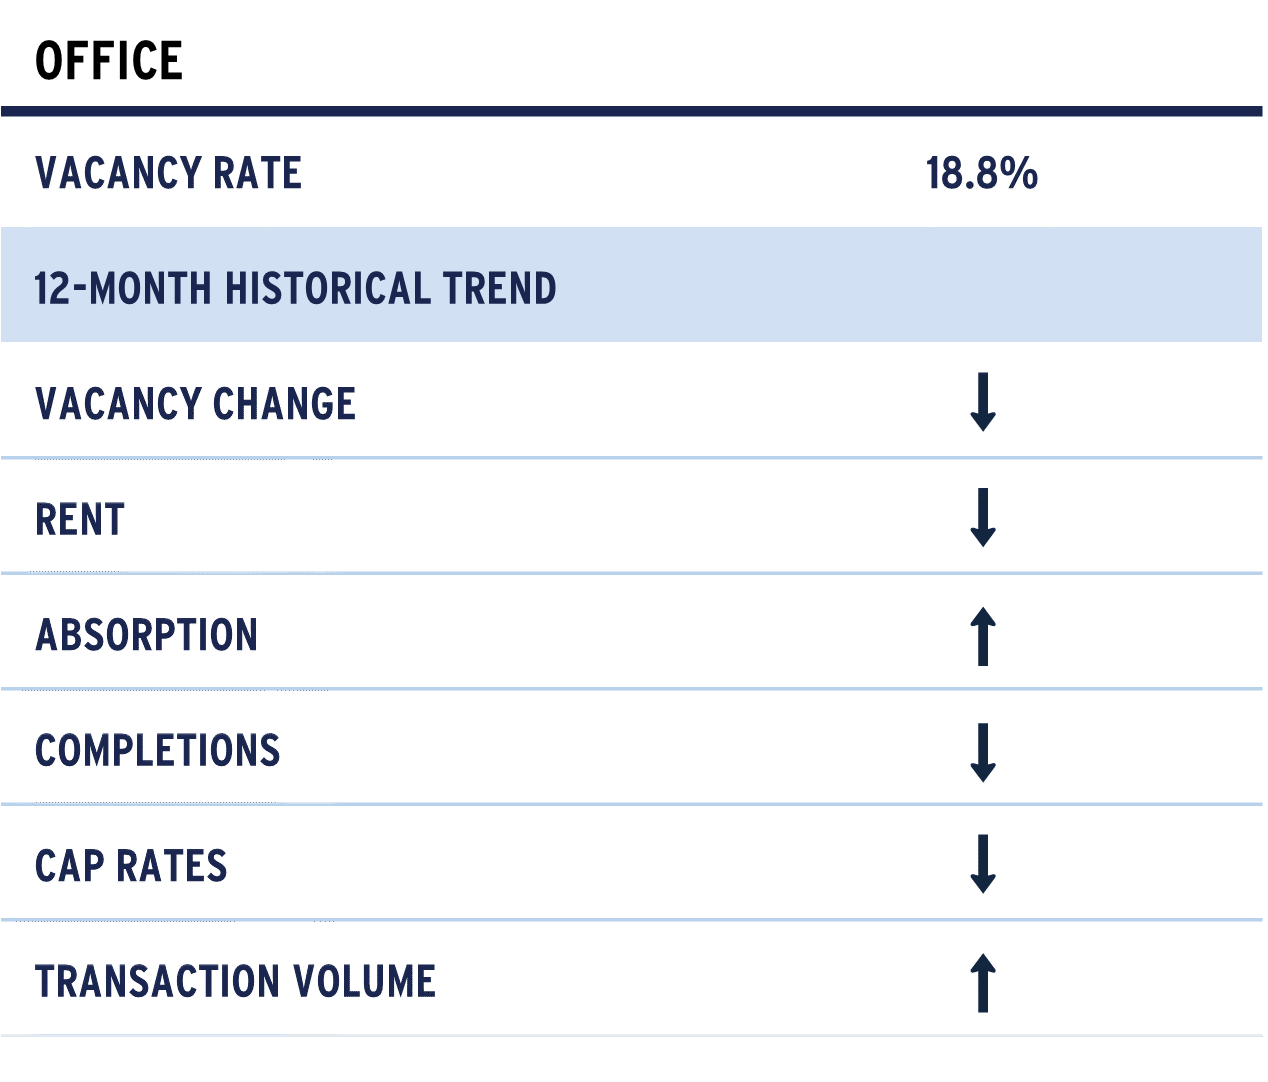
The office market appears to have plateaued, with signs of recovery emerging in various locales. Persistently high vacancy, including in top-tier assets, has eroded landlord leverage and shifted negotiating power firmly toward tenants. While a few newly built, high-end properties have secured favorable leases, these are outliers. Overall, leasing activity backed off in the fourth quarter, but is very locationally bifurcated, and vacancy remained steady overall. Absorption turned positive in buildings over ten years old for the first time since 2018, suggesting a depth to this absorption. Notably, New York and Dallas stand out, with strong demand for prime space driven by the robust office attendance and steady leasing by financial services firms. Meanwhile San Francisco has picked up significant momentum in the fourth quarter, with absorption the second highest among the top 10 markets, the beginning of what will likely be a long recovery from record vacancy.
According to CBRE, leasing activity declined significantly in Q4, with absorption falling from 27% above pre-pandemic averages to 33% of the pre-pandemic levels. Top-tier buildings benefited the most, leading to total vacancy holding steady at 18.8% in Q4. Availability also declined slightly to 24.1%. Sublease space now accounts for 1.7% of vacancy while direct vacancy increased slightly to 17.0% (from 1.8% and 16.9% in the third quarter). Q4 absorption did outpace the total for the first half of 2025.
Return-to-office directives frequently accompany portfolio rightsizing, relocations or headcount reductions, muting net demand for square footage. New York and Phoenix are the only major markets that have posted five or more straight quarters of positive absorption, while other urban markets struggle with weaker demand amid economic uncertainty and space givebacks. Dallas’ one-year absorption remains above its pre-COVID average, while San Francisco’s annual volumes are slightly above half of their pre-COVID levels, with the lion’s share of the absorption taking place in the fourth quarter. The balance between productivity gains from automation and corporate efforts to bring employees back in person is still too early to call in terms of its lasting effect on office requirements.
Absorption trends across the top 10 markets differ drastically. New York and Dallas posted well above-average net absorption over the past year, with San Francisco and Washington D.C. also in positive territory, albeit below longer-term averages. In contrast, Boston, Atlanta, Chicago, Los Angeles, Houston and Seattle lag behind, with net negative absorption and performance below their 2010–2019 averages. This divergence reflects uneven recovery paths shaped by local demand drivers and market-specific challenges. These factors, including migration patterns, economic drivers and space utilization preferences, will need to be monitored to understand the durability of recent trends and identify market opportunities.
FIGURE 12: ANNUAL VS. LONG-TERM AVERAGE ABSORPTION

Source: CBRE-EA, 2025 Q4
Occupiers are steadily rightsizing, favoring smaller, more efficient footprints. Average lease sizes are now 15–20% below prior norms. This downsizing trend is likely to continue as large corporate tenants with 7- to 10-year lease terms realign their space commitments with new work practices. Headcount growth has stalled, with BLS data showing a decline of roughly 400,000 in major knowledge industry employment payrolls since the peak in April 2023.
A more active transaction environment is sharpening price discovery and improving visibility into valuation write-downs. Owners and lenders are increasingly opting to dispose of distressed properties, while investors are becoming more comfortable underwriting returns at reset pricing. At the same time, the gap between resilient, competitive assets and those edging toward obsolescence remains wide, pushing some landlords to explore conversion or demolition. In fact, while roughly 40 million square feet (msf) was delivered in 2025, more than 30 msf was removed from inventory. NCREIF’s equal-weighted cap rate index for office declined slightly to 5.7% in Q4 from just over 6% in Q1.
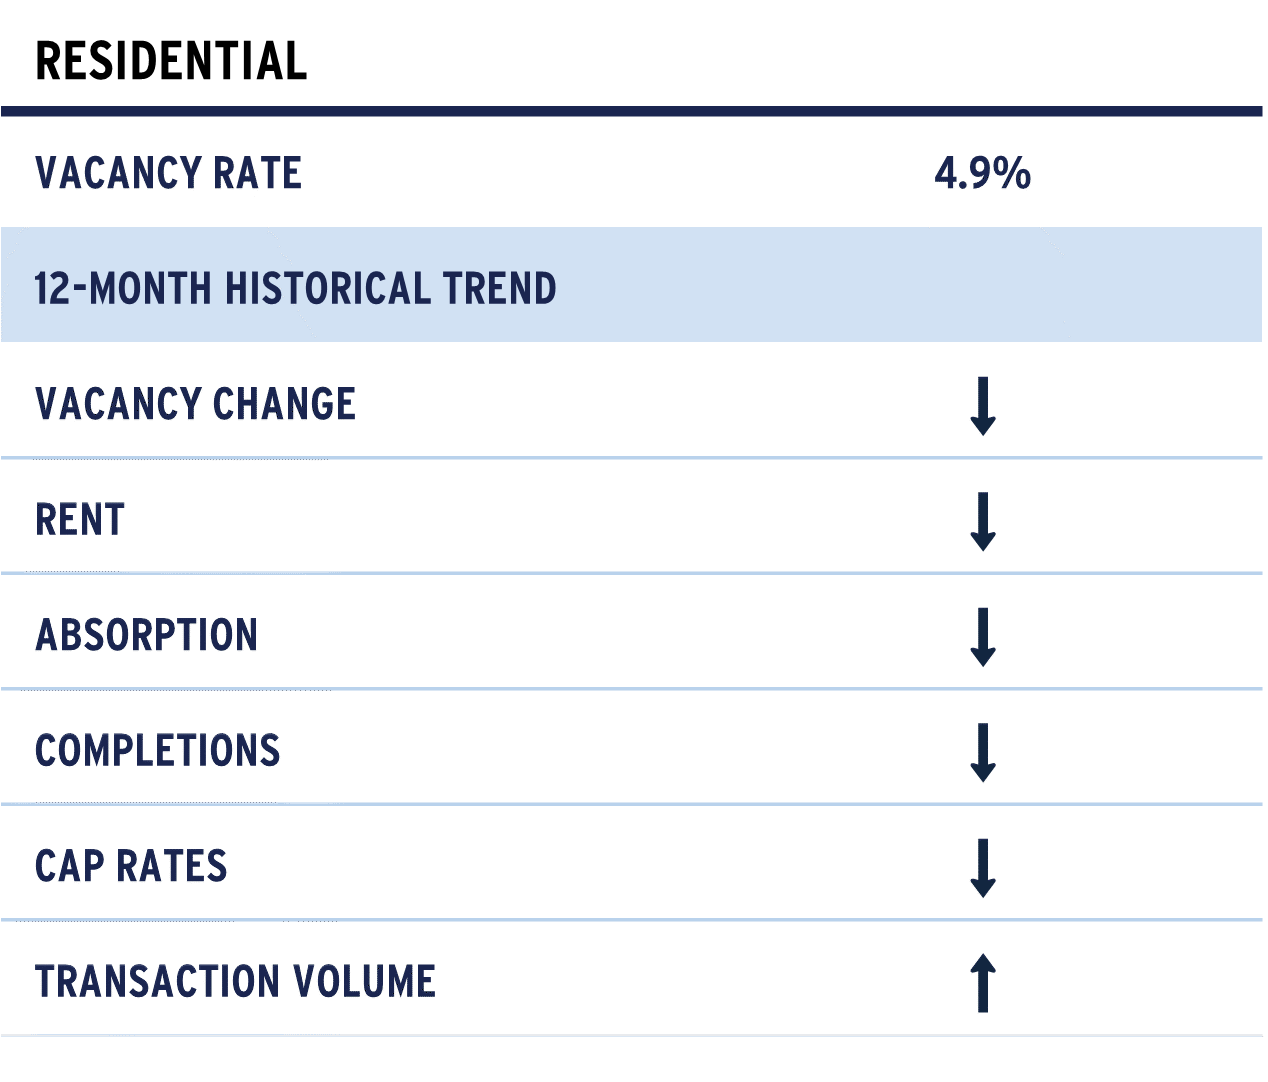
Apartment
Multifamily fundamentals continued to moderate through year‑end 2025 as the market moved further past the peak supply pressures of the prior two years. Rolling four‑quarter completions declined to 367,000 units, down from both Q3 2025 (392,000) and Q4 2024 (453,000), marking the clearest indication yet that the national construction pipeline is contracting. Rolling four‑quarter absorption also slowed, from approximately 551,000 units in Q3 to 350,000 in Q4, which likely reflects slower job growth and changes to immigration policy.
FIGURE 13: U.S. APARTMENT SUPPLY & DEMAND

Source: CBREA-EA 2025 Q4
FIGURE 14: U.S. APARTMENT VACANCY RATE & RENT GROWTH

Source: CBRE-EA, 2025 Q4
Market performance remained uneven across regions. Sun Belt metros experienced the sharpest rent pressure as elevated deliveries and heightened competition continued to weigh on pricing. Conversely, coastal and gateway markets were comparatively resilient, posting stable occupancies and more modest rent deceleration. Midwest markets remained in the middle of the distribution, showing incremental softening but relatively steady performance overall. The weakest rent expectations remain concentrated in high‑vacancy Sun Belt markets still digesting the elevated supply delivered over 2023 and 2024. In Figure 1, markets that are above the diagonal line experienced increases in overall vacancy over the past year. Markets such as Austin, Houston and Dallas are examples of places where vacancy was already elevated and rose further, constraining near-term rent growth.
FIGURE 15: APARTMENT VACANCY RATE CHANGE FROM 2024 Q4 TO 2025 Q4

Source: _CBRE-EA, 2025 Q4
Demand-side constraints became more visible in 2025 and represented the primary headwind to near-term performance. U.S. population growth slowed sharply to 0.5%—half the pace of 2024—driven largely by an unprecedented decline in net international migration, leaving the country with roughly 1.5 million fewer inbound residents than the prior year per the U.S. Census Bureau. Interstate migration also eased meaningfully. Alongside slower job growth and softer consumer sentiment, these demographic trends contributed to lagging household formation and a near-term shortfall in new renter demand. As a result, pricing power remained limited even as supply pressures eased.
Looking ahead, the supply backdrop entering 2026 is materially improved, yet softer demand continues to restrain performance. With new starts subsiding and the construction surge receding, the sector is positioned for a healthier balance over the medium-term. However, weaker macro-driven renter demand has kept rent growth subdued, elevated concession levels and pushed vacancies modestly higher. Transaction activity ticked up modestly in Q4, though rolling four‑quarter volume remained flat, suggesting the market is still searching for price discovery.
On net, U.S. multifamily fundamentals in Q4 2025 were modestly stronger than one year prior, and the sector appears to be in the later stages of bottoming before the next recovery cycle begins. While near-term softness persists—particularly in oversupplied Sun Belt metros—conditions are improving in supply‑constrained and structurally resilient markets, positioning the sector for a gradual reacceleration as demand normalizes.
Industrial
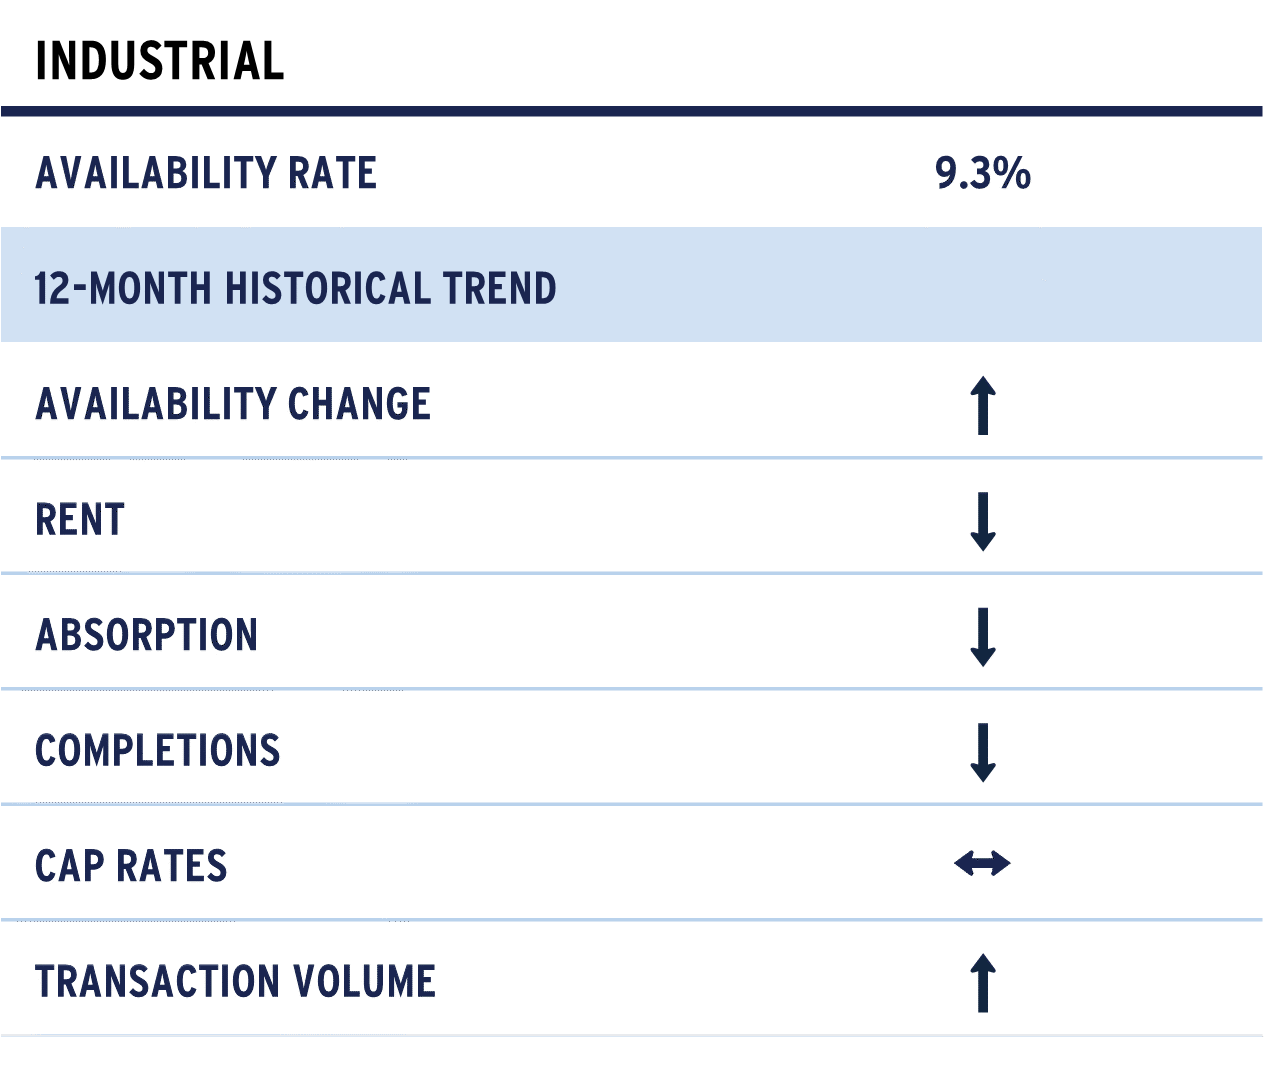
The U.S. industrial market is emerging from a period of adjustment, with sector fundamentals showing early signs of stabilization. Availability rates held steady at approximately 9.3% for the third consecutive quarter, indicating that supply and demand are gradually rebalancing and that the market is progressing toward a more normalized state. Rolling four‑quarter net absorption improved from Q3 2025, rising by 43.3 million square feet (msf) to roughly 93.0 msf, while rolling four‑quarter completions declined from 234.2 msf to 224.6 msf. Taken together with the plateauing availability rate, these shifts point to an industrial sector laying the groundwork for steadier growth in 2026.
FIGURE 16: INDUSTRIAL SUPPLY AND DEMAND

Source: CBRE-EA, 2025 Q4
FIGURE 17: U.S. INDUSTRIAL AVAILABILITY RATE & RENT GROWTH

Source: CBRE-EA, 2025 Q4
Consumption activity and the resulting logistics demand have remained resilient despite the headwinds created by new tariffs and the broader dynamics of a K‑shaped economic recovery. The U.S. economy entered 2026 on solid footing, even as tariff‑related trade distortions temporarily affected growth data throughout 2025. Underlying domestic demand remained firm, supported by resilient consumer spending that was driven disproportionately by higher‑income households. While the late‑year federal government shutdown likely softened fourth‑quarter momentum, it is not expected to alter the broader positive trajectory. The K‑shaped dynamic persists, with lower‑income households facing pressure from elevated borrowing costs and rising delinquency rates. However, with the Fed beginning to ease monetary policy and fiscal stimulus from the “One Big Beautiful Bill Act” poised to support activity, growth is expected to accelerate heading into 2026.
According to research by Cushman & Wakefield, Mexico surpassing China as the largest exporter to the U.S. has spurred rising demand for logistics space in inland markets. Shifting trade patterns have reduced the relative contribution of port‑proximate markets, whose share of annual net absorption fell to just 13% in 2025. In contrast, major inland logistics hubs—including Dallas/Ft. Worth, Phoenix, Houston, Indianapolis and Kansas City—led demand growth, underscoring the durability of interior market fundamentals. Figure 1 Top 10 Markets - Total 2025 Net Absorption
FIGURE 18: TOP 10 MARKETS - TOTAL 2025 NET ABSORPTION

Source: CBRE-EA, 2025 Q4
FIGURE 19: U.S. IMPORTS, TOP 10 COUNTRIES OF ORIGIN, NOVEMBER 2025

Source: U.S. Census Bureau, Economic Indicators Division
Although tariff policy and broader macroeconomic uncertainty remain notable risks, current conditions reflect a market moving toward equilibrium rather than one confronting renewed policy‑driven disruption. Overall, these dynamics position the industrial sector on firmer footing as it enters 2026, supported by stabilizing fundamentals and a renewed sense of confidence from both tenants and developers.
Retail
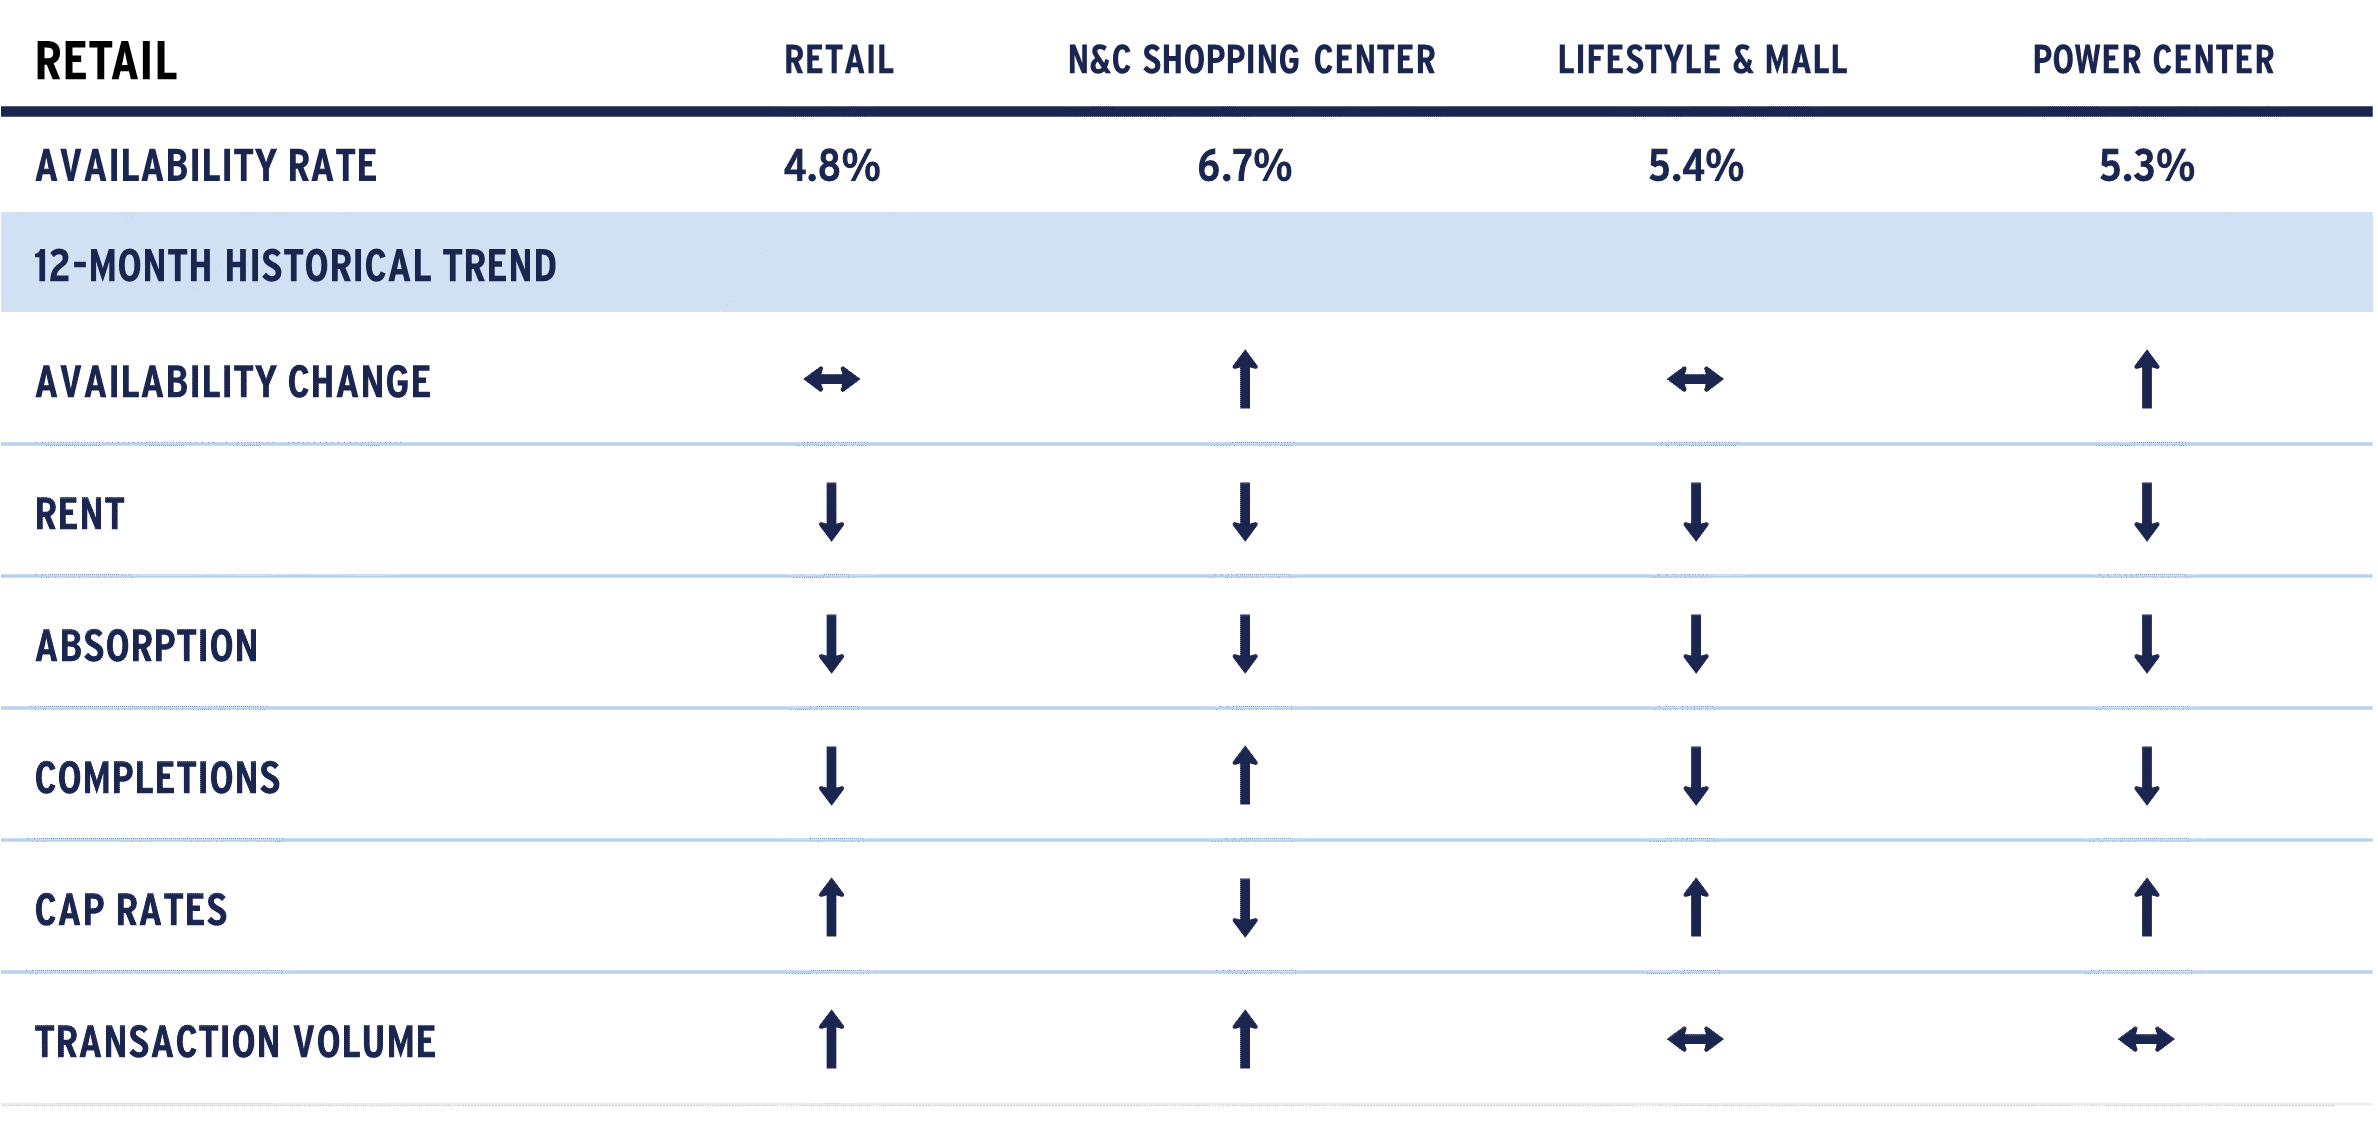
Retail fundamentals shifted modestly in the fourth quarter as the market continued to adjust. National availability fell 10 basis points to 4.8%, slightly above the 4.7% recorded a year earlier, reflecting softer demand in the second half of 2025 amid economic uncertainty. While availability remains historically low, the change underscores a gradual normalization across the sector.
FIGURE 20: RETAIL FUNDAMENTALS

Source: CBRE‑EA, 2025 Q4
Development remained historically muted. Just under 5.0 million square feet (msf) delivered in Q4, bringing 2025 completions to 24.9 msf, well below the 30.3 msf delivered in 2024. Inventory expanded only 0.3% year-over-year as construction remained constrained by elevated costs, limited capital availability and higher cap rates. Under‑construction levels remain near multi‑cycle lows, and pipelines are thin nationally.
TABLE 3: MARKETS WITH MORE THAN 1% OF INVENTORY DELIVERED IN 2025 OR CURRENTLY UNDER CONSTRUCTION
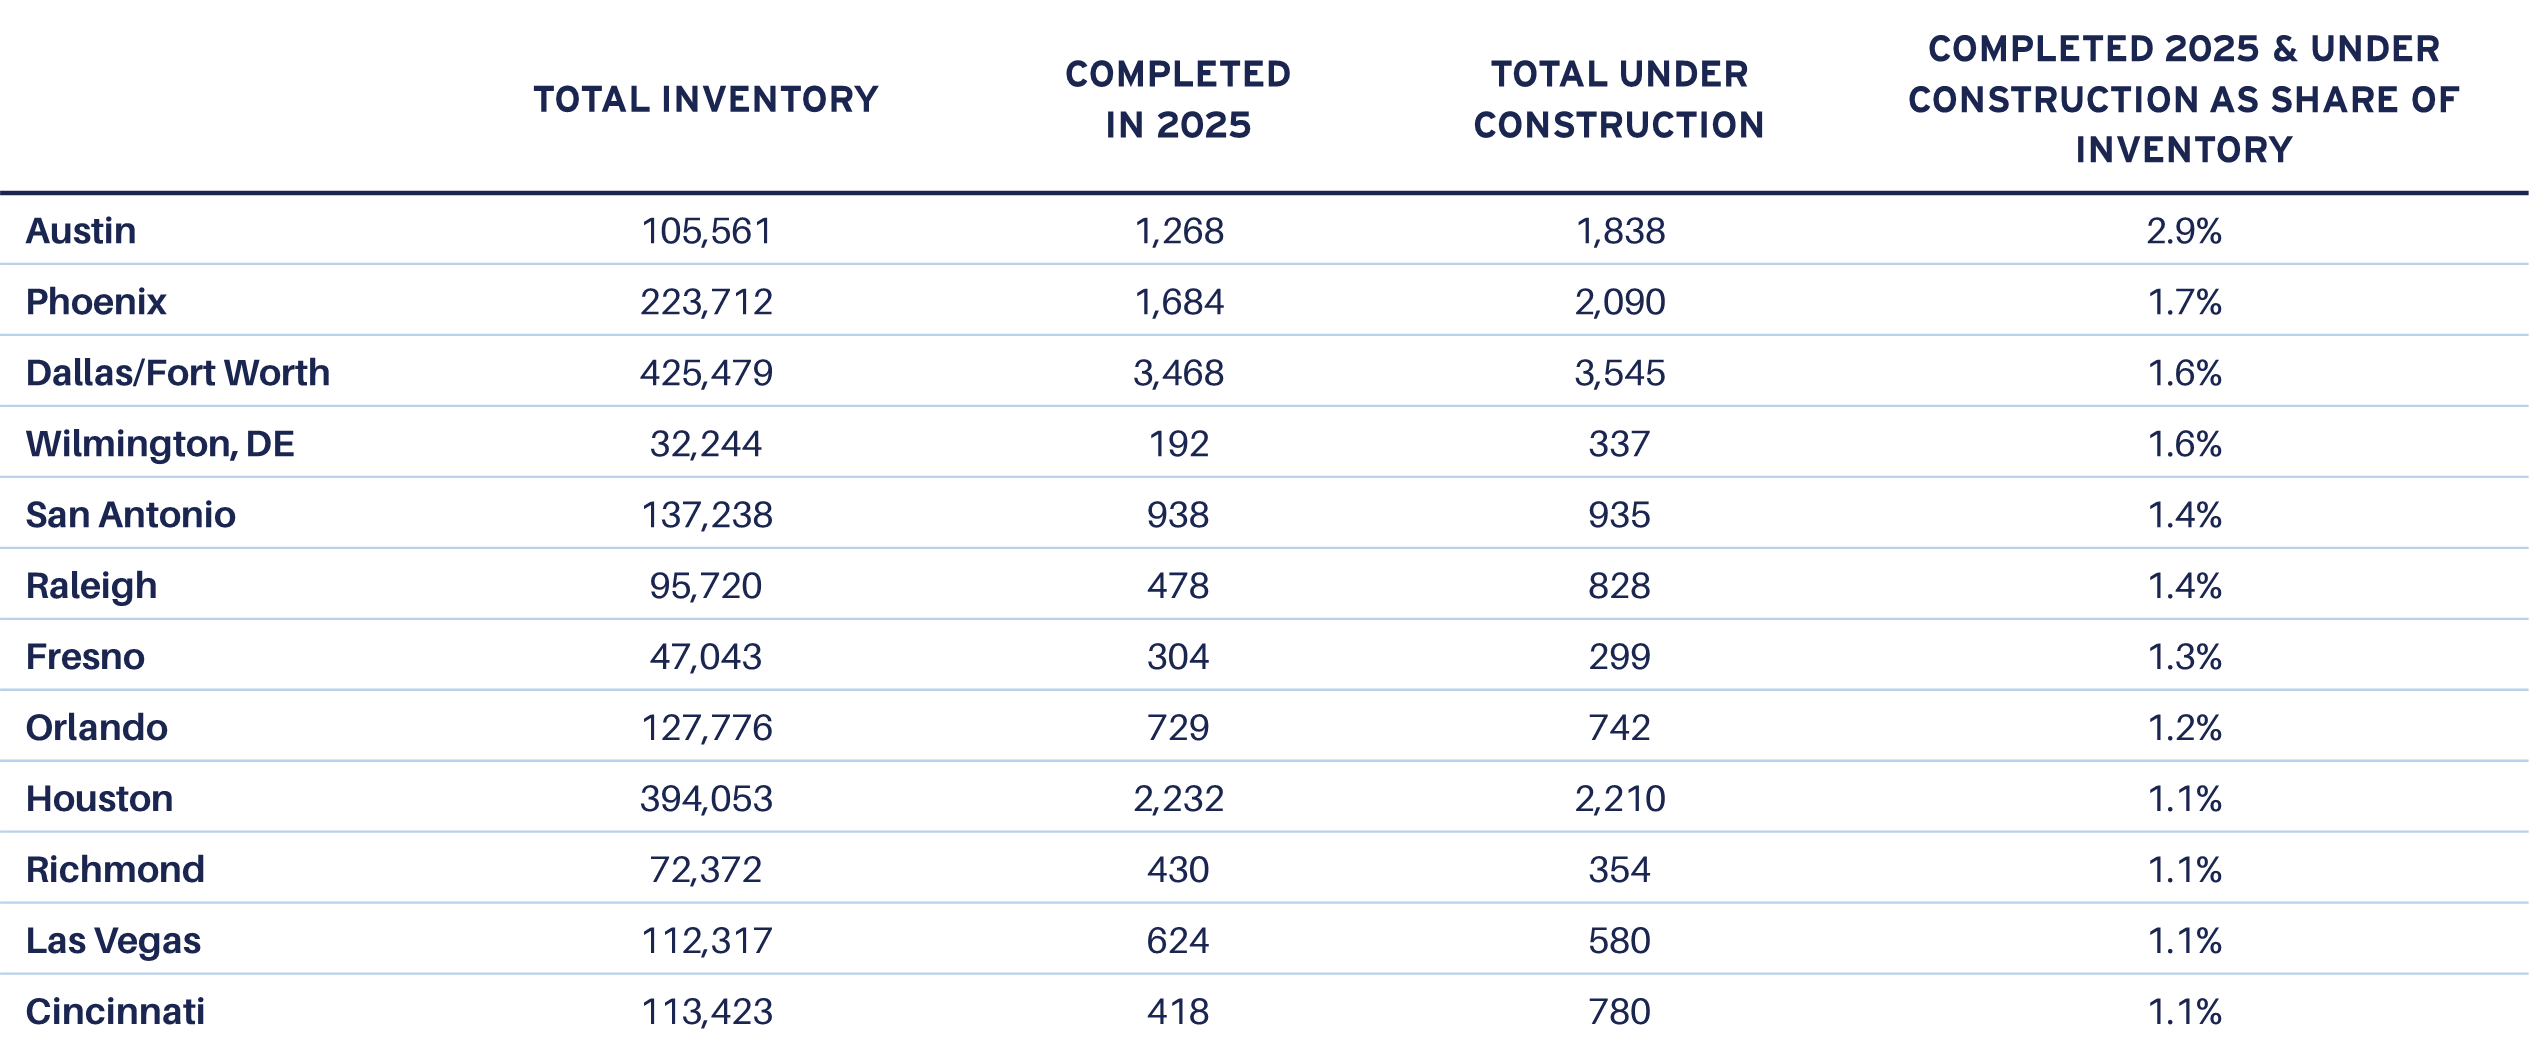
Source: CBRE-EA, 2025 Q4
Tenant demand strengthened meaningfully in Q4 after a soft start to the year. Net absorption accelerated to 11.3 msf, supported by the backfilling of recently vacated storefronts and conversions of obsolete formats. Leasing momentum improved, aided by historically tight supply, and leasing timelines shortened to just over seven months—an all‑time low—highlighting the scarcity of quality retail space.
Despite modest tightening in availability, rent growth remained measured at 1.8%, offering tenants some pricing flexibility. The slowdown reflects a broader moderation following the rapid rent gains of the prior two years. Performance was uneven: Southern markets posted above‑trend rent growth while Western markets lagged. Long‑term undersupply continues to provide a stabilizing foundation for fundamentals.
Developers remain selective, with Q4 completions of just under 5 msf, down significantly from 9.2 msf in Q4 2024. High construction costs and tighter capital availability continue to limit speculative activity, concentrating new supply in growing suburban areas and proven trade areas. Post pandemic, a modest amount of uncommitted space delivered, while more than 150 msf of obsolete inventory has been removed or repurposed.
Construction today is dominated by small‑format pads and build‑to‑suit projects for expanding restaurants, automotive uses, discount retailers and service‑oriented concepts. New developments emphasize dining, entertainment and omnichannel functionality, enhancing existing retail environments without materially increasing vacancy. With high interest rates and long entitlement timelines, project starts remain slow, and supply growth is expected to stay moderate in the near- term.
Competition for high‑quality space intensified throughout Q4, particularly among expanding service, fitness, discount and quick‑serve operators. Notably, service tenants leased more space than goods‑based tenants for the first time, signaling a structural shift toward service‑oriented, needs‑based retail.
Overall, Q4 reflects continued momentum and normalization across the sector. Limited new supply, steady tenant demand and healthier retailer balance sheets position the retail market for stable performance heading into 2026. Retailers are capitalizing on scarce prime locations, while landlords focus on differentiation and tenant retention in an increasingly supply‑constrained environment.
1 https://www.atlantafed.org/cqer/research/gdpnow
2 Four quarters ending in 2025 Q3.
3 See, for example, McKinsey Quarterly. “The cost of compute: A $7 trillion race to scale data centers”. April 28, 2025
4 “U.S. Population Growth Slows Due to Historic Decline in Net International Migration.” January 27, 2026. U.S. Census Bureau. https://www.census.gov/newsroom/
press-releases/2026/population-growth-slows.html
5 “Macroeconomic implications of immigration flows in 2025 and 2026: January 2026 update”. Wendy Edelberg, Stan Veuger, and Tara Watson. Brookings. January
13, 2026
For more information, please contact:
MICHAEL ACTON, CFA®
Managing Director, Head of Research & Strategy, North America
michael.acton@aew.com
+1.617.261.9577
JAY STRUZZIERY, CFA®
Head of Investor Relations
jay.struzziery@aew.com
+1.617.261.9326
This material is intended for information purposes only and does not constitute investment advice or a recommendation. The information and opinions contained in the material have been compiled or arrived at based upon information obtained from sources believed to be reliable, but we do not guarantee its accuracy, completeness or fairness. Opinions expressed reflect prevailing market conditions and are subject to change. Neither this material, nor any of its contents, may be used for any purpose without the consent and knowledge of AEW. There is no assurance that any prediction, projection or forecast will be realized.
