CURRENT INCOME & RENTAL GROWTH MITIGATES IMPACT OF TARIFFS
- The prime European real estate recovery is expected to stay on track. Regardless of the fast-changing news on tariffs and its related macroeconomic uncertainties, current income and projected rental growth are expected to mitigate the tariff’s impact on European prime returns.
- News on US tariffs increased trade policy uncertainty to a new record level. The 90 days pause partly reversed recent investors move from stocks into bonds. Once confirmed, higher tariffs’ long-term impact on bond yields is less clear as higher inflation will push bond yields up while lower growth and flight to safety push them down.
- The base case scenario assumes a 10% tariff, a minor downgrade for 2025-29 GDP growth. More recent news on potentially higher tariffs makes our downside scenario more likely than before -- with lower GDP growth and higher inflation and bond yields. Even then, relative to other asset types, real estate should prove a safe haven.
- Low vacancies in most European markets support solid 2025-29 prime rental growth projections, as residential is ranking top across sectors. For prime offices, we also project lower vacancy and therefore rental growth.
- Given the outlook for higher government bond yields, prime property yields are now projected to tighten less going forward. As a result, capital value appreciation is projected to be less than in our Sep-24 projections.
- Prime capital value growth is still expected in most sectors as a result of projected market rental growth. Rental growth will contribute to capital values growth even at a similar yield.
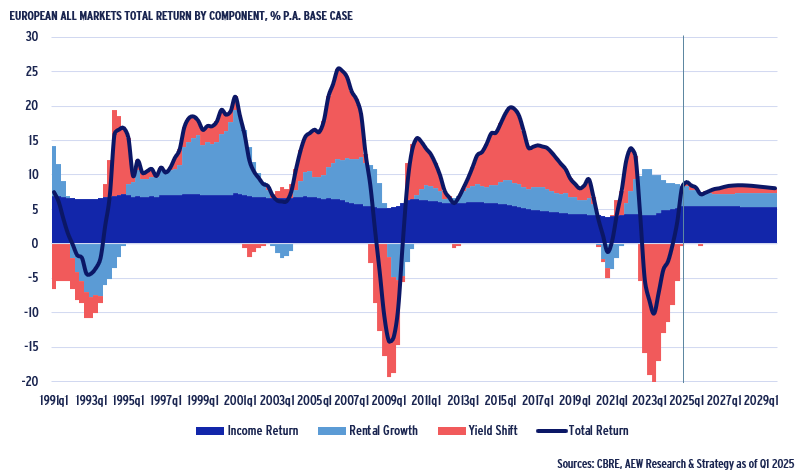
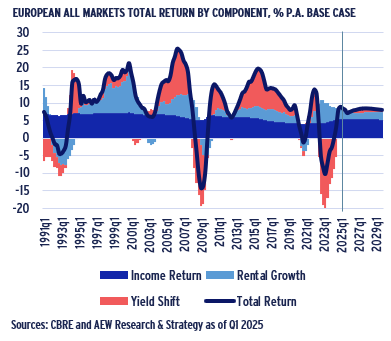
- Capital value appreciation -- as a result of yield shift -- has been the least stable component of past total returns. In fact, 2022-24 yield-driven capital value decline was more severe than in the 2008-10 GFC-related cycle. Fortunately, 2022-24 downside was limited as some offsetting capital value increases came from rental growth.
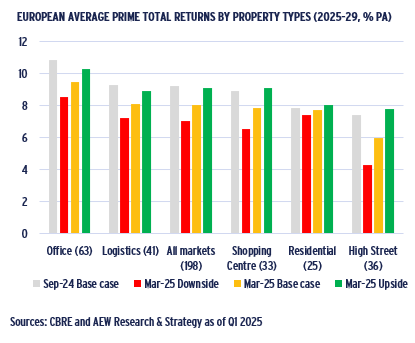
- Our 2025-29 prime base case returns projections across all European real estate markets are 8.1% p.a., which already factored in 10% tariffs. Our 2025-29 downside scenario confirms resiliency and is estimated at 7.0% p.a.
- UK markets are projected to deliver the highest base case 2025-29 return of 9.8% p.a. followed by Benelux and CEE markets. Prime office markets are still projected to have the highest 2025-29 returns of any sector at 9.5% p.a., followed by prime logistics markets in second place with returns of 8.1% p.a.
- Positive momentum is maintained based on the improved Mar-25 investment managers’ sentiment survey -- with over 60% expecting 2025 value increases. Also, we estimate 2025 volumes of €200bn, 9% up from 2024.
ECONOMIC BACKDROP –FOCUS SHIFTS TO IMPACT FROM NEW TARIFFS
WORSE THAN EXPECTED TARIFFS MAKE DOWNSIDE SCENARIO MORE LIKELY
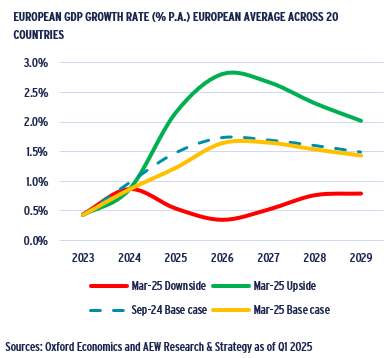
- Our property market modelling uses Oxford Economics’ (OE) revised forecast of 1.2% GDP growth for Europe in 2025, down from 1.5% expectation in September 2024.
- In 2024, Germany continued stagnating while both UK and France posted marginally positive GDP growth.
- Germany is projected to post marginally positive GDP growth for 2025. UK and French 2025 growth are projected at 1.1% and 0.8%, just below the 20-country average.
- This modest pre-tariffs growth projection was triggered by the Ukraine war and other geopolitical uncertainties.
- Our upside scenario assumes that GDP grows faster as inflation drops below central banks’ target levels.
- Given the fast-changing news on US trade tariffs, our downside scenario has become more likely than before.
- Despite the unclear long-term effect of higher tariffs on bond yields, the downside scenario reflects lower GDP growth as well as higher inflation and bond yields.
BASE CASE PROJECTS GOVERNMENT BOND YIELDS TO STAY FLAT
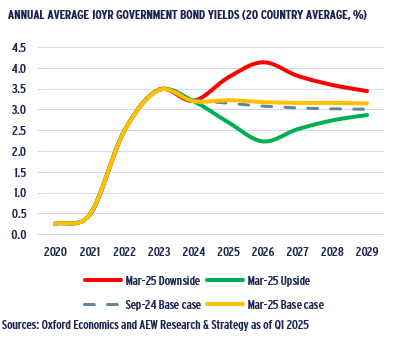
- Annual average 10-year government bond yield across our 20 European countries came in at 3.2% for 2024 having peaked at 3.5% in 2023.
- In our base case, average yields are projected to remain at 3.2% until 2029, 20bps above Oxford Economics' September 2024 forecast of 3.0% for that year.
- Inflation remains above expectations and central bank targets. It is still projected to stabilise at around 2% p.a. and as a result, central bank rate cuts are expected to slow.
- The most recent news on the 90 days pause partly reversed the initial investors move from stocks into bonds. However, the long-term impact on bond yields is unclear.
- Lower GDP growth going forward might dampen the short term impact of tariffs on inflation in the next 3-5 years.
- This also fits well with our downside scenario, with government bond yields expected to widen to 4.1% bps in 2026 and return to 3.4% by 2029.
LONG TERM IMPACT OF TRADE TARIFFS ON BOND YIELDS UNCLEAR
- Recent announcements on US trade tariffs and possible EU and other countermeasures have increased trade policy uncertainty (TPU) to a new record level.
- Despite increased concerns about the long-term macroeconomic outlook, in the short-term investors moved from stocks into bonds, pushing down yields.
- The most recently announced 90 days pause on tariffs above 10% partly reversed the short-term investors move from stocks into bonds.
- Once higher tariffs are confirmed, the long-term impact on bonds remains unclear as TPU had little to no correlation with government bond yields as well as with GDP growth rates (not shown on the graph) historically.
- All else equal, tariffs are expected to decrease trade, aggregate demand and consequently the output and investments in the directly affected and adjacent industries.
- In addition, tariffs are projected to increase the risks of supply-chain disruptions.

ECONOMIC BACKDROP – EXCESS YIELD SPREAD RETURNS TO LONG TERM AVERAGE
10-YEAR BOND YIELDS AHEAD OF 5-YEAR SWAP RATES OVER LONG TERM
- Even if long term real estate investors might not be able to avoid considering short-term 10-year government bond yield movements, the direct impact on real estate is limited.
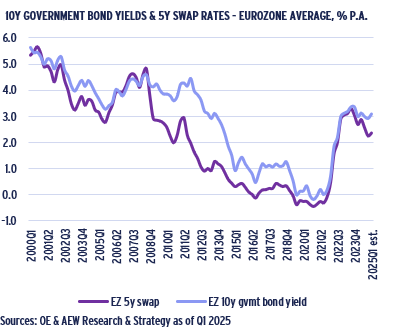
- Any direct impact from higher interest rates on real estate through borrowing costs is moderated as they are based on 5-year Eurozone swap rates.
- At 3.75%, borrowing costs remain accretive as the all-sector prime yield stands at 5.35% as of year-end 2024. This is a key motivation for leveraged investors to move forward.
- In Q1 2025, the 5-year Eurozone swap rate is estimated to have widened by 11bps but remains 94bps below its recent Q3 2023 peak.
- Historically, there has been a margin between bond yields and swap rates. Assuming swap rates stay in line with this long-term margin, then borrowing costs will not widen.
- This means that the direct impact on leveraged investors is expected to remain limited in the short term, potentially offering investors a safe haven compared to other assets.
FRENCH & GERMAN YIELDS MOST SENSITIVE TO GOVERNMENT BONDS
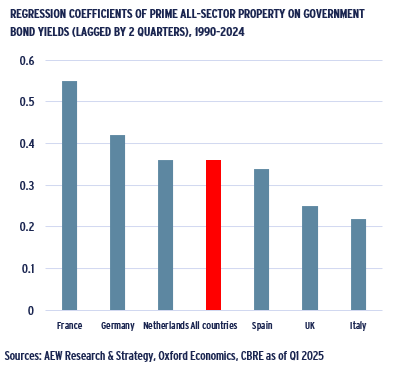
- The long-term relationship between prime property yields and government bond yields can be illustrated by the regression coefficients.
- Long term data and regression coefficients confirms that a 100bps movement in government bond yields corresponds to a 36bps move in prime property yields.
- France shows the highest sensitivity with a coefficient of 0.55, followed by Germany with a coefficient of 0.42.
- This might explain why investors from these jurisdictions are more concerned with government bond yield movements in the short term.
- Most countries also had periods of decoupling. When government bond yields exceeded the prime property yields or when they moved in opposite directions.
- Please note that the 2-quarters lagged correlation assumes that real estate investors will wait to price in government bond yields with some delay into property yields.
EXCESS SPREAD OVER BONDS NEARING HISTORICAL AVERAGE
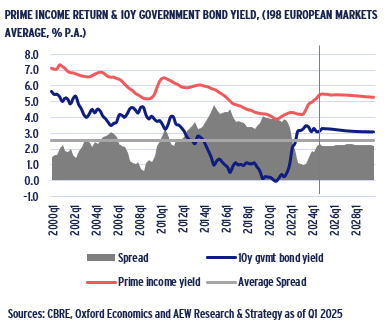
- Many income-oriented investors consider property yields relative to government bonds.
- Since year-end 2020 property yields widened by 160bps, while bond yields widened by 310bps.
- The excess spread of property over government bonds nearly halved from 400bps to 220 bps over the last 4 years.
- The current excess spread of 220 bps is projected to remain stable over the next five years.
- This is near the 260 bps 2014-24 historical average excess spread and should be prove attractive in the current environment.
- Any yield comparison remains limited in scope, as prime real estate has a proven track record of providing capital value appreciation on top of the income yield.
MARKET OVERVIEW – OFFICE VACANCY EXPECTED TO COME DOWN IN LINE WITH OTHER SECTORS
INCREASING OFFICE VACANCY RATE BUCKS THE OVERALL TREND
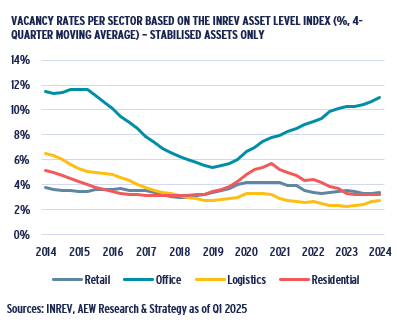
- Except for offices, vacancy rates across European property sectors have been trending down since Covid.
- Vacancy rates across property sectors are tracked with the INREV Asset Level Index (ALI) data as it shows performance of institutional investors’ real estate portfolios since 2014.
- At 11%, INREV ALI data on offices shows the largest and most enduring increase in vacancy of any sector post-Covid after excluding assets under (re-)development.
- Pre-Covid 2019 office vacancy was at 5% while it is worth remembering that office vacancy was near 12% back in 2014.
- Retail vacancy appears low at 3% but this is most likely reflective of the ALI high quality of assets reported by institutional investors.
- Residential vacancy is equally low at 3% but recorded an increase during Covid lockdowns as tenants moved out.
- Logistics vacancy rate remains the lowest across our sectors at 2.7% a slight increase since 2023.
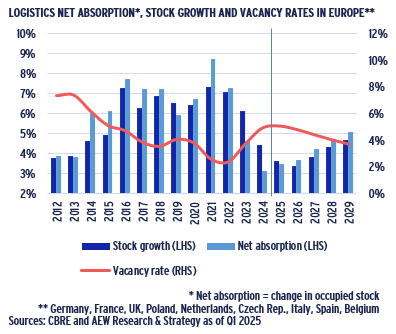
OFFICE VACANCY RATES PROJECTED TO COME DOWN IN EUROPE
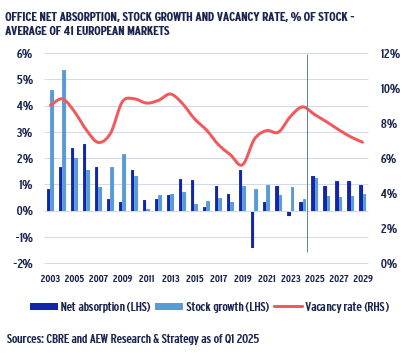
- Separate data from CBRE shows that across 40 European office markets vacancy rates were at 9.0% by year-end 2024 an increase of 330 bps compared to pre-Covid 2019 levels.
- By year-end 2029 vacancy rates are expected to come down to 7.0% as new supply is projected to come in well below net absorption.
- New supply is impacted by lower profitability for potential development schemes as capital values have come down 20-30% while construction and financing costs increased.
- Office demand decreased due to more working from home and other remote working arrangements.
- However, many occupiers are still fine-tuning their post-Covid space needs as staff working patterns are settling down.
- So far, there seems to be no common corporate approach, even in the same industry, as some firms insist on full time back to the office, while others offer staff full flexibility, while the majority of the companies remain somewhere in between.
LOGISTICS VACANCY PROJECTED TO COME DOWN FROM 2024 LEVEL OF 5%
- In the last two years, developers responded to the strong increase in Covid-related demand during 2021-22.
- This increased 2023-24 supply was met by a declining demand for space pushing vacancy rates up to 5.1% up from its record low of 2.5% in 2022. .
- However, new supply is projected to subside as developers’ profitability has been hurt like offices.
- Going forward, new supply and demand are projected to be more balanced, which means that logistics vacancy rate is projected to come down gradually to 3.7% by 2029.
- This should prove to be positive factor for future rental growth across the core European logistics markets.
- Despite the unhelpful news flow on trade tariffs, fundamental drivers for logistics space demand such as e-commerce and near-shoring manufacturing remain favorable.
- New positive factors come from an increased need for European defence and data centre spending.
MARKET OVERVIEW – HIGHEST RENTAL GROWTH FOR RESIDENTIAL & OFFICES
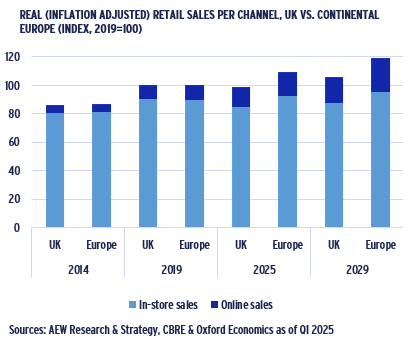
RETAIL TENANTS BENEFIT AS IN-STORE SALES PROJECTED TO STABILISE
- Despite the ongoing rise in e-commerce penetration, real (inflation-adjusted) 2025-29 retail sales are projected to grow at 1.7% p.a. with in-store sales expected to improve.
- Compared to pre-Covid 2019 levels, in-store sales are expected to recover after having declined by 6% in the UK and increased by 3% in Europe by 2025
- The projected cumulative growth in in-store sales over the next five years is 0.6% p.a. -- a stable albeit modest growth.
- Online sales are expected to account for 66% of the projected growth in total UK retail sales from 2025 to 2029 while Continental European online sales are projected at 68% of total sales growth.
- In other words, while e-commerce is projected to dominate overall retail sales. In-store sales are forecast to still have growth, albeit less. This is positive for retail tenants.
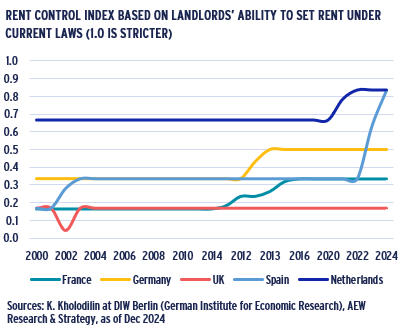
PRIME RESIDENTIAL SEGMENT INSULATED FROM RENT REGULATIONS
- Many investors remain concerned about regulations of the European private rented sector since increasing supply shortages have triggered tighter regulations.
- These regulations have been around for a while and changed over time. They also vary across Europe and can be monitored by the index developed by DIW Berlin.
- Based on this rent control index, the UK appears to be the most landlord-friendly market. The Netherlands has traditionally been the most tenant-friendly market.
- However, the pending renters’ reform bill might change this as it intends to give UK tenants greater protections.
- In Spain we have seen both new national rules as well as new Catalonian regional government rent controls.
- Crucially, these tightening regulations do not directly affect the prime, mostly unregulated market segment.
- However, tighter rent regulations could increase and prolong supply shortages and push up prime rents.
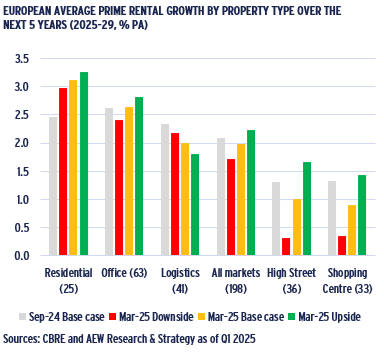
LIMITED SUPPLY & MODEST GROWTH LIFTS PRIME RENTS
- Our latest 2025-29 base case forecast for prime rental growth across all sectors comes in at 2.0% p.a., a modest downgrade from 2.1% in our September 2024 base case.
- Residential takes the top spot in our latest prime rental growth outlook with an average of above 3.1% p.a.
- This is triggered by a downward revision of the supply of new residential units amplifying existing shortages.
- Rental growth across all sectors ranges between a solid 1.7% p.a. in downside and 2.2% p.a. for the upside scenario.
- Shopping centres and high street retail have projected 2025-29 rental growth of 0.9% and 1.0% p.a., respectively.
- Prime office rents are forecast to have growth of over 2.6% p.a. coming in second position across sectors.
- As before, secondary rents remain under pressure as many occupiers prefer prime offices.
- Scenario sensitivity is relatively high for both retail sectors. Logistics’ scenario impact is explained by the historical ties between rental growth and inflation rather than GDP.
MARKET OUTLOOK – VOLUMES & SENTIMENT EXPECTED TO MAINTAIN POSITIVE MOMENTUM
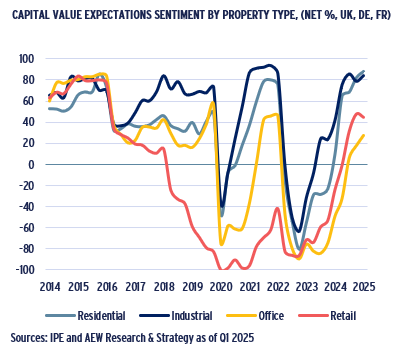
RETAIL & OFFICE SENTIMENT TURNS POSITIVE
- Sentiment among European managers continued to improve based on the latest March/April 2025 IPE Real Assets Expectations Indicator survey.
- The net percentage (%) is calculated as the difference between the share of managers who believe property values would increase vs decrease over the next 12 months.
- Across all four sectors over 60% of respondents expect a positive capital value increase in the next 12 months. Pretty solid even if it is not quite as strong as in 2015-16.
- Retail and office-focused manager sentiment has recently turned positive following the strong momentum seen earlier in both residential and industrial.
- Variation in sentiment across sectors has narrowed mostly due to the long overdue improvement in retail.
- Past changes in managers sentiment can be tied to actual transaction volumes across European markets. Based on this improved sentiment, we expect 2025 volumes to recover.
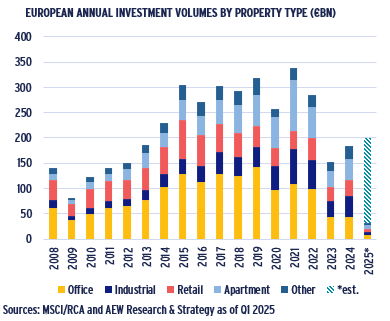
2025 DEAL VOLUMES PROJECTED TO REACH €200 BN
- Full year 2024 transaction volumes across the main property types came in at €183bn up 22% from the €150bn recorded in 2023. Still only 54% of the 2021 record volumes.
- Given the significant repricing and improving investor sentiment, for full year 2025 we estimate €200bn in investment volumes in Europe, as indicated in the graph.
- Even as the momentum seems to have turned, MSCI reported 2024 distressed sales of near €5bn as many lenders push for refinancings and fund investors seek redemptions.
- Given its reduced share in total volumes, bid-ask spreads for many potential office deals remain high even after its dramatic re-pricing in 2022-24.
- 2022-24 property repricing decreased the relative share of property in mixed-asset institutional portfolios, which can trigger additional allocations to meet long-term targets.
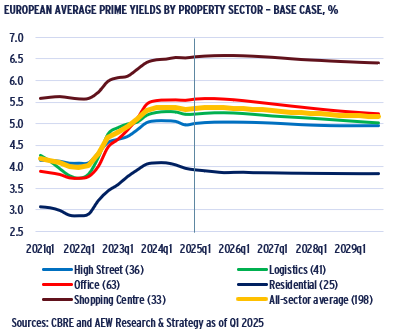
PRIME YIELD TIGHTENING PROJECTED TO MODERATE
- Higher interest rates pushed prime property yields for the all-sector average up by 135 bps over the 2022-24 period
- Prime office yields widened most of any sector by 190 bps on average by year-end 2024, followed closely by logistics and residential at 150 bps and 120 bps, respectively.
- After these 2022-24 repricings and our base case projection for less government bond yield tightening, the all-sector prime yields are now projected to move in by 20bps by 2029.
- In fact, prime office yields are forecast to tighten by 40 bps over the next five years from year-end 2024, followed by logistics and residential at 20bps and 15 bps, respectively.
- Prime office yield tightening is still unlikely to lead to lower yields for non-prime offices in the short term.
- However, further improvement in office investor sentiment and prime rental growth might do this in the medium term.
- Prime high street yields are projected to remain flat while shopping center yields are expected to tighten by 10 bps.
MARKET OUTLOOK – PRIME OFFICES & UK RANK TOP
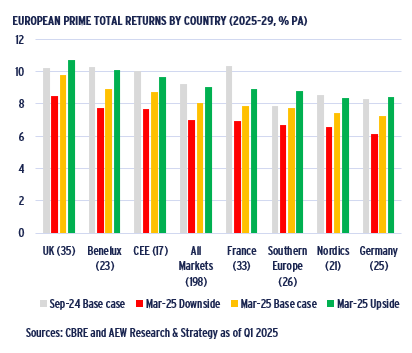
UK TOP IN PROJECTED TOTAL RETURN RANKINGS
- Our prime returns projections across all sectors comes in at 8.1% p.a. for the 2025-29 period. This is down from 9.2% p.a. for the same years in our base case from Sep-24.
- UK markets are projected to deliver the highest average total return of 9.8% p.a., which is driven by relatively higher current yields and stronger forecasted yield compression.
- Benelux markets are ranked second with a forecast return of 8.9% p.a., driven by solid rental growth.
- CEE markets rank in third place in our total return projections partly driven by a higher number of logistics markets and higher rental growth compared to other countries.
- France and Southern European markets come out below the European average prime return projections.
- Nordic and German markets’ 2025-29 total returns come in at respectable rates of 7.4% and 7.3% p.a., respectively.
OFFICE REMAINS TOP RANKED SECTOR IN OUR RETURN PROJECTIONS
- Prime office markets are still projected to have the highest returns of any sector at 9.5% p.a. over the next five years.
- This is due to their bigger than previously expected 2024 repricing and attractive projected rental growth.
- Prime logistics markets come in second place with returns of 8.1% p.a. on the back of their lower current yields and rental growth projections.
- Our latest downside scenario shows returns at 7.0% p.a. on average across sectors with 9.1% in our upside scenario.
- Our latest return projections are primarily driven by higher current incomes as yields widened in the recent downcycle and capital value appreciation from rental growth.
- Projected yield tightening by year-end 2029 has been cut back given the latest bond yield projections limiting capital value growth.
CONFIDENCE INTERVAL SHOWS WIDER RANGE OF OUTCOMES
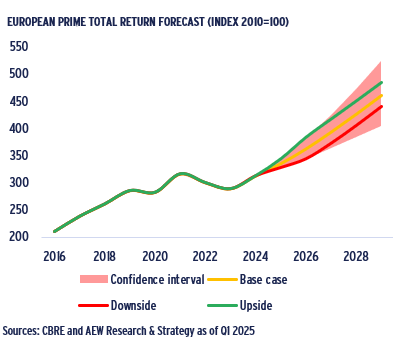
- As some investors have requested a wider range of potential outcomes, we show indexed returns in a confidence interval based on historical forecast errors.
- On an annual basis, our lower end of the 2025-29 confidence interval for total return stands at 5% p.a., and at 11% on the higher end.
- Given that our base case for the same period is 8.1%, this offers a convenient range of plus or minus 3% p.a.
- This is wider than plus or minus 1% p.a. range implied by our downside (7.0% p.a.) and upside (9.1% p.a.) scenarios.
- Our wider confidence interval is based on 18 different historical forecasts going back to Q4 2017 for 147 European market segments.
- Fortunately, 2022-24 total return downside from capital value declines was relatively limited as yield decompression was partially offset by rental growth.
MARKET OUTLOOK – CURRENT INCOME & RENTAL GROWTH TO DRIVE TOTAL RETURNS
PROJECTED RETURNS LESS DEPENDENT ON YIELD SHIFT
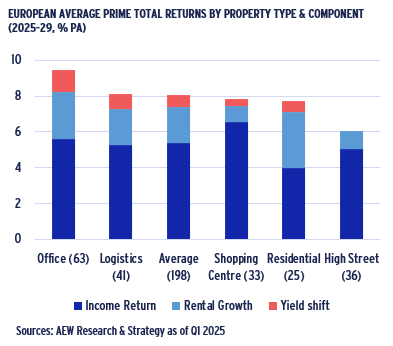
- As a consequence of our changed rental growth and yield projections, the key drivers of total returns have shifted significantly away from capital growth due to yield shift.
- This is less the case for offices, which is the only sector that has more than 1.0% p.a. from this driver.
- Capital appreciation from market rental growth still plays a major role in total returns, especially in residential and offices at 3.1% and 2.6% p.a. over the next five years.
- Prime shopping centre returns stand out with very little capital appreciation, but the highest current income returns at 6.6% of any sector – after a long period of repricing.
- Similarly, prime high street retail has very little capital value appreciation, but given its low yield comes out bottom.
- Across sectors, returns are less dependent on projected yield shifts, which in the current macro environment are hard to envision.
TOTAL RETURNS DRIVERS SHIFT TO CURRENT INCOME & RENTAL GROWTH
- Given the revised outlook for government bond and property yields to tighten less going forward, capital value appreciation is projected to be less than in our Sep-24 projections.
- However, we still project capital value growth as a result market rental growth. Even at a similar yield, capital values improve when rental income increases.
- Combined with the post-correction higher current income yields, our total return projections are less dependent on yield tightening and could be considered to be less uncertain.
- Unsurprisingly, in a historical context it is clear that the capital value appreciation as a result of yield shifts has been the least stable component of total returns.
- Even so, it was surprising to note that the yield-driven capital value decline in the recent 2022-24 cycle was more severe than the GFC-related 2008-10 cycle.
- Fortunately, 2022-24 total return downside was limited as capital value growth came from positive market rental growth, which was not the case during the GFC.
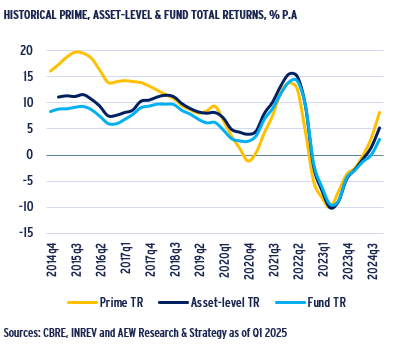
RECENT ALIGNMENT OF PRIME & FUND RETURNS LIKELY UNSUSTAINABLE
- Since our prime returns are not truly reflective of what fund investors can expect in terms of actual distributions, we provide a comparison with the INREV fund and asset indices.
- Since 2020, there has been a remarkably close alignment of these different European total return series, which can be partly explained by the volatility in capital values.
- Despite this recent alignment, it should be noted that prime and asset index returns are pre-fee and unlevered, while the fund level index returns are post-fees and leverage.
- Also sectors and countries included in our unweighted prime returns do not match the two INREV series.
- It might not yet be possible to conclude that prime returns are a good indicator of fund (and asset) returns, because the 2015-19 period shows a different and more logical pattern.
- Prime 2015-19 returns (best building in best location) were 13.1% p.a., followed by 9.5% p.a. for asset returns (institutional quality building) and 7.8% for post-fee, levered fund returns.
This material is intended for information purposes only and does not constitute investment advice or a recommendation. The information and opinions contained in the material have been compiled or arrived at based upon information obtained from sources believed to be reliable, but we do not guarantee its accuracy, completeness or fairness. Opinions expressed reflect prevailing market conditions and are subject to change. Neither this material, nor any of its contents, may be used for any purpose without the consent and knowledge of AEW. There is no assurance that any prediction, projection or forecast will be realized.