- The latest data on temperature and sea level rises confirm that climate change continues to advance. Despite reduced emissions from both the EU27 and the US, global emissions growth continues. These trends might push the Paris accord target of 1.5 degrees by 2050 out of reach when we consider all industries and countries.
- Given data limitations on physical climate hazards, our current European assessment of climate impact focuses on an updated transition risk premium estimate. As before, this risk premium reflects how much investors should be compensated for this specific climate-related market risk.
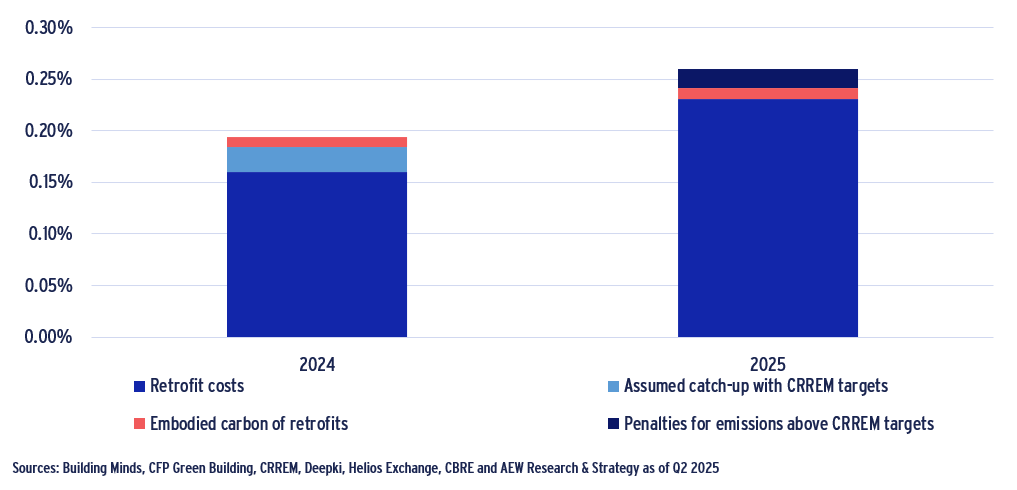
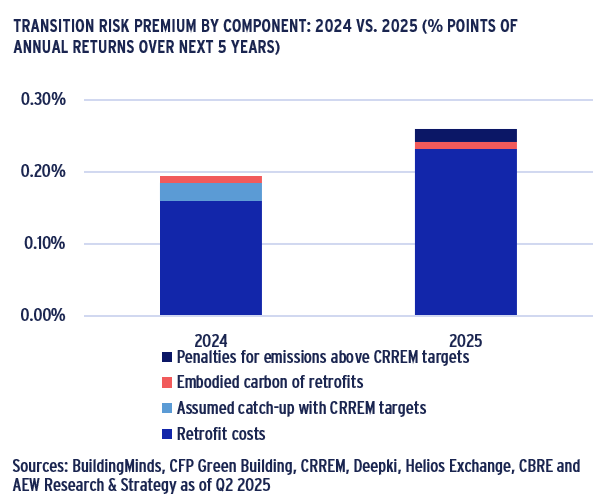
- Our new methodology and additional data show a 37% increase in the average European transition risk premium estimate. At 26 basis points (bps) pa, our updated transition risk premium across our 196 European market segments covering 20 countries and five property types is up from last year’s estimate of 19bps.
- Our latest estimate uses expanded building-level retrofit costs from four expert data partners for a market representative European portfolio and assumes a new carbon price-based penalty for emissions above the CRREM target pathways assuming a constant gap with the target throughout the entire assumed 10-year holding period.
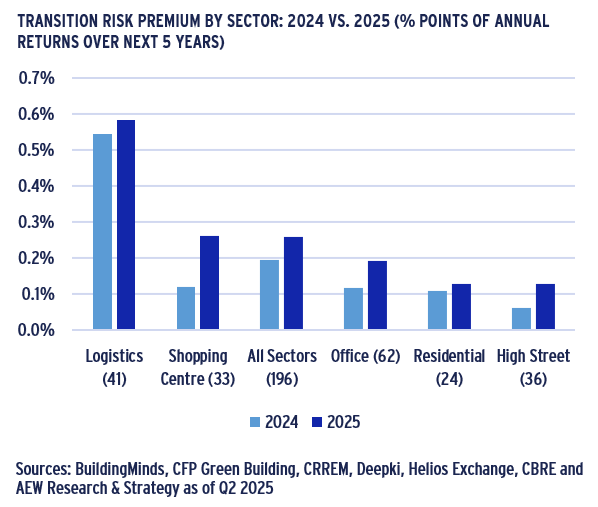
- Across sectors, logistics have the highest transition risk premium at 58bps, while the shopping centre risk premium experienced the largest increase, reaching 26bps, while office premium increased to 19bps. Residential and high street retail continue to have the lowest premiums, both at 13bps.
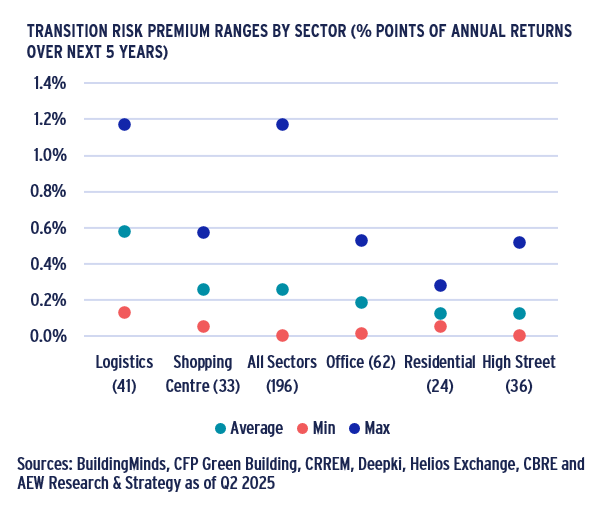
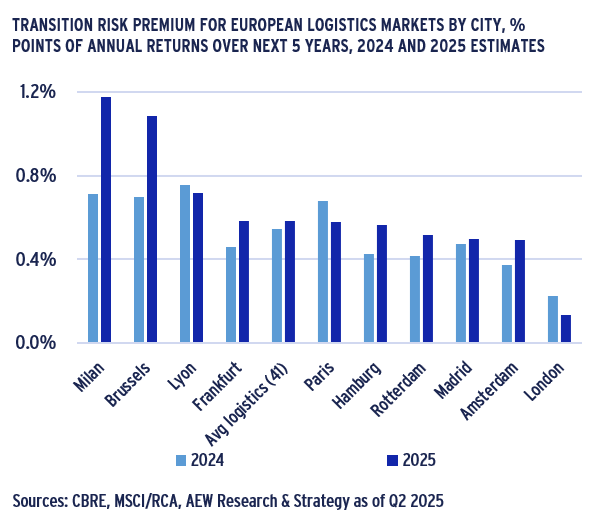
- Individual city- and sector-specific estimates can vary widely from the above sector averages. Annual transition risk range from nearly 1bps for the lowest retail sector (Zurich) to as much as 120bps for the highest logistics market (Milan). Our approach allows specific city-sector estimates for all 196 European market segments in our coverage.
- Even at the increased 26bps pa, the transition risk itself remains modest when compared to our overall 2025-29 anticipated total returns of 8.1% pa. This means that in prime European real estate investments, the Paris accord targets remain both relevant and achievable.
TRANSITION RISK PREMIUM BY COMPONENT: 2024 VS. 2025 (% POINTS OF ANNUAL RETURNS OVER NEXT 5 YEARS)
LATEST CLIMATE INDICATORS SHOW WORLD HEATING UP EVEN IF EMISSIONS GROWTH SLOWS
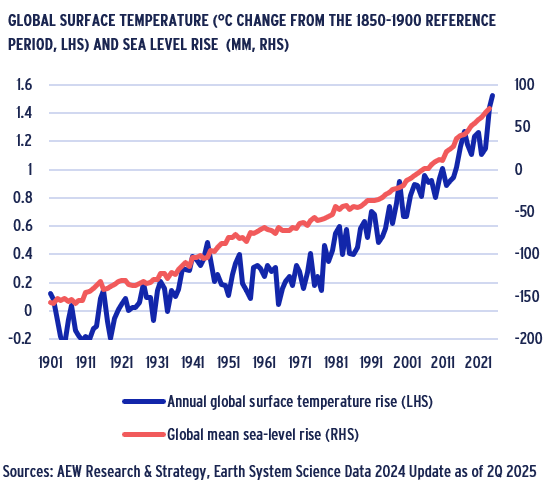
TEMPERATURE AND SEA LEVEL SET NEW RECORD HIGHS
- New data from the annual Earth System Science Data (ESSD) update confirms that climate change is advancing.
- The 2025 best estimate of observed global surface temperature of 1.52 °C relative to pre-industrial level is well above the best estimate of human-caused warming (1.36 °C).
- Global sea level rise reached 228mm in the 1901-2024 period, which is the result of an increase to near 4mm p.a. levels in 2015-24 period up from 3mm p.a. for 1995-2004.
- These indicators show that human activities are increasing the Earth’s energy imbalance and driving faster sea level rise compared to the IPCC sixth risk assessment (AR6).
- Since the IPCC assessment is only done every 10 years, the ESSD team provide interim updated monitoring as to where we are relative to specific targets.
- This recent update is alarming and confirms that climate change is warming the planet and increasing sea levels faster than previously expected in the IPCC analyses.
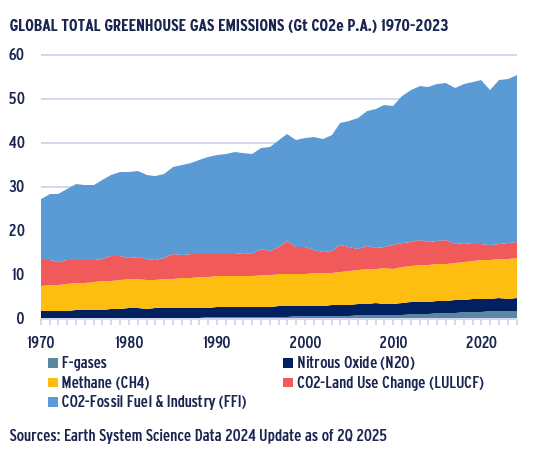
GLOBAL EMISSIONS LIKELY TO PUSH 1.5°C TARGET OUT OF REACH
- Annual greenhouse gas emissions (GHG) are set to exhaust the planet’s carbon budget within three years.
- Record warming is caused by a combination of GHG emissions being at an all-time high of 53.6 GtCO2e p.a. over the last decade as well as reductions in aerosol cooling.
- Most of the GHG increase is triggered by industrial CO2 and methane (agricultural) emissions.
- This new ominous milestone could minimise the chance of limiting warming to 1.5 °C above pre-industrial level as set out in the Paris accord targets.
- The remaining 1.5 °C target carbon budget which was set by IPPC in 2020 at 500 Gt CO2e based on its AR6 is now down to 130 GtCO2e from 2025 based on ESSD.
- At over 53 GtCO2e p.a., this remaining budget will be exceeded in less than three years.
- This trend might push the Paris accord target of 1.5 degrees out of reach.
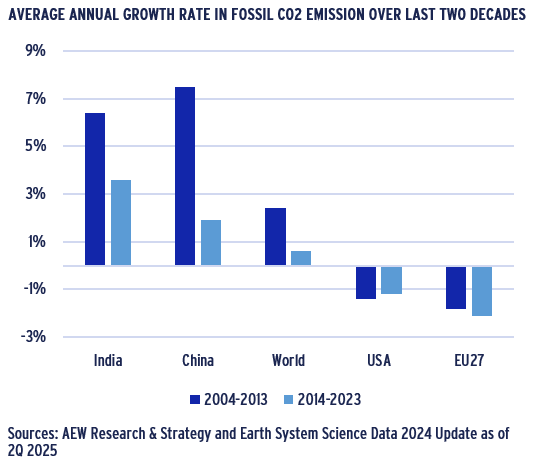
GLOBAL EMISSION GROWTH SLOWS DOWN
- As with most global trends, averages hide significant geographic differences, as shown in the regional chart.
- Growth in global emissions has slowed down from 2.4% in 2004-13 to 0.6% in the 2014-23 period.
- Both the EU27 and US have shown declining emissions for both decades, with EU emission reductions accelerating in the most recent period.
- Even if both realized reductions in emission growth, in absolute Gt CO2e terms China is now the top emitter behind the US. India’s emissions have recently exceeded the EU’s.
- Given its very large population, India’s per capita emissions are still at about half the global average, while China’s are now about double the average.
- On a per capita basis, the US remains the top emitter at well over three times the global average. While the EU27 emissions are now nearly in line with the global average.
NEW BUILDING-LEVEL EXPERT RETROFIT COST ESTIMATES PROVIDE BETTER ACCURACY
REFINED CARBON REDUCTION COSTS BASED ON UPDATED FOUR STEPS
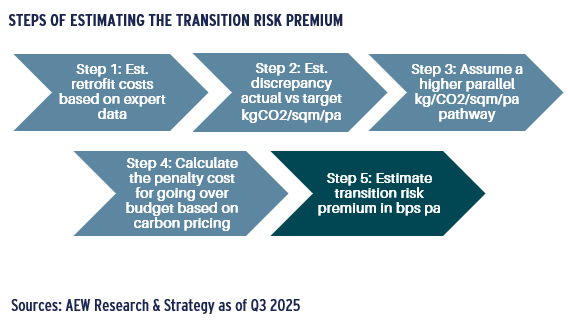
- Our new approach to estimate the market-level transition risk premium is explained below:
- Utilise new estimates of the retrofit costs required to reach CRREM targets, based on data from expert providers;
- Revise initial position (2024) on the net zero carbon emissions pathway for a market-representative European buildings portfolio;
- Determine parallel (higher) pathway of carbon intensity reduction to estimate the over-budget carbon over 2025-45 for each country-sector segment;
- Use projected future carbon pricing for over-budget carbon in each country-sector pathway to calculate penalty costs;
- Estimate total transition risk premium as a % of updated prime capital value for each city-sector segments.
FOUR EXPERT DATA PARTNERS ALLOW NEW RETROFIT COST ESTIMATE
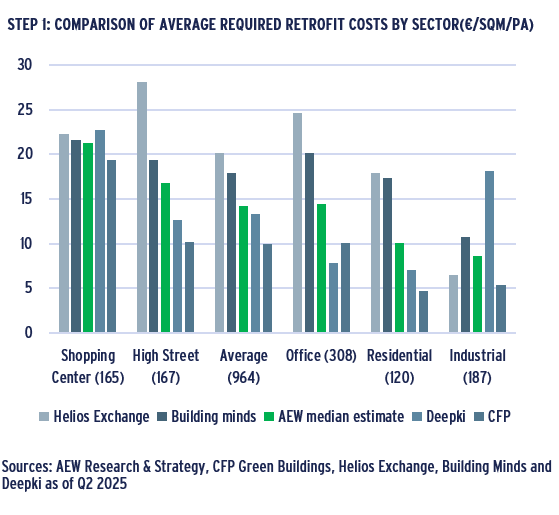
- Retrofit costs needed to meet CRREM targets are provided by CFP Green Building, Building Minds, Deepki, and Helios Exchange for the same portfolio of 964 buildings.
- It should be noted that even if the sample portfolio is the same, data partners do have different methodologies and supporting client and other data sets
- To sidestep the differences across their estimates and avoid extreme results, we use the average of the middle two estimates for each building in our analyses.
- The graph shows that the differences in average estimated costs can vary considerably, justifying our use of the median estimate approach.
- Across all property types, we estimate a cost of €14/sqm/pa, which on a like-for-like basis is up from our in-house 2024 estimate of €12/sqm/pa.
- Shopping centers show the highest costs at around €20/sqm/pa and residential at €10/sqm/pa, up from €15/sqm/pa and €8/sqm/pa, respectively.
- However, logistics did see a decline to near €9/sqm/pa from over €14/sqm/pa last year.
INCONSISTENCIES IN RETROFIT COSTS ON SECTOR & COUNTRY LEVELS
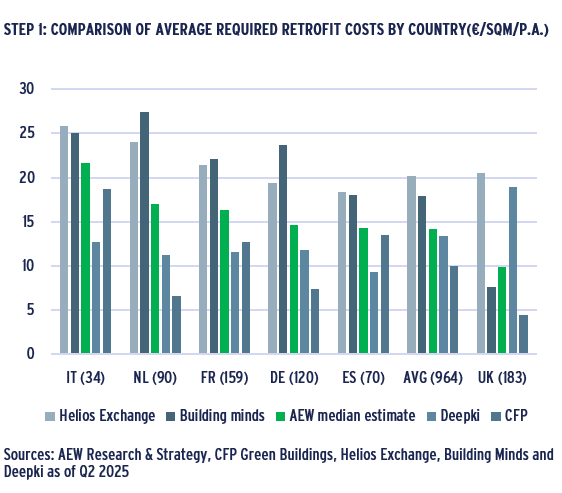
- Using estimates from Building Minds, CFP Green Building, Deepki, and Helios Exchange, we can also compare results at a key country level.
- In general, we note that there are inconsistencies in retrofit cost estimates across both countries and sectors.
- There are a few exceptions with CFP showing higher retrofit costs estimates in Italy, Spain and France. Helios has lower estimates in Spain and Germany.
- It should be noted that countries have varying numbers of buildings and/or buildings per sector, which might skew the country results across data partners.
- Again, selecting the median value from the four providers for each building helps to balance out the differences.
- In our view, this market representative sample from expert third party data partners provides an improved quality cost estimate than our previous city level in-house method.
BUILDING LEVEL COST ESTIMATES WARRANT MEDIAN COST APPROACH
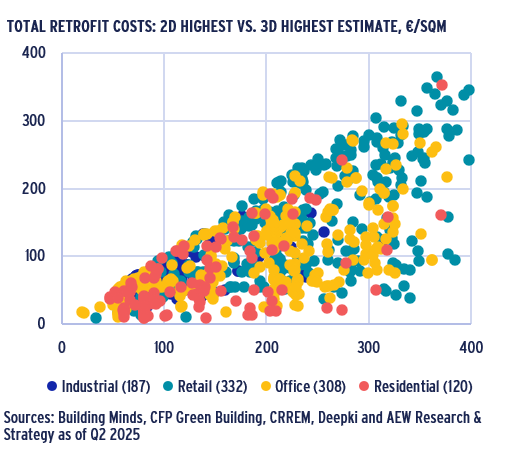
- The scatter on the right highlights the selected estimates for the 964 buildings after truncating our sample and removing the highest and the lowest cost estimates for every building.
- The truncation results in a more centered sample of estimates, which naturally exhibit a high degree of correlation.
- Each sector in the final sample demonstrates a similar degree of correlation between the two remaining estimates, ranging from 0.65 to 0.73.
- Our final retrofit cost estimates for each building are the midpoint between these two central estimates from the four available to us.
- The total of 964 buildings represent 196 market segments, averaging 5 buildings per segment.
- The scatter clearly shows that even after removing the highest and the lowest estimates, there could still be significant differences, with offices showing the widest dispersion.
PORTFOLIO ESTIMATES CONFIRM EXCESS EMISSIONS BEYOND TARGETS
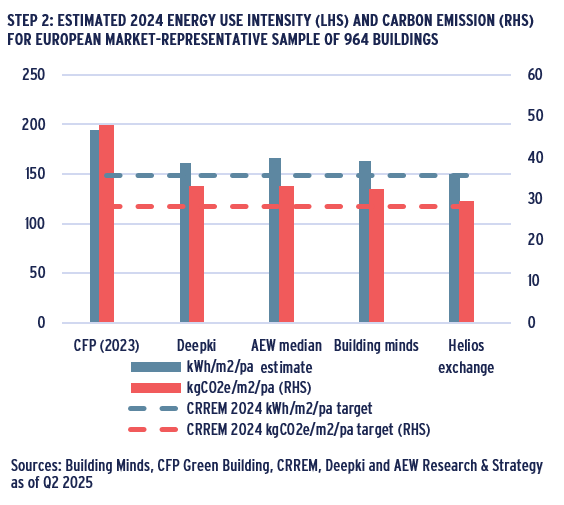
- Consistent with our methodology for estimating retrofit costs, we obtain our energy intensity and GHG emission estimates by taking the median from the four expert sources.
- Among all sources, CFP provides the highest estimates for energy intensity and greenhouse gas emissions, on average.
- It is important to note that CFP's estimates are from a year ago, which could lead to significant differences given the steep nature of the pathways in the initial years.
- Deepki’s & Building minds carbon estimates are based on 2024 CRREM conversion factors, whereas CFP and Helios provided their own estimates for GHG emissions.
- By combining this data, the median value for energy intensity is 167 kWh/sqm/year, while the median greenhouse gas emissions amount to 33.1 kg CO2/sqm/year.
- This is higher than the CRREM energy intensity and greenhouse gas emissions targets for 2024, which are 148 kWh/sqm/year and 28.3 kg CO2/sqm/year, respectively.
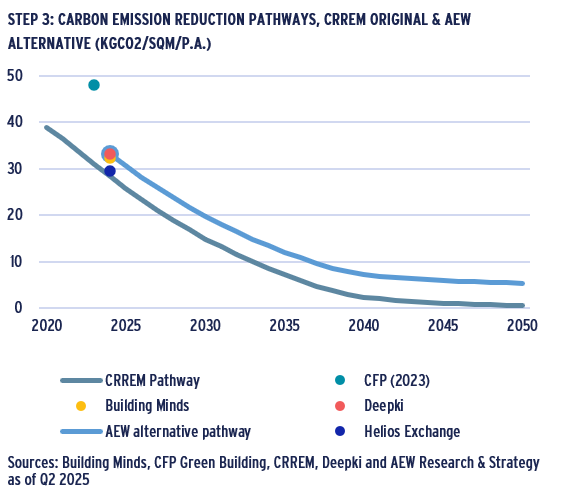
AEW ALTERNATIVE CO2 PATHWAY ASSUMES NO CATCH-UP WITH CRREM
- In last year's analyses, we began with an estimate higher than the CRREM target, assuming that investors would expedite the implementation of energy-efficient retrofits.
- Given that climate change is progressing more rapidly, decarbonization policies have become less ambitious, and capital expenditure budgets have decreased, we assume there will be no further catch-up.
- This implies that we assume a constant gap with the target of 4.5kg of CO2/sqm/p.a., which is expected to persist throughout the entire assumed 10-year holding period.
- This assumes that some of the retrofit capital expenditures will be completed, but at a slower pace than needed to offset future shortfalls, similar to last year’s analyses.
- Ultimately, this assumes that the net zero targets will not be met by 2050 as we assumed in last year’s catch-up analysis and will be postponed to a later date.
ADDING ABOVE-TARGET EMISSIONS PENALTY BASED ON PROJECTED CARBON PRICES
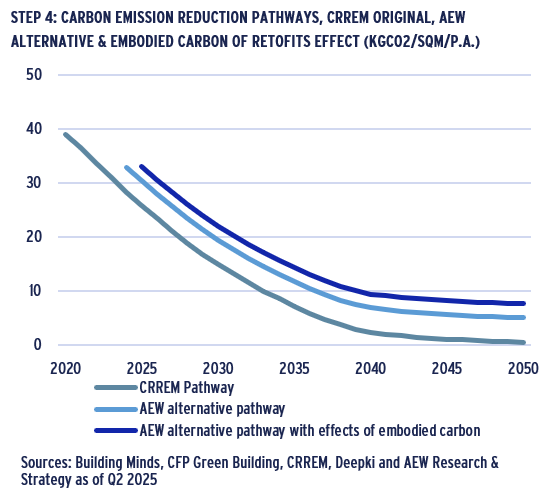
IMPACT ON ADJUSTED PATHWAY FROM EMBODIED CARBON OF RETROFITS
- In last year's analyses, we introduced and estimated the average embodied carbon of the retrofits at 67 kg CO2/m², assuming landlords are responsible for these costs.
- To meet the CRREM pathways, specific retrofit projects are required, including upgrades to building management systems, insulation, heat pumps, lighting, etc.
- Similar to last year, we add the embodied carbon associated with the materials and installation required for these to the original pathways.
- This element will increase the average discrepancy by an additional 2.6 kg CO2/m² p.a., raising the expected pathway as shown on the graph.
- Even if direct liability for property owners may be limited in the short term, we assume that local policy ambitions will address this in the future.
- The key challenge is that the carbon emissions increase further due to the embodied carbon of the retrofits.
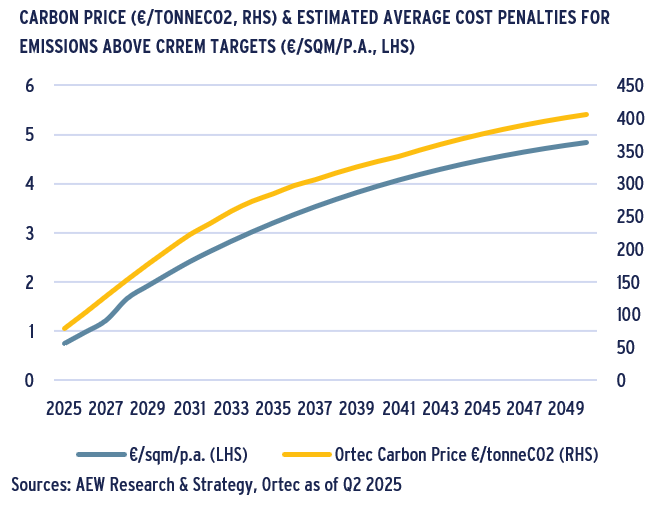
CARBON PENALTIES ASSUMED TO AFFECT INVESTORS FROM 2030
- If (or when) local carbon taxes are introduced and building emissions remain above the targets, we can estimate the “carbon penalties” that investors may incur.
Carbon cost per sqm is directly linked to the projected carbon price, as the over-budget emissions are assumed to be constant at 4.5 kg of CO2 per sqm, as illustrated in the chart. - In our base case, we assume that policies will continue to target a net-zero climate scenario, which strongly penalizes non-compliance with target emissions.
- As described in Appendix A, we believe that ETS 2 will become effective by 2027 and is unlikely to have an immediate direct impact on landlords or investors.
Regardless, we assume that as climate change progresses, governments will need to implement investor-specific carbon penalties for over-budget emissions starting in 2030. - Implicitly, we assume a Net Zero policy that penalizes non-compliance with target emissions from 2030.
COST ESTIMATES OF ABOVE-TARGET EMISSIONS VARY ACROSS SECTORS
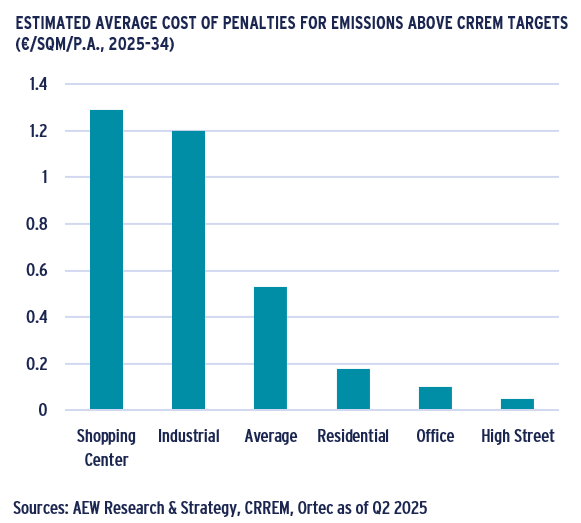
- The average cost per kg CO2 for over-emitting is estimated at €0.24/kg CO2 during the 2030-34 period, which we use as the basis for our estimation.
- These estimates vary significantly between sectors, depending on how far each sector, on average, is from the CRREM target.
- Shopping centers are 11 kg CO2/sqm above the respective CRREM target, resulting in an average cost of €1.3/sqm p.a. over the 2025-2034 period (assuming €0 cost for over-emitting from 2025-2030).
- The industrial sector is, on average, 10 kg CO2/sqm above its target, and if this discrepancy persists, it will result in costs of €1.2/sqm p.a. if these penalties are introduced.The residential, office, and high street sectors are below the average, with cost estimates ranging from €0.1/sqm p.a. to €0.2/sqm p.a.
UPDATED CLIMATE-RELATED TRANSITION RISK PREMIUM EDGES UP, BUT REMAINS MODEST
DESPITE 37% INCREASE, TRANSITION RISK REMAINS MODEST
- The costs of retrofits (spread over a 10-year holding period) and over-emission penalties (including embodied carbon) contribute to the transition risk premium.
- The denominator for retail markets was calculated as 3.0 times the median transaction price; for non-retail markets we used prime capital 4Q 2024 values for 2025 estimates.
- On average, our 2025 estimate is 26bps of the prime capital values across our 196 European markets.
- The 26bps remains modest when compared to our overall 2025-29 anticipated total returns of 8.1% p.a.
- This estimate is approximately 37% higher than last year's overall climate transition risk premium of 19bps, though it remains relatively modest.
- As highlighted, this year’s estimates employ an updated methodology that penalizes above-target emissions.
- This assumes no timely catch-up with the target as in the 2024 report, but a parallel shift from the current point.
MODEST TRANSITION RISK INCREASES 7BPS
- As before, our estimate for retrofit costs is detailed per city-sector segment as a percentage of the capital values.
- This climate transition risk premium assumes that investors should be compensated for the necessary annual energy intensity-reducing retrofits and the penalties for above-target emissions.
- The European cross-sector average transition risk premium is estimated at 26bps, representing a 7bps increase from last year's estimate.
- Similar to our Sep-2024 results, logistics has the highest climate transition risk premium, primarily due to the lower prime capital value per square meter.
- The shopping center risk premium experienced the largest increase, reaching 26bps, while office premium increased to 19bps.
- Residential and high street retail continue to have the lowest premiums, both at 13bps.
RESULTS SHOW MAXIMUM SEGMENT TRANSITION PREMIUM OF 120 BPS
- To further illustrate the premium variation across markets, we present the minimum and maximum values for all 196 segments.
- Annual transition risk range from nearly 1bps for the lowest retail sector (Zurich) to as much as 120bps for the highest logistics market (Milan).
- The largest variation across sectors is found in logistics, where the difference between the highest and lowest costs for individual markets is approximately 100bps.
- In other property sectors, the variation is significantly lower, with an average difference of 43bps between the highest and lowest costs.
- The average difference between the highest and lowest sectors within the same city is 31bps.
- The maximums within sectors also include 28bps for Vienna’s residential, 52bps for the Hague’s offices, 57bps for Amsterdam’s Shopping centers, and 52bps for Budapest’s high street retail.
STEP 5 – CLIMATE-RELATED TRANSITION RISK PREMIUM ESTIMATES IN MORE DETAIL
TRANSITION RISKS FOR PRIME LOGISTICS AT 58 BPS ON AVERAGE
- Logistics has the highest climate transition risk premium, primarily due to its lower prime capital value per sqm.
- The average across the 41 cities, which stands at 58bps, includes smaller logistics markets with low capital values.
- At the city level, Milan stands out with 117bps, exceeding other European logistics markets and reflecting a significant increase from last year.
- Paris has an average transition risk premium because prime logistics capital values in the region are not as high as those in the Netherlands and the UK.
- In contrast, London stands out with the lowest risk premium, as it has the highest capital value per square meter in Europe. This remains unchanged from last year’s results.
- Although the overall results are relatively stable compared to last year, the changes in individual markets highlight that our assessments are still a work in progress.
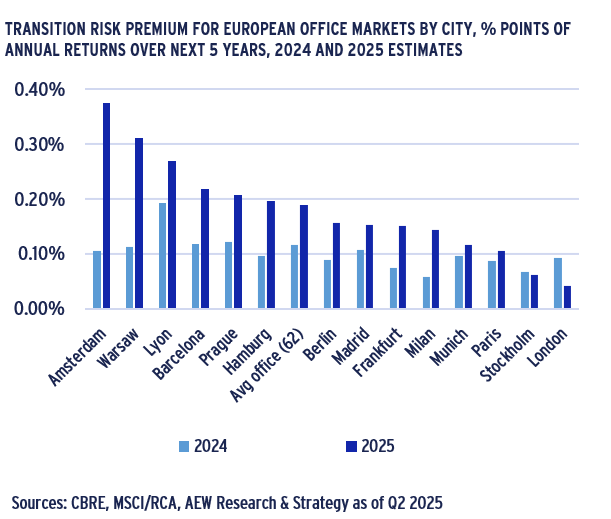
TRANSITION RISKS FOR PRIME OFFICES AT 19 BPS ON AVERAGE
- The office sector has a climate transition risk premium of 19bps, on average, across the 62 office markets covered. This represents a 50% increase compared to last year's estimate of 12bps.
- These more significant increases in the 2025 estimates result from changes in capital values for certain office markets, as well as adjustments to retrofit costs.
- As noted, our current building-level retrofit costs are based on a market-representative portfolio, which may differ from our previous estimates for individual markets.
- Office transition risk premiums range from 4bps in London and 11bps in Paris, where capital values per sqm are high.
- Higher retrofit costs pushes Amsterdam offices to 38bps of transition risk premium.
- The average across the 62 cities may seem high compared to individual markets, as the overall average includes smaller regional office markets with low capital values.
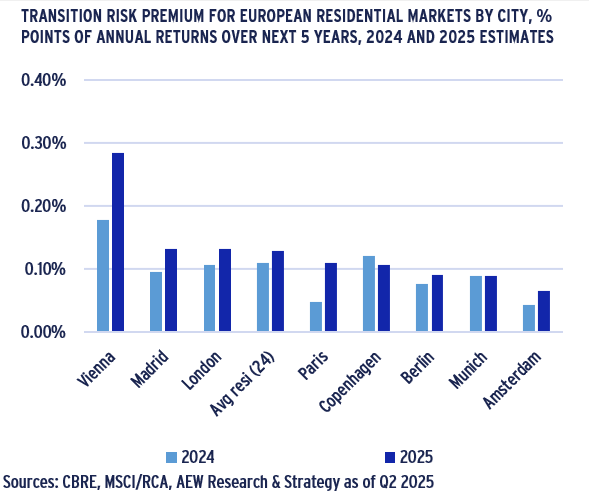
TRANSITION RISK FOR PRIME RESIDENTIAL AT 13 BPS ON AVERAGE
- The prime residential sector has an average climate transition risk premium of 13bps across the 24 residential markets covered.
- Compared to other sectors, prime residential has a smaller gap between the actual and CRREM target emissions.
- This represents only a 1bps increase compared to last year's estimate of 12bps.
- These minimal increases in the 2025 estimates are attributed to the stability of values in most residential markets and the similarity of retrofit cost estimates compared to last year.
- As highlighted, our current building-level retrofit costs are based on a market-representative portfolio, which may differ from our previous estimates for individual markets.
- Most markets fall within a narrow range around the average of the 24 markets, with values ranging from 7bps in Amsterdam to 28bps in the lower-value market of Vienna.
APPENDIX A: ETS-2 FRAMEWORK SETS STAGE FOR CARBON PRICING
COMMERCIAL REAL ESTATE INVESTORS NEED TO BE READY FOR ETS2
- The EU Emissions Trading System (ETS), launched in 2005, requires polluters to pay for their greenhouse gas (GHG) emissions if they exceed their allocated free allowances.
- The ETS operates on a "cap and trade" principle, featuring a gradually decreasing cap for the included industry sectors, contributing to a 47% reduction in EU emissions in 2005-23.
- Thus far, the ETS has covered only 40% of EU GHG emissions across key energy and industrial sectors.
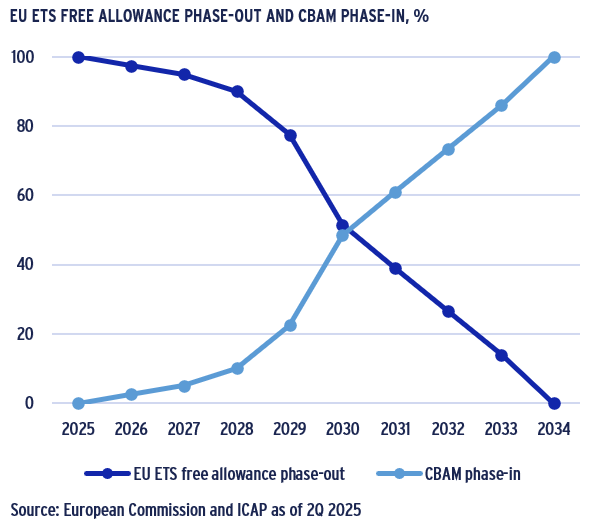
- An increasing number of sectors will be subject to the ETS, with emission allowances being phased out by 2034.
- To prevent the import of carbon-intensive products that could undermine EU GHG reductions, the Carbon Border Adjustment Mechanism (CABM) will be phased in from 2026.
- To achieve the latest 62% GHG reduction target by 2030, the EU will require companies in the buildings and road transport sectors to be included in ETS2 starting in 2027.
- The specifics of how commercial real estate investors will integrate into the ETS2 system have not yet been detailed.
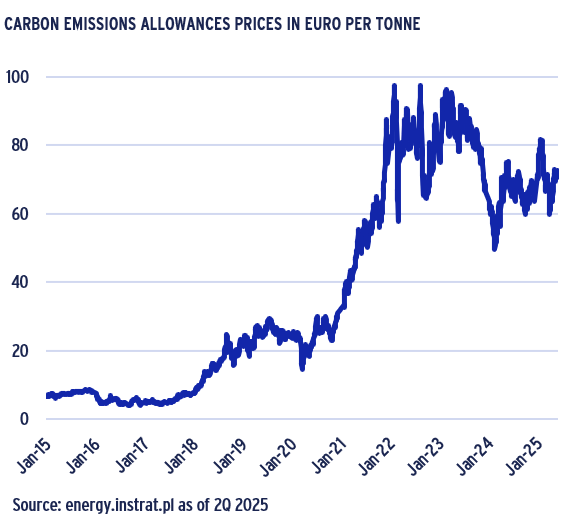
EU CARBON PERMIT PRICES DOWN FROM 2023 RECORD HIGHS
- As shown, emission allowance prices have risen to €72.50 per ton due to higher demand from GHG emitters.
- ETS2 will require commercial property investors to disclose their GHG emissions and purchase carbon allowances from the market if they exceed their cap allowance.
- This is likely to increase operational costs in 2027 and may also lead to higher capital expenditures on energy efficiency-improving retrofits to avoid purchasing these allowances.
- Since the building sector includes private housing, there are additional ETS features designed to mitigate its impact.
- To ensure a smooth start for the newly expanded ETS2 system, it was agreed to frontload the supply of allowances by auctioning an additional 30% in the first year of operation.
- There is also a market stability reserve (MSR) to address supply and demand imbalances and enhance its resilience.
- A separate new section of the MSR will be established for the building sector, ensuring that if allowance prices rise dramatically, additional allowances will be released.
- With the changes in the ETS system, future carbon emission permit prices are uncertain. Additionally, ETS2 applies directly to energy providers rather than consumers.
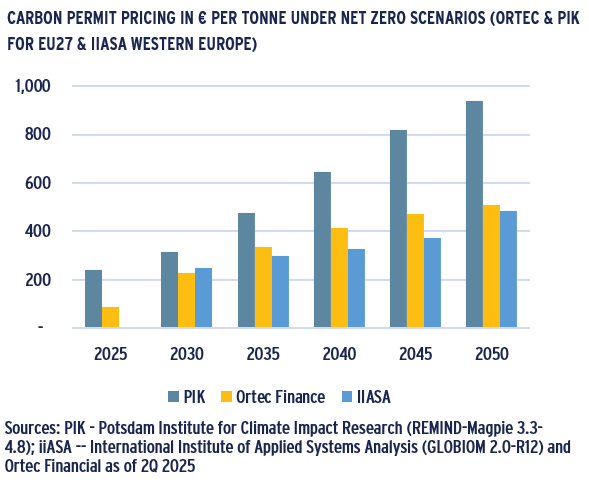
CARBON ALLOWANCE PROJECTED TO INCREASE 4-5 TIMES BY 2023
- This means that commercial real estate investors will not be directly subject to ETS2, as they can largely pass on any increased energy costs to their tenants.
- Over time, higher energy costs for tenants may still encourage them to seek out more energy-efficient buildings.
- Expert projections are available from various sources, including PIK, IIASA, and Ortec Finance.
- Ortec’s net zero scenario aligns with CRREM’s policy assumption and IIASA projections, while PIK’s projections are considered an outlier and are provided for reference only.
- With carbon permit prices currently at €72.50, they are projected to increase by 4 to 5 times over the next 10 years.
- Our approach is somewhat validated by the ULI C Change project, which also assumes carbon-price-based penalties.
This material is intended for information purposes only and does not constitute investment advice or a recommendation. The information and opinions contained in the material have been compiled or arrived at based upon information obtained from sources believed to be reliable, but we do not guarantee its accuracy, completeness or fairness. Opinions expressed reflect prevailing market conditions and are subject to change. Neither this material, nor any of its contents, may be used for any purpose without the consent and knowledge of AEW. There is no assurance that any prediction, projection or forecast will be realized.
