As the holiday travel season draws to a close, a simple question that can trigger even the most patient of parents everywhere, resonates as well with property investors across the country — “Are we there yet?”
As always, our 2023 year-end discussions with investors yielded many interesting questions. Perhaps most frequent among them - when will the downward valuation adjustments in the major private property market benchmarks be over and, more importantly, how should we be thinking about when and where to selectively deploy fresh capital? With respect to the first question (when), we believe the answer is soon; as there are many positive signals for 2024 vintage investments.
During the Global Financial Crisis (GFC) period (2008-2009), the NCREIF Property Index (NPI) endured eight consecutive quarters of negative appreciation before reaching a cyclical trough in the first quarter of 2010. Many, including us, thought (and hoped) the current re-valuation cycle resulting from the Fed’s rapid change in the interest rate environment during 2022 and 2023 would be somewhat faster and not as pronounced, given generally healthy property market fundamentals (with some notable exceptions).
A complexity arose in making that determination as the change in the cost of capital shut down property transactions, the very data points needed to affirm new market clearing prices. Indeed, the U.S. commercial property market finished 2023 with less aggregate transaction volume than 2020, the year the markets were largely shutdown (physically!) due to the COVID-19 pandemic and the resulting restrictions on travel.
Despite the dearth of transactions, valuation information can be gleaned from both public markets as well as signals from the few properties that have traded privately. With respect to the public market, history shows that listed real estate values (REIT share prices) decline earlier and more sharply than private market values. Usually, public market prices will have bottomed and already be rising while private markets are still declining. Just as the initial period of falling REIT shares signals that private market values need to adjust, rising share prices send an equally powerful signal that perhaps private market values do not need to decline as much as the public market. With the U.S. REIT market rallying sharply in November and December, the public market is seemingly signaling a similar inflection point for private direct real estate.
Figure 1: Quarterly Capital Value Change in the NCREIF Property Index (NPI)

Source: NCREIF, as of 2023 Q3
Figure 2: Cumulative Month-by-Month Aggregate Commercial Property Transaction Volume

Source: RCA/MSCI, as of December 2023
Figure 3: Publicly Traded REIT Share Prices and Private Market Capital Values

Source: NCREIF, FTSE, as of 2023 Q3 for Private Market, 2023 Q4 for REITs
Even with a limited number of transactions in the private market, the properties that have traded (along with their associated debt capital costs) can generate substantial pricing signals that ultimately contribute to informed valuations. To this point, Figure 4 highlights the change in properties that sold within the NCREIF Property Index (NPI) universe each quarter versus the change in values for properties that did not trade. Over the past three quarters, the properties that were sold experienced much greater valuation declines during the quarter they were sold than the properties that were not sold. While significant, this comparison at the index level masks important differences by property type and location. Figure 5 demonstrates this by isolating the valuation changes for office properties sold each quarter versus office properties that did not trade. Here, the differences are pronounced with the average value of an office property sold declining 35% during the third quarter compared to a decline of less than 5% for properties that were not sold. Valuation adjustment differences of this magnitude, if continued, will eventually be incorporated into the valuation of other assets, ultimately resulting in a bottoming of valuations overall.
Figure 4: Quarterly Change in NPI Capital Value for All Properties Sold vs Not Sold

Source: NCREIF
Figure 5: Quarterly Change in NPI Capital Value for Office
Properties Sold vs Not Sold

Source: NCREIF
The Road Back
“Would you tell me, please, which way I ought to go from here?” “That depends a good deal on where you want to get to,” said the Cat.
~ Lewis Carroll, Alice in Wonderland
A natural place to begin deploying new capital following a market correction in any asset class are those areas where liquidity (and values) is already improving. For real estate today, one place that seems to be the case is the listed securities (REIT) market. While share prices have rebounded sharply over the past two months with equity REITs rising approximately 20% during November and December, share prices on average remain roughly 20% below prior peaks with wide ranges across property sectors. For example, through yearend, office REIT shares increased 35% but remain more than 40% below their prior peak.
Table 1: U.S. Equity REITs Share Prices Relative to Prior Peaks
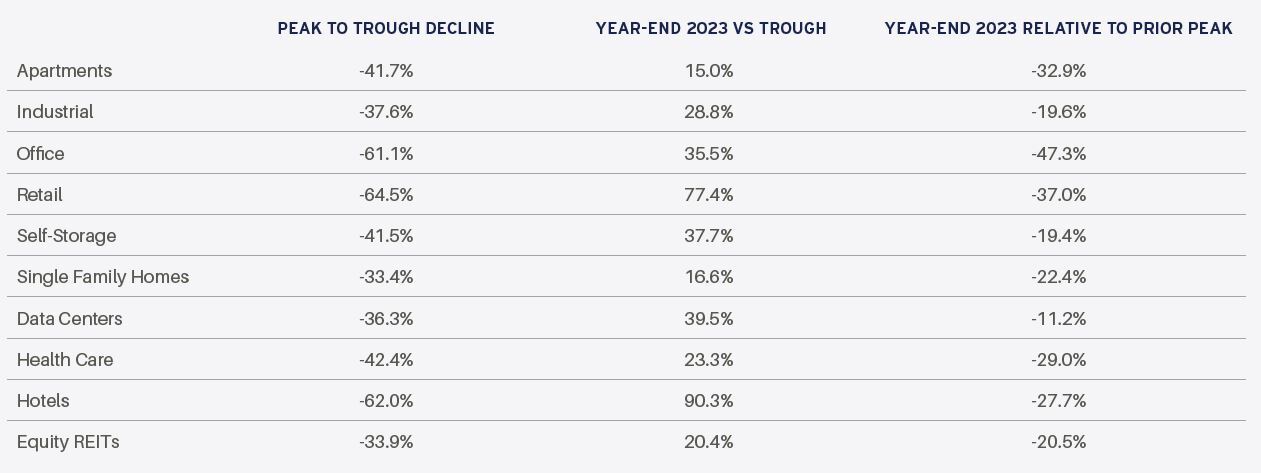
Source: FTSE/Nareit. Based on returns from 12/31/2015-12/31/2023. 12/31/2015 is the first month when all sectors are reported.
We Believe Markets Reward Those Who Provide Liquidity, Not Demand It
“Only when it is dark enough, can you see the stars”
~ Dr. Martin Luther King, Jr.
April 8, 1963. Memphis, TN
“I’ve Been to the Mountaintop” speech
Outside of listed securities, the next likely place to deploy capital is the portion of the market seeking “rescue” or other opportunistic debt and equity capital. In large part, this capital need will be triggered by near-term property debt maturity, often compounded by property operating weakness such as elevated vacancy, weakening rents and near-term lease maturities. Currently, we estimate the potential capital shortfall of such debt maturity events during 2024 to be more than $100 billion.
Figure 6: Potential Debt Funding Gap by Property Sector

Source: AEW Research
While office properties are the most obvious area of existing or pending distress, we believe there will be an increasing number of opportunities in apartment properties broadly and industrial properties selectively. Propelled by the post-pandemic elixir of surging broad asset denominator effects and extraordinarily low interest rates, U.S. commercial property transactions soared to an all-time four quarter high of more than $1 trillion by mid- 2022. These properties traded, on average, at the lowest yields ever recorded, by far. For apartment and industrial properties, both metrics reached extreme levels that in many cases are now simply untenable in the current yield environment, particularly if property performance has deviated negatively from underwriting. We expect growing and, ultimately, significant capital structure pressure especially in apartment properties, not because the properties are inherently flawed but rather because of the capital structures employed on otherwise relevant assets longer term.
Figure 7: Apartment Transaction Volume and Average Appraisal Cap Rate

Source: RCA/MSCI, NCREIF
Figure 8: Industrial Transaction Volume and Average Appraisal Cap Rate

Source: RCA/MSCI, NCREIF
The third place to consider for new capital is likely (or will likely be) property sectors and geographic locations that have demonstrated both some degree of repricing to reflect the new yield environment as well as significantly more favorable (and under-writable) operating fundamentals. Today, we find these conditions most prominently in seniors housing where the negative impacts of the pandemic period are now giving way to the strongest and most visible demand growth runway in the history of the property sector as the leading edge of the Baby Boomers inch toward age 80. While post-pandemic operating challenges and a broadly constrained financing environment must be carefully underwritten, we find underlying property market fundamentals well positioned for a prolonged period of tempered new supply and steadily growing demand.
Figure 9: Seniors’ Housing Supply, Demand & Occupancy

Source: NIC
“If you want to buy quality property, we believe you have to do it on the way down.”
~ Mike Byrne CIO & Head of Private Equity, AEW Capital Management
Conclusion
When we ask the driver “are we there yet?” what we are often really asking is “tell me when I need to start getting ready for when we arrive.” Most investors innately know that periods of positively outsized returns typically follow periods of negatively outsized returns in most asset markets. Markets are, after all, generally cyclical and long-term performance figures are merely averages over the cycle, with periods of rising values offsetting periods of falling values. Real estate is no different. While this concept is easy to understand, accurately calling market troughs and more importantly, having the conviction to deploy capital at the bottom is difficult.
“What we do at the bottom of the valley defines who we will be at the top of the next hill.”
~ Danish proverb
Figure 10: ODCE Total Return Index - 2005 Q4 – 2013 Q4

Source: NCREIF
To illustrate, we have identified the trough valuation quarter for the ODCE index in each of the last three property re-valuation cycles: the GFC, the Tech/9-11 crash and the early 1990s (i.e., the Savings & Loan crisis). For each trough, we provide the go-forward five-year total return for the ODCE benchmark. We also provide the five-year go-forward return for one and two quarters before and after the actual trough quarter. We do this to make a simple point. Long-term property investors have no need to be perfectly prescient in determining market bottoms - they merely need to be approximately correct to participate in the ultimate valuation up market. While arguments could be made in either direction, as long-term investors, we believe it is prudent to be early rather than late, largely to ensure capital will be fully at work when the market turns, as opposed to the opportunity cost associated with waiting in a queue.
Figure 11: Five Year Go-Forward Total Return from Trough Quarter in Last Three Valuation Cycles

This material is intended for information purposes only and does not constitute investment advice or a recommendation. The information and opinions contained in the material have been compiled or arrived at based upon information obtained from sources believed to be reliable, but we do not guarantee its accuracy, completeness or fairness. Opinions expressed reflect prevailing market conditions and are subject to change. Neither this material, nor any of its contents, may be used for any purpose without the
consent and knowledge of AEW. There is no assurance that any prediction, projection or forecast will be realized.
