CONFIRMATION OF OUR PRIVATE REAL ESTATE MARKET REBOUND FORECASTS
- In discussions since the release of our 2024 Outlook in Nov-23, many questioned our projected rebound for the European private real estate markets. This report presents supporting analyses to confirm that we remain comfortable with our outlook.
- In the first instance, we take a closer look at two alternative direct real estate return series from the valuation-based INREV asset-level index (ALI) and the transaction-based Green Street (GS) CPPI to compare with our regular prime market returns based on CBRE historical series and AEW forecasts.
- Combining both income and capital returns for all three total return (TR) series, it is noted that differences between them reduced between 2017 and 2020. Differences in TR somewhat increased during the turbulent Covid and rate hike periods, with GS leading the other indices.
- Based on our estimation of GS TR and if the historical pattern of GS TR as a leading indicator holds, we expect that AEW prime and INREV ALI returns should start to recover in 2024 - even if they are delayed by one or two quarters in their rebound.
- Despite minor differences in the timing and extent of their rebound, the three TR series are projected to be in a narrow band of 9-11% pa over the 2025-28 period after capital values gradually return to growth in 2024.
- Secondly, we consider how private RE returns (ALI) fit into a four quadrants framework, including real estate (RE) stocks, bonds and debt. We consider price signals from the public markets with their daily pricing.
- RE stocks posted an over 40% decline as the war in Ukraine started and inflation escalated with investors pricing in central bank rate hikes. However, RE stocks recovered 22% solely in Q4 2023, as inflation and bond yields began to stabilise.
- Based on quarterly data starting in 2014, correlation between value changes in RE stocks and direct RE stands at around 60% on a one and three-year holding period basis. However, this correlation increases to nearly 80% when we build in a two quarters lag.
- The GS CPPI index shows a higher correlation with RE stocks at 84% without any delay factor, confirming its leading nature compared to INREV ALI and CBRE prime returns.
- Thirdly, we consider non-real estate stocks and bond returns. RE stocks dramatically decoupled from non-RE stocks in 2022. However, they have picked up the non-RE stock rally in Q4 2023. RE bonds more closely tracked non-RE bonds over the period.
- In conclusion, both the recent recovery in RE stock and bond returns as well as our projection of the GS TR support our forecasts for both the INREV ALI and the CBRE prime TR to have a rebound starting in 2024 with the potential of a one or two quarter delay.
EUROPEAN DIRECT REAL ESTATE – INDEX COMPARISON
INCOME RETURNS HIGHLIGHT INDEX DIFFERENCES
- Historically, European return reporting has been led by prime broker data, like CBRE prime market rents, which we use to estimate and forecast income returns in the AEW forecast outlook.
- INREV asset level index (ALI) provides returns based on assets' reported income. AEW forecasts INREV ALI from Q4 2023.
- INREV ALI is lower than CBRE/AEW prime income return because INREV reports in-place leases and non-recoverable expenses.
- Green Street (GS) commercial property price index (CPPI) measures transaction price trends and not income. Therefore, we use their separately published net initial yield forecast here.
- GS NIY is higher than both other series, which is likely due to their geographic focus on the top 30 cities across four sectors, which differs from the wider coverage in the other two sources.
- Despite these differences in levels, the trend over time was broadly aligned pre-Covid but the series have diverged since 2020.
CAPITAL VALUE RETURNS & PRICES CONFIRM REBOUND
- As we switch from income to capital value (or price) returns, the increased level of overall volatility compared to income is clear.
- All three series are showing the Covid impact in 2020, the post-lockdown rebound in 2021 and the much bigger impact from the interest rate hikes from Q2 2022. However, timing and magnitude varies across the series.
- Actual value and price declines over the last 2-3 quarters have moderated as inflation has come down and expectations on further rate hikes have priced into lower government bond yields.
- We note that the GS projected price recovery is both delayed and more moderate compared to the AEW base case prime forecast and the AEW projection for the valuation-based INREV ALI.
- This might be due to GS having more negative macroeconomic and yield assumptions as well as a built-in caution after significant declines in European REIT share prices - GS's historical focus.
- Regardless of these variations, a rebound in capital values and prices is expected from 2024, assuming no unexpected events divert us from the base case scenario.
TOTAL RETURNS PROJECTED AT 9-11% PA FROM 2025
- As GS does not produce a TR forecast, GS total return is estimated as a sum of the capital returns derived from CPPI forecast and the income return proxied by their NIY forecast.
- Differences between the three TR series reduced between 2017 and 2020. However, like income and capital returns, TR shows an increased misalignment in the post-Covid period across the series: the GS TR series recorded a sharper and earlier decline relative to the other two series.
- If the pattern of GS TR as a leading indicator holds, we expect that AEW prime and INREV ALI returns should recover in 2024 - even if they are delayed by one or two quarters in their rebound.
- Despite these minor differences in timing, TRs are projected to be in a narrow band of 9-11% pa over the 2025-28 period after recovering in 2024 - in line with historical long-term averages.
- After this deep dive into the upcoming rebound in European direct real estate, it is worth exploring how the returns of the other three quadrants – real estate stocks, real estate bonds and real estate debt - fit into this narrative.

COMPARING DIRECT REAL ESTATE TO THE OTHER 3 QUADRANTS OF REAL ESTATE INVESTMENTS
FOUR QUADRANTS OF EUROPEAN REAL ESTATE PROVIDES CONTEXT
- The Four Quadrants framework highlights the different ways to invest in real estate, using breakdowns for private and public (listed) investments and between equity and debt specified as shown in the table.
- Direct Real Estate, which includes directly held properties and is typically managed by Alternatives departments of cross-asset investors.
- Real Estate Debt includes mortgage and unsecured debt to real estate loans as well as debt fund investments. We report returns based on our annually updated AEW loan database.
- Real Estate Stocks, which include REITs (such as Segro or Unibail Rodamco Westfield), but also Real Estate Operating Companies (REOCs) such as Vonovia which do not have to comply with the REIT rules on distribution, holdings etc.
- Real Estate Bonds include bonds of REITs and REOCs, as well as commercial mortgage-backed securities (CMBS).
- For each quadrant we identify the relevant return index. Analyses start in 2014, when the INREV ALI started.
DIRECT REAL ESTATE BEATS OTHER QUADRANTS POST-2014
- When we consider the returns since 2014 across all four quadrants, some obvious things are immediately visible.
- With daily pricing, the RE stocks and RE bond indices are more volatile than both the Direct RE and the annual RE debt indices that are prone to smoothing effects.
- RE Stocks and RE Bonds posted significant declines from Q1 2022 as the war in Ukraine started and inflation escalated with public markets pricing in the central bank rate hikes immediately.
- Despite a recent recovery, both RE stocks and RE Bonds have underperformed Direct RE since 2014. In the case of RE stocks this is mostly due to the higher leverage of REITs while the INREV ALI is unlevered.
- Direct RE and RE debt performance had a delay of two quarters before their decline, with the latter forecasted to recover in 2024.
- Separately, RE debt index outperformed RE bond index. RE debt index is estimated based on a 5-year constant maturity and pricings of new loans from the AEW loan database.
- Next, we consider how the various quadrant returns are correlated.
HIGHER QUADRANT CORRELATIONS FOR LONGER HOLDING PERIODS
- The correlations between each pair of quadrants varies depending on the holding period.
- As expected, if we look at quarterly returns, we see low and near-zero correlations between most quadrants with the exception of RE bonds and RE stocks, as well as direct RE and RE debt.
- The reason for these exceptions is the smoothed nature of private (debt and equity) assets returns and an increased volatility of public instruments that react similarly to changes in interest rates.
- However, correlations increase with longer holding period across all pairs: one- and three-year holding periods have increasingly high correlations between the quadrants.
- These higher 3-year correlations confirm that returns are driven by direct real estate more than the form of the instrument through which investors get the exposure.
- Unfortunately, this does somewhat limit the benefits of diversification across the quadrants for long term investors.
- Finally, we note that the long-term correlation between RE stocks and direct RE are only around 60%.
LESSONS FROM CORRELATIONS BETWEEN QUADRANTS
RE STOCKS ARE MORE CORRELATED WITH LAGGED DIRECT RE SERIES
- We also look into whether changes in capital returns of RE stocks can be used to anticipate changes in values of direct RE.
- The chart shows the correlation between capital returns of RE stocks index and the three direct RE indices with no- to-four quarters lag.
- No-lag correlation of RE stocks with GS CPPI stands at 84% but trails down to zero as we lag the GS series to four quarters.
- CPPI index is constructed partly based on actual and failed transaction data and is published shortly after quarter-end.
- The correlation between RE stocks and the other two direct RE indices increases from its initial level of 50-60% to just below 80% with a two quarters lag.
- This means RE stocks may best signal direct RE annual capital value movements two quarters in advance for these series.
- RE stocks recovered by 22% in Q4 2023, supporting our earlier projections for a rebound in private RE.
- Next, we can consider whether real estate stocks and bonds’ under- performance has been associated with non-real estate market indices.
RE STOCKS & NON-RE STOCKS REVERSE DECOUPLING
- If we start with stocks, some interesting patterns emerge when we incorporate the performance of non-real estate stocks.
- Up to Q1 2022, there was a high correlation between RE and non-real estate stocks (S&P 350). After the surge in inflation and rates, RE stocks fell by over 40%. With rates stabilizing, RE stocks recovered by 22% in Q4 2023.
- Real estate has been and remains an interest-rate-sensitive sector. This is especially true for RE stocks with high level of leverage.
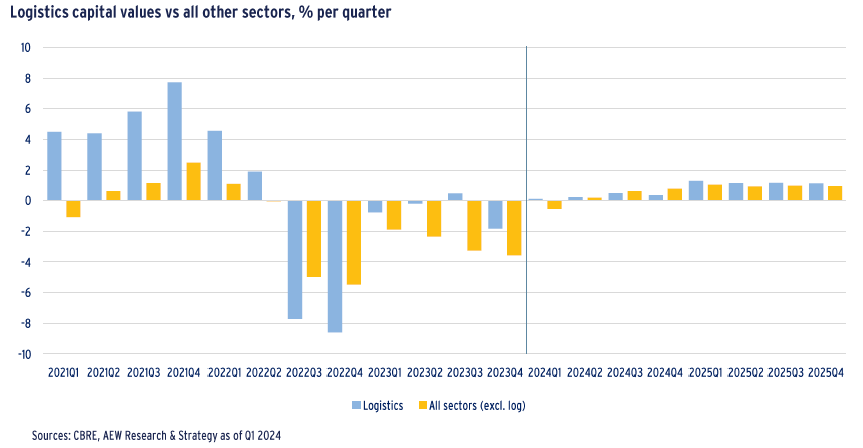
- Concerns about the impact from working-from-home hurt office REIT stocks and Amazon's global announcement on reduction in their warehouse needs also hurt logistics REITs.
- Direct real estate returns peaked in Q1 2022 and have come down by 10% since then, stabilising in the most recent two quarters.
- This delayed and dampened decline in private real estate is likely triggered by common fundamentals like rates and inflation.
- This supports our earlier private RE projections for a rebound in 2024.
BOTH RE & NON-RE BONDS FAST TO REACT TO INTEREST RATES
- Total returns of European RE bonds are highly correlated with the corporate bond index.
- The RE Bond index has appreciated by nearly 30% between 2014 and 2021 – in line with private RE debt but well ahead of corporate bonds.
- RE bonds show more volatility than the corporate bond index while private RE debt had more stable performance.
- With the start of the policy rate hiking cycle in Europe, the bond markets quickly reacted. They lost most of the accumulated value in four quarters to Q3 2022, especially in RE bonds.
- As inflation came down and future policy rate expectations stabilized in 2023, a revival of the bond indices has followed.
- Similar to the equity side of the market, private RE debt market’s correction lagged the public markets .
- Based on the public market recovery it would be reasonable to expect private RE debt to stabilize even if it remained on a downward trajectory as of Q2 2023.
This material is intended for information purposes only and does not constitute investment advice or a recommendation. The information and opinions contained in the material have been compiled or arrived at based upon information obtained from sources believed to be reliable, but we do not guarantee its accuracy, completeness or fairness. Opinions expressed reflect prevailing market conditions and are subject to change. Neither this material, nor any of its contents, may be used for any purpose without the consent and knowledge of AEW. There is no assurance that any prediction, projection or forecast will be realized.