CRE LENDING STABILISES WHILE DEBT FUNDING GAP REMAINS
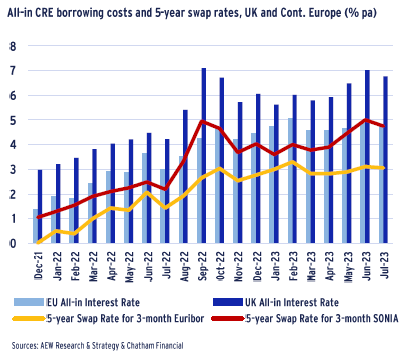
- All-in borrowing costs reached a new 20-year record high in European real estate. Q2 2023 Euro and Sterling all-in borrowing costs have started to stabilise as 5-year swap rates paused after multiple ECB and BoE rate hikes have started to bring inflation down.
- Signs of stabilisation in borrowing costs are further confirmed by Green Street data on REITs’ unsecured bond yields as well as our in-house market level all-in interest costs after posting more rapid increases over the previous five quarters.
- The improvement in the latest CREFC financial covenant sentiment survey has not yet translated in a reversal of the downward trend in actual loan LTVs. Regardless, we still expect to see LTVs stabilise at 50% by the end of 2023.
- Lower refinancing LTVs together with the already accumulated capital value declines for some of the underlying collateral amplified by the higher interest rates might trigger significant refinancing problems for loans maturing in 2023-26.
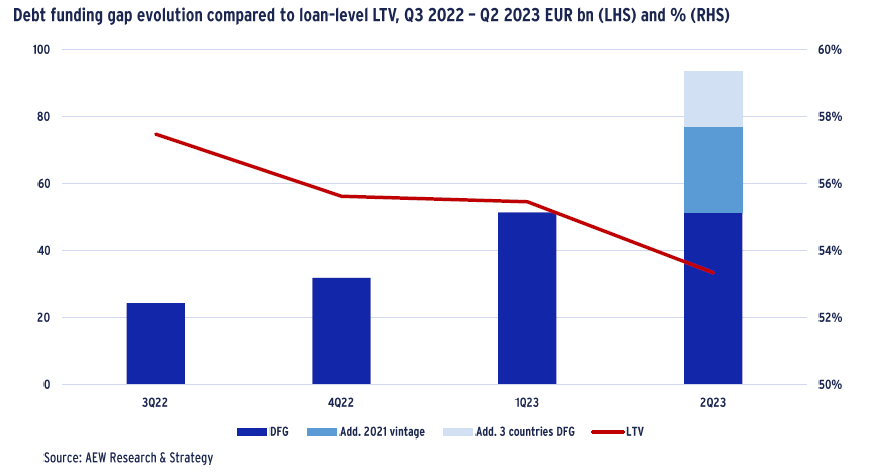
- The extent to which refinancing may pose challenges is estimated by our debt funding gap (DFG). This is defined as the gap to be bridged between the original debt amount due at loan maturity and new debt available to repay for each loan vintage per sector.
- Our latest expanded and updated DFG analysis implies a cumulative €93bn DFG for the 2023-26 period across six countries. This should be bridged by a combination of new equity top-ups, senior loan extensions & restructurings and junior debt insertions.
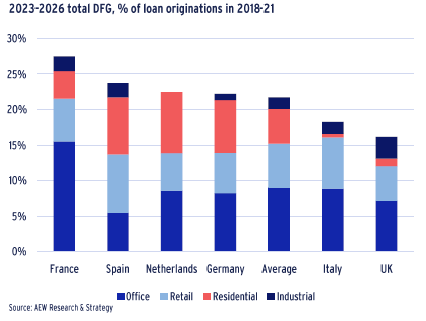
- For the first time we report our DFG as a % of loan amounts originated as it stands at 21%. There are some unexpected differences between countries. France is well above our six country average while Italy and the UK post below average relative DFGs.
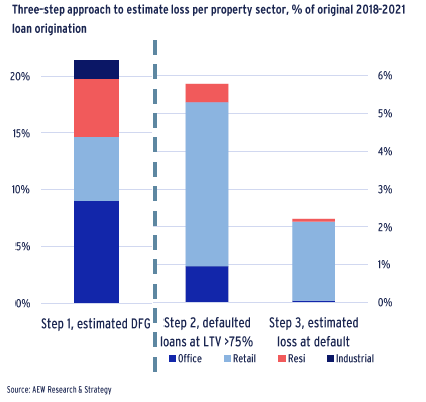
- After assuming defaults for any vintage segment with an LTV at refi of above 75% we estimate that 5.8% of the original 2018-2021 loan origination will default at maturity. After adjusting for enforcement costs, we estimate expected losses from 2018-21 vintage CRE loans at 2.2%. Losses are concentrated in loans with retail collateral and are in line with historical European CMBS loan losses.
- EBA data shows that European banks have sufficient reserves to absorb these losses, which means that CRE loans in themselves should not present a systemic risk to European banking in the current cycle.
2022 AVERAGE ACQUISITION LTV COMES DOWN TO 47%
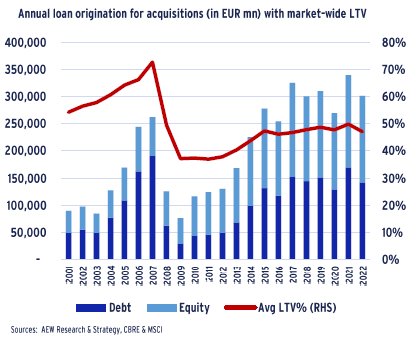
- Based on our latest data and estimates, debt financing used to fund new acquisitions reduced by 16% from 2021 (with a post–GFC record of €170bn) to €142bn in 2022.
- This was due to the increases in all-in interest rates, which started to negatively impact the demand for debt as it was no longer accretive and started hitting transaction volumes from mid-year 2022.
- Transaction volumes in the first half of 2023 were down by nearly 60% compared to the same period in 2022 as most investors paused to absorb capital value declines and assess further pricing adjustments.
- As a result, the total amount of debt over acquisition volumes reduced to 47% from 50% in 2021. We expect a further reduction based on much lower volumes for the full year 2023.
- However, in a historical context the current below 50% acquisition loan to value ratios (LTVs) should prove less challenging than the pre-GFC debt origination in 2007 at an average of 73% LTV.
BALANCE SHEET LTVs MOVE UP WHILE LOAN LTVs STABILISE
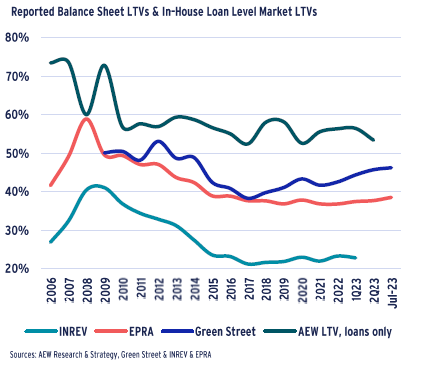
- The latest data confirms a steady increase in reported balance sheet LTVs and a stable gap between the latest available INREV (private real estate funds) and EPRA (public real estate companies) reported All Europe LTVs.
- As a result of reported valuation adjustments, the reported Q1 2023 INREV and EPRA LTVs have increased by 90 bps and 140 bps since year-end 2021, respectively.
- Green Street data shows a stronger upward trend for REIT LTVs than EPRA data. This is due to the fact they have a different definition of LTV, which includes unfunded liabilities and more frequently update analysts’ estimates.
- Reported REIT and private fund LTVs still remain well below 2008-09 record levels, providing similar comfort as from our acquisition LTV data above.
- In contrast to reported balance sheet LTV, our in-house loan-level LTV market data shows a decline in LTVs over the last quarter returning to its 2020 level.
- It should be noted that our loan level data disregards non-leveraged transactions and is sensitive to transaction volumes, resulting in higher and more volatile LTV levels ranging between 52% and 60% over the last 10 years.
- The balance sheet data in particular provides useful context but cannot be directly applied to any analyses of re-financing challenges as they lack any reference to origination dates.
SWAP RATES AND ALL-IN BORROWING COSTS STABILISE
- All-in CRE borrowing costs in Euros have started to stabilise below 5% since Feb-23. Sterling-based borrowers still face elevated debt costs at 6.8% today but they have been trending down in Jul-23.
- As the prolonged period of high inflation is coming to an end and central banks are expected to slow their rate hikes in H2 2023, both Sterling and Euro swap rates are stabilising at below 5% and just above 3%, respectively.
- On the other hand, UK swap rates remain high and reached 5% in Jun-23 returning to the record Sep-22 heights of the failed mini budget levels.
- This divergence between European and UK CRE borrowing costs is likely to trigger a more severe impact on the UK markets in terms of repricing, transaction volumes, and lending volumes – despite Europe facing similar issues.
- Higher interest rates and declining collateral values are very likely to impact refinancing of existing legacy loans as these pose problems with LTV and ICR/DSCR covenants at loan maturity in the next few years.
- This issue will be addressed later in the report, when we provide an update on our debt funding gap analysis.
POST-PANDEMIC LOANS AT HIGHER RATES & LOWER LTVs
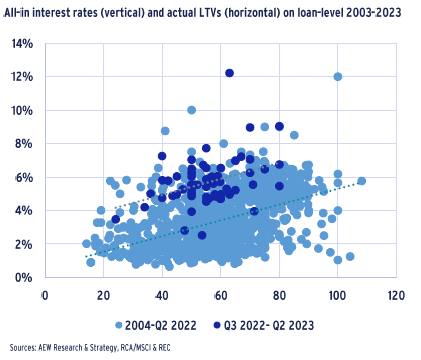
- We updated our in-house granular loan by loan database with loans originated since Aug-22 to bring our data set close to over 1,500 loans from our three sources – AEW lending and finance platforms, RCA/MSCI and REC.
- As before, our data goes back to 2003 and we estimate that it covers about 10% of acquisition debt origination since 2010 and is believed to be representative for terms in the overall market.
- Our scatter chart data shows that the loans originated in the last four quarters remain in the lower LTV category relative to the previous set of earlier loan observations. More recent loans also have higher interest rates, on average.
- As before, our granular loan level data allows for a more precise interrogation of the impact of external market shocks, like the recent increase in the 5-year swap rates.
- It also allows for some comparisons with other sources, like Green Street and Chatham Financial.
ALL-IN RATES MORE THAN DOUBLE IN 18 MONTHS TO NEW RECORD HIGH
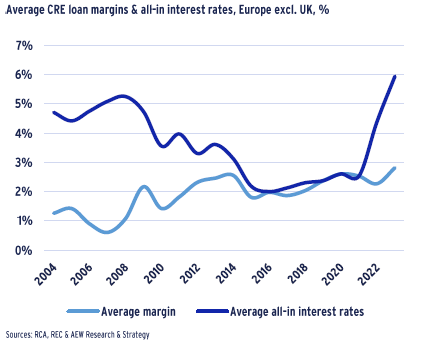
- Based on our granular loan-by-loan data, loan margins reached the highest level on record at 2.8%. Please note that our loan margins are higher than the ones reported by Chatham Financial and shown on the previous page.
- An extraordinary increase in the five-year swap rates together with these increased margins, has pushed the all-in interest rates in Europe ex UK to 5.9% as of mid-2023. This is the highest level since our database begins in 2003.
- Since the start of the rate increases in 2022, the average all-in cost increased by 3.4 percentage points, more than doubling since the end of 2021.
- The increase in all-in interest rates made debt less attractive for most leveraged equity investors, making them abstain from new leveraged acquisitions. This has already pushed prices down and acquisition yields up.
- Full equity investors might also pause to ensure no further price and valuation declines might hurt their returns.
- Leveraged investors with legacy financings will face increasing debt service costs when refinancing existing assets, further limiting their ability for new acquisitions.
INCREASE IN ALL-IN RATES IN ALL MAJOR MARKETS
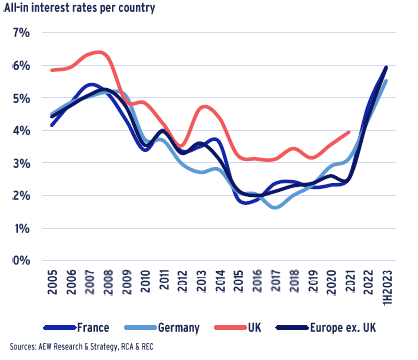
- Our granular loan-level data confirms the trends shown earlier that European all-in interest rates are consistent across the major national markets.
- French all-in rates have increased by an impressive 350bps since 2021 reaching 6.0%, the highest level in the last 20 years.
- German all-in rates increased by a more modest 250 bps in 2023 from year-end 2021 reaching their highest level since 2005.
- In-house UK loan data does not allow yet to estimate average all-in rates for 2022-23 as it lacks sufficient qualifying observations. This is driven mostly by our lending business being focused on non-UK markets.
- Based on other sources presented in the report, it does seem very likely that the UK has also set new record high borrowing costs by mid-year 2023.
- For France and Germany we are able to mobilise 76 loan data points from our in-house database over the 2021-23 YTD period.
UNSECURED REIT BOND YIELDS WIDENED BY NEARLY 500 BPs
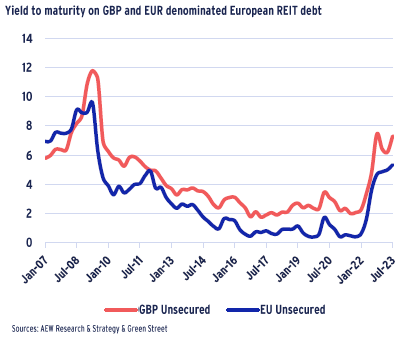
- Historical data from Green Street provides an interesting comparison between the costs (as expressed in yield-to-maturity) for Euro and Sterling-denominated REIT bonds.
- Sterling REIT bonds have consistently shown higher yields than Euro-denominated bonds as UK government and corporate bond yields remained elevated post-GFC and post-Brexit.
- Both bond yield series show a significant increase since early 2022, as central banks started their rate hikes to fight the higher inflation triggered by the war in Ukraine and remaining Covid-linked supply chain issues.
- REIT bond yields increased by nearly 500 bps over 18 months. This is in line with the increase post-GFC for Sterling REIT bonds but exceeds GFC increase for Euro-denominated REIT bonds.
- Sterling REIT bond yields also showed more volatility leading up to the resignation of the UK Prime Minister in Oct-22 and her subsequent replacement.
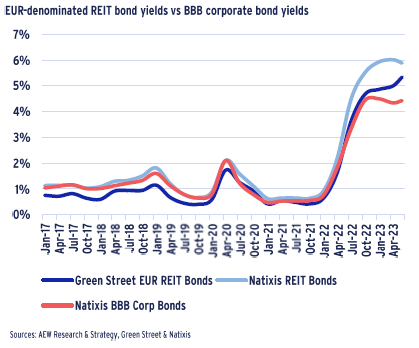
FIRST SIGNS THAT REIT BOND YIELDS HAVE STARTED TO STABILISE
- When we consider additional data on both BBB corporate bonds and REIT bond yields, the picture changes somewhat.
- Despite the high historical correlation between Green Street and Natixis sourced REIT bonds yield data as well as BBB corporate bond yield data, the series shows different trends over the last 12 months.
- Natixis sourced data shows a stabilisation in both REIT bond yields and BBB corporate bond yields, while Green Street REIT bond yields have continued on an upwards trend.
- Given the continued dominance of banks in European CRE lending and the limited number of bond issuances from European REITs, it is easy to overstate the relevance of these differences among sources.
- Inclusion of a small number of unrated and/or illiquid REIT bonds can move a yield series significantly.
- It might suffice to note that there are initial signs that REIT bond yields have started to stabilise.
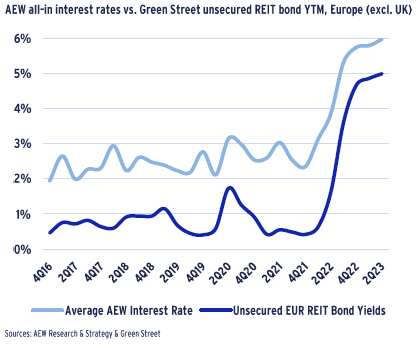
CRE BOND YIELD WIDENING AND LOAN RATE INCREASES SLOW IN 2Q23
- CRE loan and bond costs went up by 365 bps and 450 bps, respectively, since year-end 2021 as we compare our in-house market level secured mortgage interest rates to Green Street’s unsecured REIT bond yields.
- During Q2 2023 there was a slowing of both bond yields moving up as CRE loan all-in borrowing costs increased.
- The near 200 bps gap between bond yields and private loan costs has come down to less than 100 bps as bond markets repriced risk more.
- The latest data re-confirms the high degree of correlation between the two data series, especially since year-end 2021.
- These large and quick rises since 2021 emphasise the impact of the rate hikes as central banks are gaining control over the stubbornly high inflation triggered by the war in Ukraine and lingering supply chain issues.
- As central banks reversed their QE policies, the broader bond markets have seen bond yields widen as credit conditions have worsened as the largest buyer of bonds – central banks – ceased to be active.
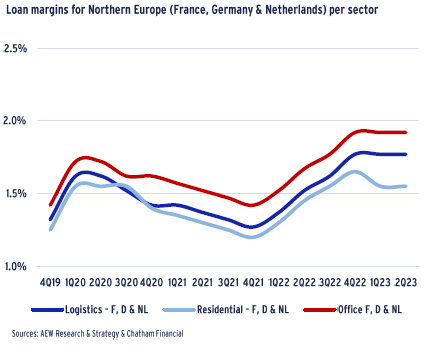
LOAN MARGIN STABILITY ACROSS CORE CONTINENTAL EUROPE
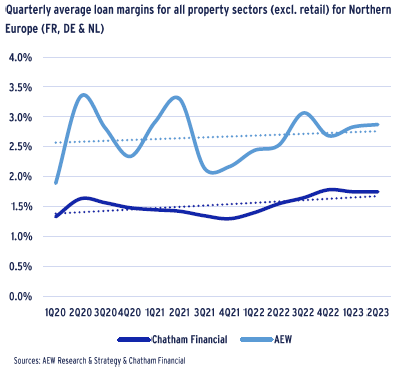
- Quarterly data from Chatham Financial shows CRE loan margins for Northern European markets (France, Germany & Netherlands) have stabilised between 155 and 190 basis points over the last three quarters.
- Chatham Financial’s data is based on loan origination records sourced from its debt and hedging advisory business and filters for senior loans with LTVs at around 50%.
- Office loan margins have remained 15 bps higher than logistics over recent quarters, while residential margins have tightened by 10 bps.
- After the initial Q1 2020 Covid shock, margins settled back down to their pre-Covid Q4 2019 levels over the subsequent two years.
- However, the 50 bps increase from Q1 2022 has started to wear off and loan margins have stabilised or even tightened in the case of residential loans.
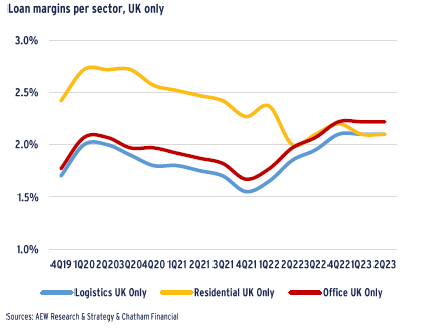
UK LOAN MARGINS REMAIN HIGHER
- The latest quarterly historical data for the UK only show some interesting trends when compared with the rest of core Europe.
- First, UK margins for office and logistics are 50-60 bps above the Northern European averages. This is likely due to higher funding costs for UK banks compared to their European counterparts, some of which have access to covered bond funding.
- Second, loan margins for UK residential have moved in line with other UK sectors since our last report but remain 65 bps above their Northern European residential averages.
- This adjustment can be explained by a lower proportion of development loans in the UK for the last year in the Chatham Financial data sample.
- Similarities between the UK and Northern Europe are evident from the timing of the changes in margins over the available period as far as the impact of adverse credit trends on margins.
PACE OF LOAN MARGIN INCREASES SLOWS
- Despite inter-period Covid-related fluctuations, CRE loan margins have trended up modestly by 30 bps since year-end 2019.
- But margin increases have started to slow in H1 2023 based on both the Chatham Financial and AEW in-house loan data.
- As before, our AEW loan margin data shows a more volatile and elevated pattern compared to Chatham Financial’s margins as the loan data samples remain consistently different from each other.
- Similar to Chatham Financial, our margins show the impact of the initial Covid lockdowns in Q1 2020, the start of the war in Ukraine in Q2 2022, and subsequent central bank rate hikes.
- However, our latest Q1 and Q2 2023 data show a moderating trend and slower widening in both Chatham Financial and AEW data series.
- Our in-house data is less stable when compared on a quarterly basis, highlighting the need for an industry-wide loan-by-loan data source to pool these data.
- We note Moody’s recently re-launched the European CRE loan data consortium as a step in the right direction.
SENTIMENT ON LOAN PRICING & MARGINS STABILISING IN Q2
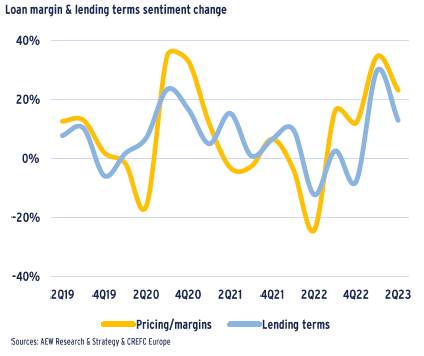
- Latest available data from CREFC Europe (the trade association for real estate finance) shows that loan margins might have peaked in Q1 2023.
- Their Q2 2023 quarterly survey responses show a similar decrease in expected loan margins, likely in response to a moderation in inflation and an expectation central bank base rate hikes will start to slow.
- Therefore, it would be reasonable to expect further margin stabilisation as the macro rebound continues and the outlook remains positive.
- The latest data also reconfirms the close correlation between general lending terms and the loan pricing and margin outlook. When margins are anticipated to go up, lending terms tighten, albeit to a lesser extent.
- As before the CREFC data comes from a survey among leading banks, insurers, debt funds, borrowers, and advisors across Europe, incl. the UK.
- Please note that the published CREFC Financial Covenant Sentiment Index is calculated by weighing the survey respondents’ answers but post-3Q20 we calculate it as an average for LTV and ICR expectations.
FINANCIAL COVENANT TIGHTENING STARTING TO EASE
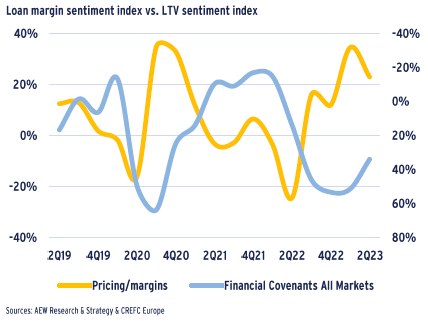
- The latest CREFC Europe data shows that financial covenant tightening might have peaked in Q1 2023 and has started to relax in Q2 2023.
- Again, this relaxation in covenants is likely triggered by the steady decline in inflation, continuing macroeconomic recovery and the expectations that rate hikes and interest rate increases will start to slow down.
- The recent data reconfirms that financial covenant sentiment and loan margins are negatively correlated. In short, when lenders want to become more cautious, financial covenants become stricter and margins go up.
- Please note that we have replaced LTV covenants with the average of LTV and ICR covenants as they are highly correlated anyway and the combination allows for a longer historical analysis.
- Based on this it would be reasonable to expect further margin stabilisation and covenant easing as long as central banks slow on hikes as inflation comes down and a recession is avoided.
ACTUAL LTVs LAG BEHIND SENTIMENT SIGNALS
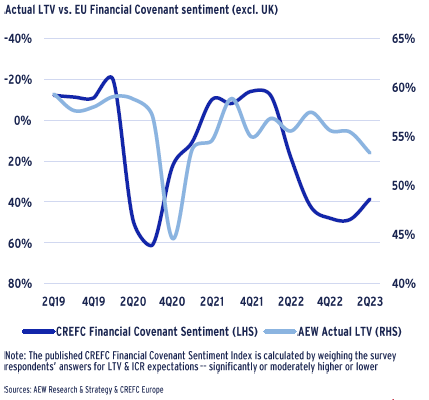
- CREFC Europe’s sentiment survey allows a further analysis of our in-house loan-by-loan data for Europe excluding the UK.
- The high degree of correlation between the change in the CREFC financial covenant sentiment and actual loan LTVs is remarkable.
- The Covid-linked Q2 and Q3 2020 LTV sentiment movement show a delayed impact on actual LTVs dropping from 60% to 45% in Q4 2020.
- Compared to the more synchronised movement in the LTV in 2020-2021, we currently observe a more delayed and slower reduction of actual LTVs relative to survey sentiment.
- Our latest actual loan-level LTV figures stand at 53%, 6% down from the peak levels of 59% in Q2 2020 and Q3 2021.
- CREFC financial covenant sentiment has marginally improved from Q2 2023, implying that lenders might stop further reducing their actual LTVs.
- In other words actual LTVs have lagged the CREFC sentiment survey since mid-year 2022. This could mean that there is an increased delay.
- But, if our actual LTVs are representative it could also mean that the extent of upcoming refinancing problems in the next three years might be less severe if lenders’ LTVs stay above 50%.
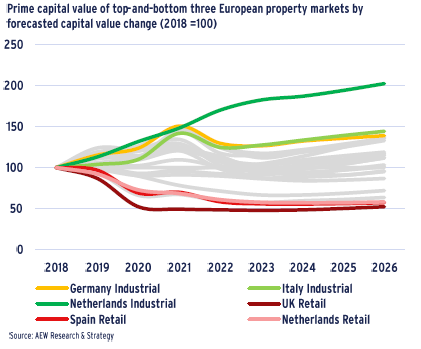
RANGE OF VALUES CHANGES FROM 2018 BETWEEN -50% AND +100%
- When considering re-financings of loans maturing in 2023 and after, we look at the underlying collateral values changes since loan origination.
- European loan maturities are not standard and typically range between 3 and 7 years, hence we assume an average loan maturity of 5 years. Loans maturing in 2023 were, therefore, assumed to have originated in 2018.
- Based on this we can evaluate the prime capital values development for sectors across the UK, France, Germany, Netherlands, Italy, and Spain from 2018 to 2026 based on AEW’s historical and forecast prime values.
- Unsurprisingly, retail sectors are forecast to be at the bottom, as the UK, Spain, and the Netherlands retail lose nearly half of their value by 2026, most of these declines having already occurred.
- In the top three capital value improvers, we note the Netherlands1, Italy, and Germany industrial prime assets that are forecast to gain 100%, 44%, and 38% in nominal value between 2018 and 2026.
- Other sectors’ capital value growth varies between these ranges. These are outlined in grey to simplify their visual impact.
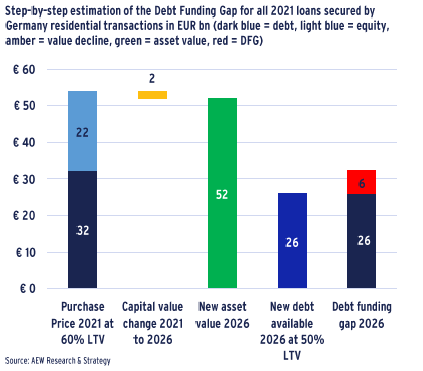
RECORD 2021 GERMAN RESIDENTIAL VOLUMES POSE RISK
- Apart from a decline in collateral value, the CREFC survey results show that lenders will reduce their actual LTVs downwards to 50%.
- As an example, we provide our estimate of the debt funding gap (DFG) for 2021 originated loans secured by German residential collateral as follows:
- 1) Transaction volumes are adjusted for non-levered deals.
- 2) Average LTV of 60% at purchase in the year 2021 is assumed.
- 3) 5-year capital value forecast for Germany’s residential sector shows a -3.4% decline in value between 2021 and 2026.
- 4) New debt volume is estimated at 50% LTV of new value.
- 5) Additional equity (or junior debt) is needed to avoid loan default, we highlight this in red as the debt funding gap.
- The unusually large volume of transactions in this sector in 2021, lower refinance LTVs and negative capital value growth create a debt funding gap of €6.3 bn in Germany’s residential sector in 2026.
- 2021 Germany residential loans trigger our largest single country-sector DFG.
- However, as these loans only refinance in 2026 they are increasingly sensitive to the underlying value assumptions than closer vintages.
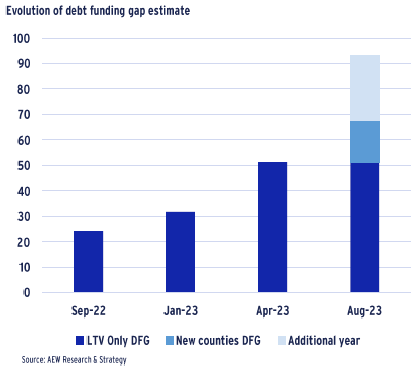
DFG NEARLY DOUBLES WITH ADDITIONAL LOAN VINTAGES & COUNTRIES
- To allow for greater comparison, we have extended our analysis to include three more countries: Netherlands, Italy, and Spain.
- The three additional countries added a cumulative €16bn to the total DFG estimate over the period from 2023 - 2025.
- Additionally, we add 2021 as one more year of loan vintages that are assumed to mature in 2026.
- Based on discussions with loan servicers and others, we understand that 2018 vintage loans maturing in 2023 are not refinanced or paid off but rather extended for a 1-2 year period.
- This is a solid justification to keep 2023 maturities fully included in our cumulative DFG estimates.
- Since our capital values forecast and assumptions remain unchanged from our Mar-23 estimates this extension of the vintages to 2021 adds additional €26bn to our cumulative DFG.
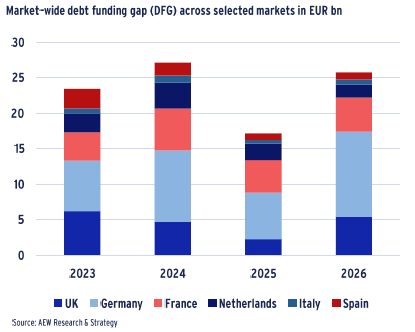
EUR 93 BN DEBT FUNDING GAP QUANTIFIED FOR 2023-26
- Based on the above example, DFG analysis expansion, which is repeated for all four sectors in six countries and across the 2018-21 loan vintages, we estimate a €93bn in DFG for the 2023-26 period.
- Around 38% of this funding gap is related to German real estate debt (€36bn), followed by France (€19bn), and the UK (€19 bn).
- Our three new expansion countries (NL, IT & ES) contribute only around 21% to the total DFG with €20bn when also considering the additional 2021 vintage for those countries.
- In terms of loan vintages, the largest portion of the cumulative DFG falls into 2024 with €27bn, followed by €26bn in 2026.
- The drop in the 2025 DFG to €17bn is likely driven by a Covid-related decline in transaction and associated lending volumes in 2020.
- In terms of sector distribution, the largest DFG comes from the office sector with €39bn, followed by retail with €25bn, residential with €22bn, and industrial with €7bn.
FRANCE HAS THE LARGEST DFG AS A % OF LOAN ORIGINATIONS
- The absolute volumes of DFG are indicative of the potential refinancing problem, but they need to be scaled by the total originated loan volumes to rank each country by the relative severity of the refinancing problem.
- The €19bn DFG in France represents 27% of all loan originations backed by commercial property financed in the 2018-21 period. This is the highest share of loans affected across the six countries covered.
- The average share across the six countries stands at 21%, indicating that one-fifth of the volumes cannot refinance when the loans come due.
- Germany and the Netherlands figures stand at 22%, which is marginally above average.
- Surprisingly, Italy’s share stands at a below-average 18%, while the UK’s share is only 16%.
- The limited UK DFG is likely due to the constrained pre-2018 UK capital appreciation limiting the need for repricing in all non-retail sectors.
2018-21 CRE LOAN LOSSES IN LINE WITH HISTORICAL CMBS LOSSES
- Since our DFG does not directly translate into expected losses for CRE lenders, we estimate losses using the following assumptions across all six countries four property sectors, and four loan vintages in three steps:
- 1) We start with the estimated DFG of 22% of original 2018-21 loan originations as explained above.
- 2) Loans in a specific vintage segment will not refinance if the LTV at refi is above 75%, in which case the loan defaults, and the lender would repossess and sell the collateral to recover its principal. We disregard any unpaid accumulated interest.
- 3) At default, we assume an enforcement-related cost of 25% of the estimated collateral value at resale, with any remainder recovered by the lender.
- Based on these steps, we estimate that 5.8% of CRE loans will default on maturity, and the total CRE loan losses for the 2018-21 vintages come at 2.2% of the original principal amount.
- This means that the implied loss given default is 40%.
- Our loan losses are concentrated in the retail sector, which saw the largest repricing since 2018.
- Finally, our loss estimates are in line with historical post-GFC European CMBS losses at 2.3% as provided elsewhere.
EU-WIDE BANK LENDING RECOVERED POST-COVID
- To assess the impact of our debt funding gap analyses on banks, we have taken a closer look at how European banks are positioned to absorb the upcoming re-financings and any related loan defaults and losses.
- In order to do so, we have provided some key data and analyses from our research colleagues at Natixis based on current EBA disclosures.
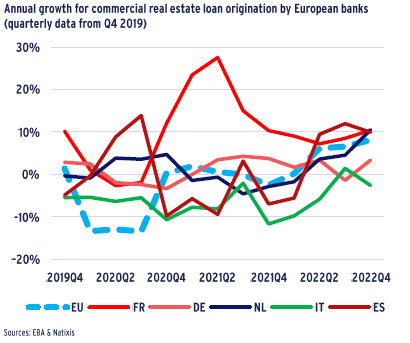
- These analyses show that CRE lending has recovered post-COVID.
- Despite this rebound, there was an overall reduction in annual bank loan origination to CRE across the EU of -1% pa since 2019. Also, there have been some unexpected differences across European countries.
- Banks in Italy (as well as Portuguese and Greek banks) have drastically cut their CRE lending since early 2019 by an annual average of -6% pa.
- On the other hand, French banks increased their CRE lending over the same period by 10% pa, with growth of over 20% in 2021 alone.
- Alarming as these French figures might seem at first glance, they do need to be placed in their proper context to be fully appreciated.
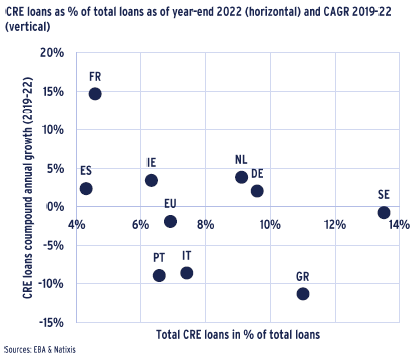
CRE LOANS AT LESS THAN 7% OF EU-BANKS OVERALL LENDING
- Data from the European Banking Authority (EBA) shows that commercial real estate loans make up less than 7% of EU banks lending books as of year-end 2022.
- Significant outliers from this EU average are highlighted by Sweden and Greece at 14% and 11% CRE shares respectively, while Spanish and French banks record 4% and 5% CRE shares.
- Since French banks have a small 5% CRE share of total lending, their recent aggressive growth in CRE lending volumes reduces the concern from CRE loans for the overall stability of the French banking system.
- Please note that sometimes SME loans secured by real estate collateral are not classified as CRE loans but rather as corporate loans.
- In comparison, German banks are above the 7% EU average at 10%. However, they recorded relatively modest growth of 2% pa over the 2019-22 period.
- In the end, we take comfort from the latest (Jul-23) EBA bank stress testing results which showed robust results with only 3 of 70 tested EU banks being forced to raise capital in a doomsday scenario.
- These latest EBA results are in line with recent BoE and Fed test results.
BANK RATIOS SHOW LIMITED SYSTEM CONCERNS
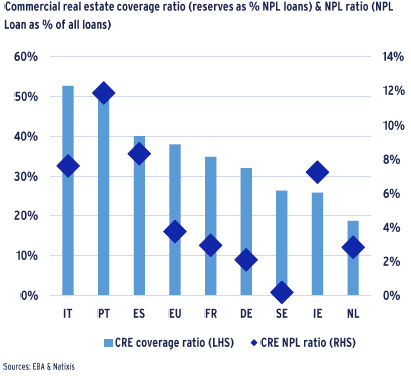
- To assess whether European banks are able to absorb upcoming losses on their commercial real estate (CRE) loans, we use two key indicators:
- 1) CRE coverage ratio (reserves as % of non-performing CRE loans)
- 2) Non-performing loan ratio (NPL CRE loans as % of All Loans)
- On average, across the EU banks have already reserved nearly 40% of expected NPL CRE loans. Again, there are some surprising discrepancies with Dutch banks at 19% while Italian banks are well prepared at 53%.
- It seems that countries that experienced significant issues with CRE loans in the GFC have much higher coverage ratios than others. This is likely a result of closer regulatory oversight and lingering post-GFC NPL issues.
- On the other hand, NPL ratios are low at less than 4% for the EU as a whole. Some countries are at multiples of these EU average levels - Portugal stands at 12% while Italy and Spain are at 8% and Ireland at 7%. These are likely NPLs left over from extended loans from the GFC era.
- In short, both ratios confirm limited concerns about bank lending to CRE.
- Regardless, we expect the EBA and other regulators to closely monitor CRE and other NPLs to ensure European banks are sufficiently reserved in the future to meet upcoming losses.
This material is intended for information purposes only and does not constitute investment advice or a recommendation. The information and opinions contained in the material have been compiled or arrived at based upon information obtained from sources believed to be reliable, but we do not guarantee its accuracy, completeness or fairness. Opinions expressed reflect prevailing market conditions and are subject to change. Neither this material, nor any of its contents, may be used for any purpose without the consent and knowledge of AEW. There is no assurance that any prediction, projection or forecast will be realized.
Photo Credit: Adobe