By using this site you agree to our updated Privacy Statement and Terms of Use. For more information for the protection of non-public information collected on this site please view our Privacy Statement.
1. Except Necessary Cookies. Necessary cookies are essential to the proper function of our site. They allow you to move around the site and use its features. Without these cookies, we cannot provide services through the site.
DEBT FUNDING GAP WIDENS AS LOWER COLLATERAL VALUES & ICR BITE
This report expands on our Sep-22 debt funding gap (DFG) analyses. The DFG is the potential shortfall between the original secured debt amount originated in a certain year and the amount available for refinance at the loan maturity.
Our current update incorporates our latest capital value forecasts as they drive up loan-to-values (LTVs) at refinancing as well as our assessment of the additional impact from higher rates on interest coverage ratios (ICR).
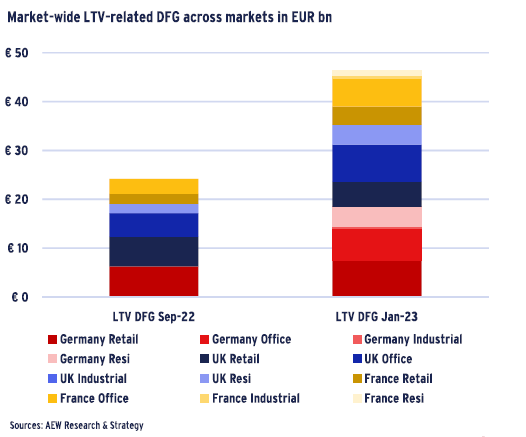
In the first instance, our LTV-related DFG is estimated now at EUR 32bn based on our latest forecasts. This is driven mostly by lower collateral value projections impacting 11 of 12 covered property sectors across our three countries compared to only 6 based in our previous projections.
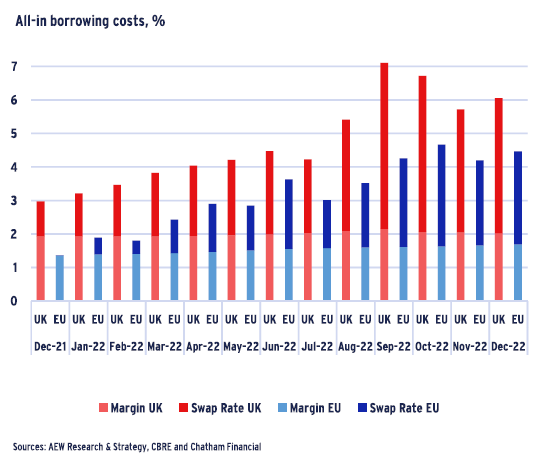
Secondly, additional concerns on upcoming refinancings are triggered by all-in interest rates, which doubled in 2022 and reached 6.3% for the UK and 4.0% for Europe by year-end 2022. As rates have now been elevated for some time, it seems appropriate to quantify the impact.
The disruptive impact of these rate increases is shown by ICRs for legacy loans due to refinance in 2023 dropping below 1.6 from their 10-year average of 3.25 across all sectors. This is unlikely to be either commercially appealing or acceptable from a regulatory and capital reserve perspective, especially for bank lenders.
Based on input from lending and finance experts, we set an ICR refi threshold in the range of 1.6 to 2.4. At the mid-point of 2.0, it implies a reasonable 50% of rental income being allocated for interest payments.
Based on these assumed ICR thresholds, the higher interest rate at refi and the current rental income allow us to estimate the available refi debt amount for each of the 12 sectors’ loan vintages maturing in 2023-25. In most cases, the available ICR-restricted refi debt is less than the original debt triggering a ICR-driven debt funding gap.
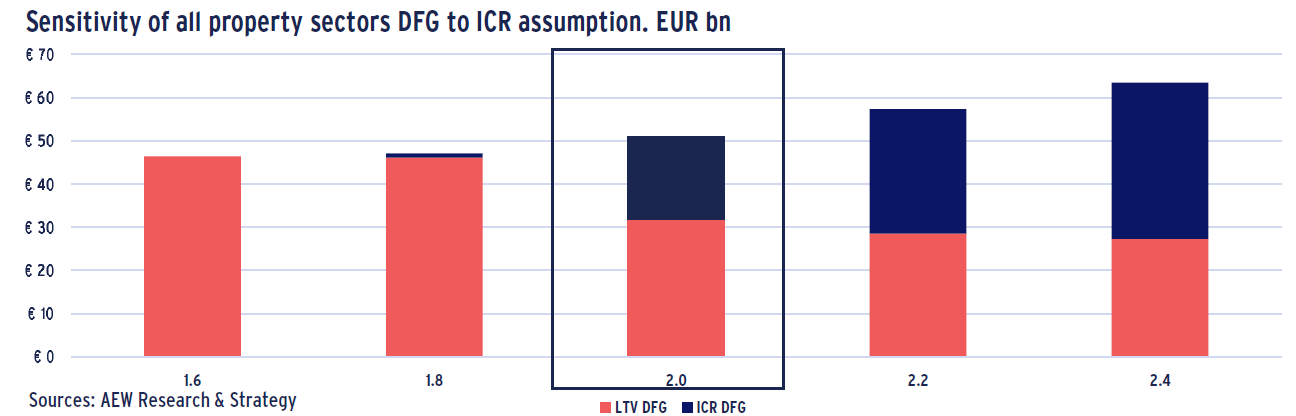
EUR 51bn is our estimated combined DFG by consolidating both our LTV and ICR refi restrictions across all sectors, where we assume that the most restrictive driver (ICR or LTV) per sector is classified as the DFG driver. The combined DFG result is sensitive to the assumed ICR threshold as shown below, especially if assumed at above 2.0.
The biggest change to our combined DFG estimate comes from including our new ICR requirement for the first time making up 37% of our combined DFG at the central 2.0 ICR assumption. Across countries, 45% of our combined DFG is related to Germany, 33% to the UK and 22% to France.
To bridge our widened gap, lenders and borrowers will have to be creative to restructure the capital stack to reach sustainable LTV and ICR levels. This will require more than the usual maturity extensions, covenant waivers, cash traps and/or partial restructuring of existing loans before they can be refinanced, especially with hedging requirements.
The legal and organisational infrastructure to deal with these challenges has improved in the aftermath of the GFC. However, the luxury of lower interest rates as in the post-GFC era is unlikely to assist us this time around.
SUSTAINED HIGHER RATES SHIFT FOCUS TO ICR COVERAGE
Despite inflation coming down from its +10% record level, central banks are still widely expected to further hike their base rates in early 2023.
As a result, 5-year swap rates for 3-month SONIA (UK) went up by 300 bps and for 3-month Euribor stepped up by 280 bps since Dec-21.
Swap rates came down from interim period record highs based on the UK mini-budget to settle at 4.0% (GBP) and 2.8% (EUR) at year-end 2022.
With loan margins edging up, this has led all-in borrowing costs to reach new record highs of 6.0% for the UK and 4.5% for Europe.
As rates have remained elevated for over two quarters, it is appropriate to assess their impact on refinancing via the interest coverage ratios (ICR).
The ICR estimates the cushion between available income and interest payable. At an ICR below 1.0, the income is insufficient to pay all interest.
Higher rates trigger issues with the refinancing of existing loans’ as elevated interest rates push down the ICR when legacy loans with low locked-in rates face higher rates at their refinancing.
This ICR coverage issue is a potential additional hurdle on top of the previously highlighted LTV-related restrictions that lenders will face.
LTVS AT REFI STILL EXPECTED TO COME DOWN
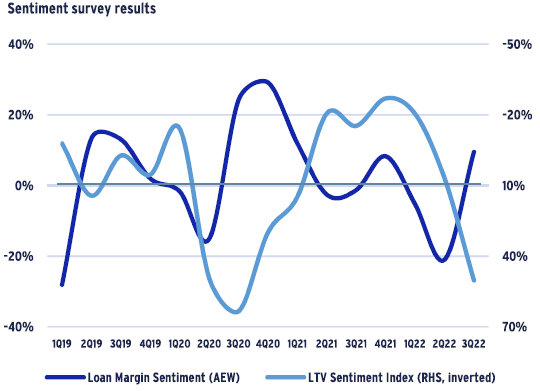
As previously shown in our Sep-22 report, European lenders react rationally to rate movement based on the CREFC sentiment survey.
Based on the Q3 2022 survey results, market sentiment related to LTV and loan margins are negatively correlated.
This means that when lenders want to become more cautious, both LTVs come down and margins go up. This is consistent with other sources.
As shown above, loan margins have moved out slowly over 2022, which is consistent with the survey sentiment.
Based on these results and widening swap rates, we continue to assume that lenders’ LTVs will decline, as in our previous analyses.
We feel that this is appropriate as both the ECB and Bank of England are still expected to raise their base rates further to control for inflation.
HIGHER RATES CUT ICR COVERAGE IN HALF
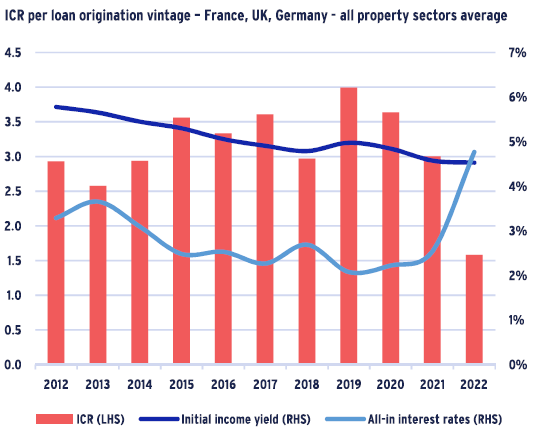
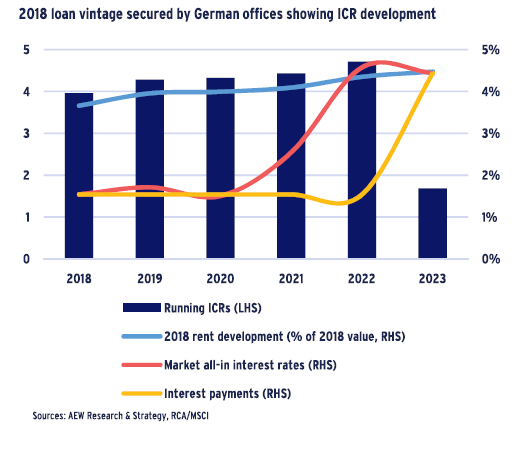
The disruptive impact of recent rate increases on the ICR is illustrated by the historical trends in both all-in interest rates and income yields.
In the last year, the estimated ICR more than halved as it dropped to below 1.6 from its 10-year (2012-21) average of 3.25.
This means that for the loans originated in 2022, lenders would have less than half their traditional interest coverage.
This is unlikely to be either commercially appealing or acceptable from a regulatory or capital reserve perspective, especially for bank lenders.
Since 2022, investors and lenders alike have benefited from solid ICRs helped by quantitative easing and rate cuts from central banks post-GFC.
But, these facilitating monetary policies had to be reversed as inflation moved well beyond target levels on the back of the Covid-related supply chain issues and the Ukraine-linked energy crisis.
Each year in the graph reflects only the loans originated in that year (loan vintage) based on the acquisition volumes and our assumed 60% LTV.
Income yields are based only on acquisitions completed each year and interest rates are based on our in-house loan-by-loan database.
CAPITAL VALUE DECLINES HIGHER THAN FORECASTED BEFORE
LTV-related refinancing issues are driven in part by the underlying collateral values and how they have evolved since the loan origination.
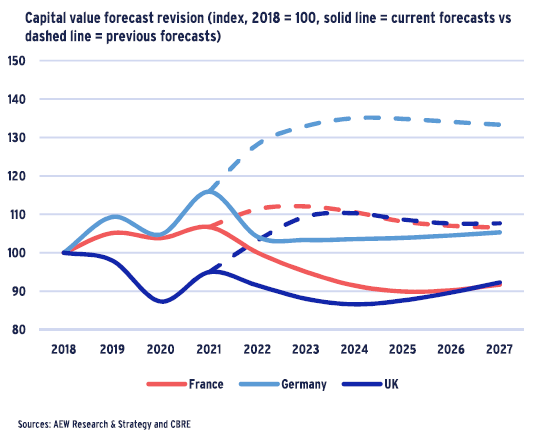
In that respect, prime capital values across the UK, France, and Germany have come down by 7% in 2022 alone.
This is the opposite of our initial 8% projected uplift for 2022 done when the Covid-rebound was still anticipated to be strong. This changes results in a 15% downward revision in our capital values for year-end 2022.
Since the cumulative downward revision based on our updated capital value forecasts compared to our previous forecasts is -20%, this means that most of the downside has already been priced in during 2022.
However, this is of little consolation to lenders that need to refinance legacy loans during 2023-2025, which were originated in 2018-2020.
The most dramatic cross-sector value decline since 2018 up to 2023 is projected for the UK at -12% followed by France at -5% while Germany still records a capital value appreciation.
It is important to note that value declines vary by sector, with retail having already absorbed significant declines.
LOWER ASSUMED REFINANCE LTVS INCREASE DFG
Apart from a decline in collateral value, the latest market data confirms the CREFC LTV sentiment results that lenders can be expected to reduce their actual LTVs downwards to 45-50%.
Therefore, we maintain our assumption of 50% refi LTV (same as Sep-22).
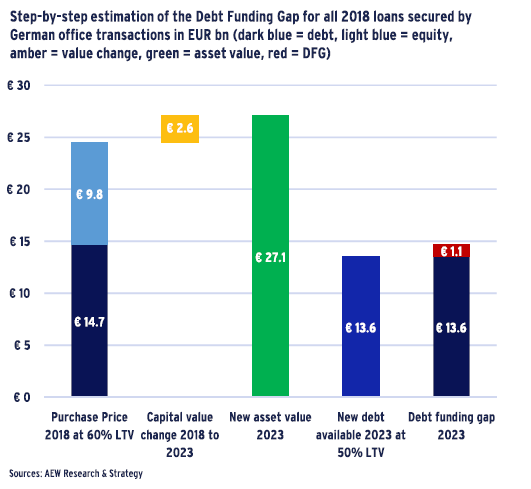
As an updated example, we provide our estimate of the LTV-related debt funding gap (DFG) for all 2018-originated German loans secured by office collateral as follows:
Set leveraged acquisitions by removing 100% equity deals.
60% average LTV is assumed for all EUR 24.5bn German office 2018 leveraged-only acquisitions.
Latest capital value forecast for German offices shows a +11% increase between 2018 and 2023.
New debt volume is estimated at 50% LTV of this new value.
Additional equity (or junior debt) is needed to avoid loan default, we highlight this in red as the debt funding gap.
Please note that most sectors do show a capital value decline. We use German offices specifically to show that even if values improve, the lower refi LTV can still trigger an LTV-related debt funding gap.
LTV-ONLY DFG DOUBLES TO EUR 46 BN
Based on our updated capital value forecasts, we now estimate an LTV-only DFG of EUR 46bn for the next three years. This is nearly double the EUR 24 bn LTV-only DFG we estimated in our Sep-22 report.
This increase is not yet taking into account potentially more restrictive ICR hurdles and is based on the negative impact of broader and deeper capital value declines impacting more sectors.
Using this LTV-only approach, 11 of 12 covered sectors are now showing a DFG with only UK industrial left unaffected. This is a big change from only 6 of 12 sectors showing a LTV-only DFG in Sep-22.
In fact, Germany now makes up 40% of this LTV-only debt funding gap while the UK is just behind at 36%, followed by France at 24%.
Across sectors, offices constitute 43% of the LTV-only DFG, followed by retail at 35%, residential at 20%, and logistics at 2%.
Comparisons with past DFG estimations from the immediate post-GFC era are problematic. Relative to the GFC, the market now faces the dual challenges of both declining values and increasing interest rates.
INCOME GROWTH INSUFFICIENT TO OFFSET TRIPLING OF RATES
Apart from our original LTV restriction, interest rate increases are detrimental to ICR ratios, which can pose an additional limit at refinance. Our German office loan 2018 vintage illustrates this with an original LTV of 60% and an initial estimated interest rate of 1.5%.
At the time of loan origination, German offices were transacted at a yield of 3.7%, which we use as a proxy for income relative to the value in 2018.
Actual market rents (2018-22) and forecasted growth for 2023 drive the rental income development over the assumed loan maturity (5 years).
At loan maturity in 2023, German office rents will have increased 19% since origination and reached 4.5% relative to 2018 acquisition values.
All-in rates for German offices are projected at 4.4% in 2023 assuming a stable spread of all-in interest rates over projected bond yields. The 4.4% is a tripling of interest rate from the 1.5% at origination.
The new rents in 2023 are sufficient to cover the new interest payments with a 1.7 ICR. But it is still significantly lower than 4.0 ICR at origination.
Maturity extensions do not solve this ICR problem, as the original floating-fixed swap should expire at loan maturity and needs to be re-set at the new higher level to avoid lenders’ floating rate risks.
ACCEPTABLE RANGE OF REFI ICR’S BETWEEN 1.6 AND 2.4
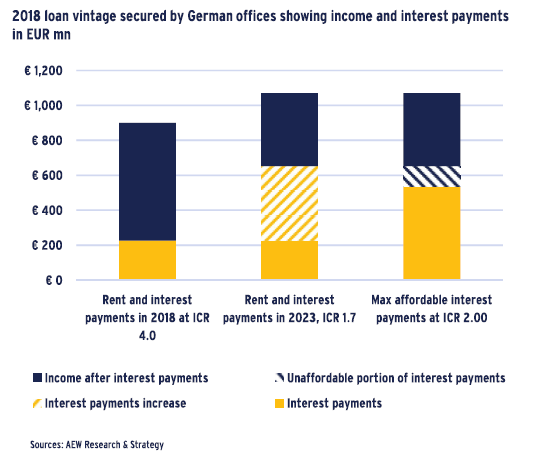
German offices securing the 2018 loan vintage generated EUR 900mn annual rental income in 2018, which grew to EUR 1,070mn by 2023.
However, based on the rate increases, annual fixed interest payments of EUR 226mn nearly triple in 2023 to EUR 652mn at the higher interest rate.
In 2018, only a quarter of income was needed for interest resulting in an ICR of 4.0, which stepped up with rent increases over the loan term.
With the new higher interest rates, the income needed to pay interest would rise to more than 60% - if the original loan amount is refinanced without any ICR restriction. This would push the ICR down to 1.7.
Based on input from lenders and finance experts in the market, a range of ICR acceptable by lenders to refinance an existing loan would range between 1.6 and 2.4 – with 2.0 a convenient mid-point.
To illustrate the impact, we use the 2.0 ICR assumption as it corresponds to 50% of rental income being allocated for interest payment.
This means that at the 2023 rental income of EUR 1,070mn the interest payments exceed the affordable ICR-restricted threshold of EUR 535mn.
There is EUR 118mn in insufficient income to pay interest on the original loan amount and meet the 2.00 ICR limit. To solve this, the debt quantum will need to be reduced.
ICR RESTRICTION TO PUSH DEBT FUNDING GAP UP
To quantify the ICR-related debt funding gap, we continue on our 2018 German office loan vintage illustration and consider the income needed to pay the interest at both origination, loan maturity, and refinance.
In contrast to origination, when ICRs were more an outcome rather than a condition of the loan at refinancing, lenders will consider ICRs more strictly as interest rates have tripled and hedges expire.
As shown above, to meet our assumed 2.0 ICR restriction at the 4.4% new interest rate, the affordable annual interest payments are EUR 535mn.
Capitalising the EUR 535mn in affordable interest payment at 4.4% results in available refi debt of EUR 12.1bn in 2023. This is below the original EUR 14.7bn debt.
In other words, the ICR restriction alone results in a EUR 2.7bn debt funding gap for 2018 German office loans.
To estimate the DFG, across our three countries and four property sectors, we perform a similar analysis as shown here using the uniform assumption of the 2.00 ICR restriction.
COMBINED DFG DRIVEN BY BOTH LTV & ICR LIMITATIONS
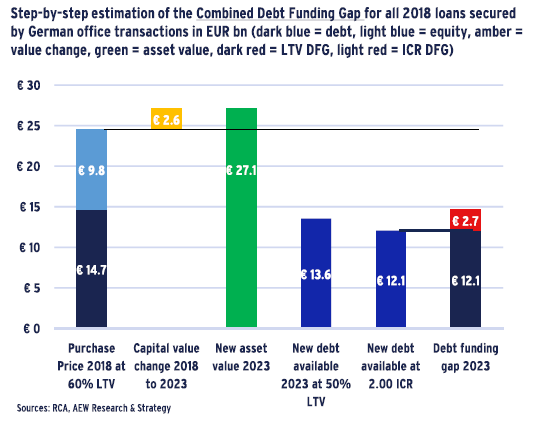
With refinancing restrictions based on both LTV and ICR, we need to consider both effects to estimate our combined DFG. Our 2018 vintage German office loans illustrate this step-by-step:
60% average LTV is assumed for all EUR 24.5bn German office acquisitions (excluding unlevered transactions) closed in 2018 - debt of EUR 14.7bn at 1.5% interest rate.
Our latest capital value data and forecasts for German offices show a +11% increase between 2018 and 2023.
New debt volume is estimated at 50% LTV of this new value or EUR 13.6bn, a LTV-related shortfall of only EUR 1.1bn.
Based on our assumed 2.00 refi ICR, the available income for interest of EUR 375mn and the current interest rate of 4.4% implies that EUR 12.1bn of new debt is available. This implies a EUR 2.7 bn ICR-related gap, requiring additional equity (or junior debt) to avoid loan default.
In our results, we classify DFG per sector and vintage. If the ICR threshold is more restrictive than LTV, it is considered ICR-driven and if the LTV assumption is more restrictive then it is considered LTV-related.
GERMAN SECTORS HAVE THE LARGEST CUMULATIVE DFG
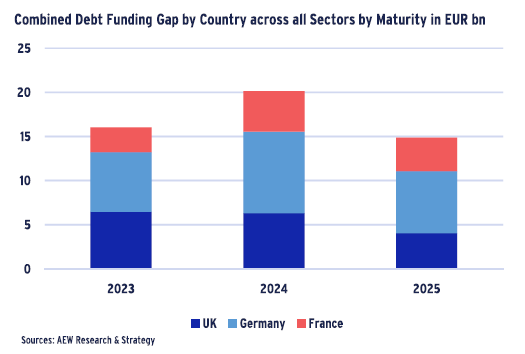
Based on repeating the illustrated five-step approach for all three countries and four property sectors, and assuming an ICR of 2.0, we estimate a EUR 51bn combined DFG for the next three years.
45% (EUR 23bn) of this combined gap is related to Germany, 33% (EUR 17bn) to the UK and 22% (EUR 11bn) to France.
Please not that our DFG estimate does not take into account the size of each country’s investment or lending market.
Timewise, we estimate a DFG of EUR 16bn, 20bn, and 15bn in 2023, 2024 and 2025, respectively.
At our central 2.0 ICR assumption the overall results are predominantly driven by LTV-related DFG. But the big exception is Germany, where lower yielding assets are more vulnerable to interest rate hikes.
To illustrate the effect of a broader range of ICR assumptions, we further present the sensitivity analysis of our combined DFG results by sector.
ICR LIMITS ARE CENTRAL IN HOW DFG WILL MATERIALISE
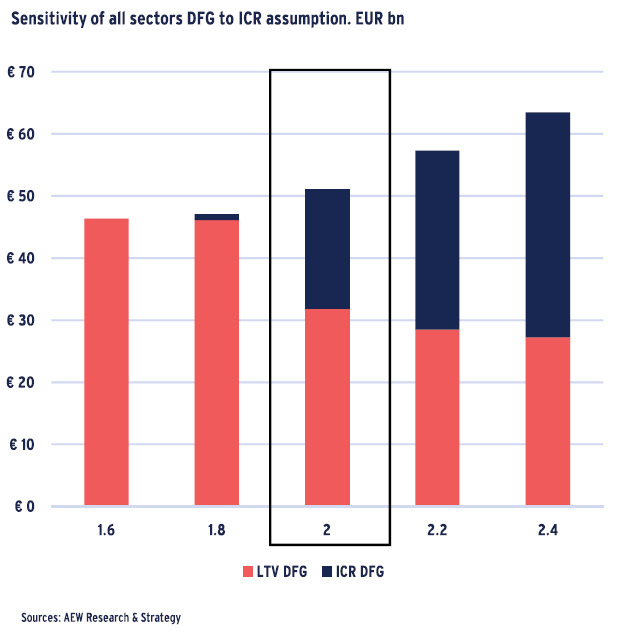
After updating our LTV-related DFG and introducing our ICR-driven DFG, the combined DFG is assessed for its sensitivity to the assumed refi ICR.
At ICR of 1.6 DFG is driven solely by LTV restriction and totals EUR 46bn, while increasing the assumption for acceptable by lenders ICR would make ICR requirement more restrictive.
This also explains a cumulative DFG pattern, which increases with a higher ICR threshold, while the LTV-driven portion of the DFG is decreasing.
At ICR 2.0, our EUR 51bn estimated combined DFG represents more than a doubling of our Sep-22 LTV-only DFG estimate of EUR 24bn.
On the other end of our range, at an assumed ICR of 2.4 the DFG consists of EUR 27bn of LTV-driven and EUR 36bn of ICR-driven DFG.
To bridge this widened funding gap, lenders and borrowers will have to be creative to re-structure the capital stack.
Achieving sustainable LTV and ICR levels will require more than maturity extensions, covenant waivers, cash traps and/or a partial restructuring of existing loans before they can be refinanced.
The legal and organisational infrastructure to deal with these challenges has improved in the aftermath of the GFC. However, the luxury of lower interest rates seems very unlikely to be available this time around.
This effect is further strengthened by the fact that most lenders cannot allow their loans to be unhedged requiring a new hedge (at a higher rate) to be put in place when the loan and hedge mature.
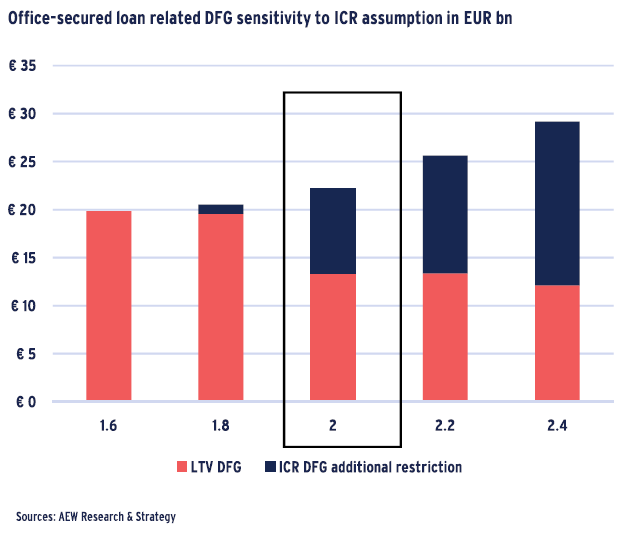
OFFICE-SECURED LOANS POST HIGHEST COMBINED DEBT FUNDING GAP
The sensitivities to ICR assumptions vary among the four different property sectors covered.
To start with office-secured loans, it is noted that at an ICR of 2.00 the sector has both the largest LTV-related DFG of EUR 13bn and the largest ICR-driven DFG of EUR 9bn.
Office loans have the highest combined DFG in euros partly because 2018-20 debt-funded office acquisitions have exceeded other sectors
Our LTV-related DFG is the result of collateral value changes as well as our 50% assumed (and unchanged) refi LTV and is not sensitive to changes in interest rates or refi ICR.
However, our ICR-driven DFG comes down to EUR 1bn if lenders are willing to refinance at a lower ICR of 1.8 and steps up to EUR 17bn if the restriction is set higher at 2.4.
This high sensitivity of office-secured loans sector to the ICR restriction is caused by relatively low yields prevailing in the sector and low all-in interest rates available for the office transactions in 2018-2020.
Low-yielding assets are not able to generate sufficient income to pay interest at the new higher all-in interest rates.
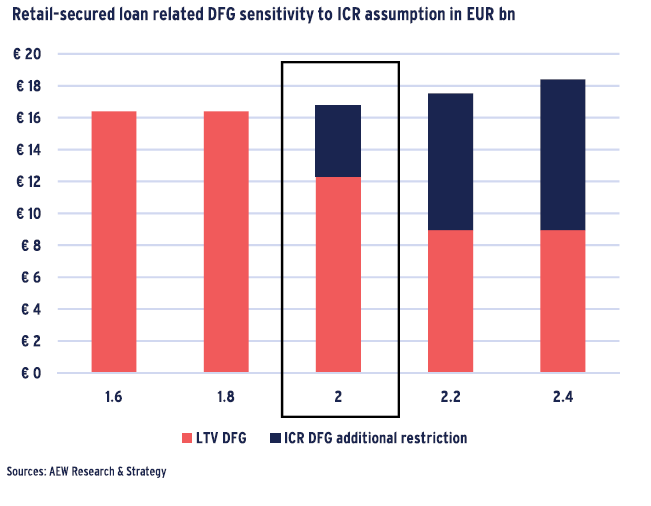
HIGH YIELDING RETAIL LOANS LESS SENSITIVE TO ICR ASSUMPTION
Loans secured by retail assets have the second largest combined debt funding gap of any of our sectors across the three countries covered.
However, for retail-secured loans the LTV-related DFG dominates and is estimated at EUR 12bn while the ICR-driven DFG is estimated at EUR 4bn at ICR of 2.00.
The retail sector combined DFG is driven by LTV at lower ICR thresholds, as the sector already went through significant repricing since 2018, which is still on-going.
On the other hand, these higher income yields for retail assets, allow for a more comfortable servicing of the increasing interest rates.
This makes retail-secured loans much less sensitive to the level of refi ICR than office-secured loans.
Changes in the assumed ICR threshold to 2.2 or 2.4 would result in ICR-related DFG of around EUR 9bn.
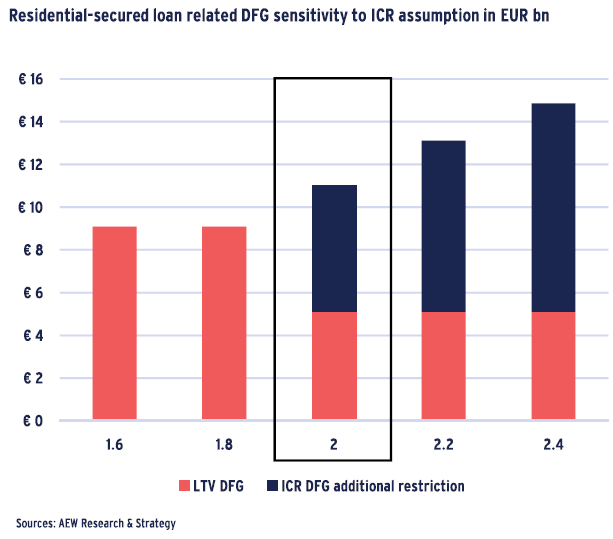
LOWER VOLUMES MAKE RESIDENTIAL LOANS LESS PROBLEMATIC
Compared to offices and retail, residential-secured loans show the lowest combined DFG in our analyses. This is mostly due to modest acquisition volumes in 2018-20 for this sector relative to the others.
The sector’s LTV-related DFG is estimated at EUR 5bn while the ICR- driven DFG is estimated at EUR 6bn at ICR 2.00.
This is the only sector where ICR restriction are stronger at 2.0: which is a result of low yields in the sector at loan origination in 2018-2020, coupled with solid capital value growth to 2022.
However, lower anticipated lender refi LTVs would still restrict the ability of some residential loans to refinance in the next three years.
LTV-related DFG of EUR 9bn is the only source of DFG at the lower end of ICR assumption.
ICR-related DFG ramp up to as high as EUR 10bn if the ICR restriction rises to 2.4.
The analysis for logistics-backed loans was included in our totals, but is not shown separately here.
This material is intended for information purposes only and does not constitute investment advice or a recommendation. The information and opinions contained in the material have been compiled or arrived at based upon information obtained from sources believed to be reliable, but we do not guarantee its accuracy, completeness or fairness. Opinions expressed reflect prevailing market conditions and are subject to change. Neither this material, nor any of its contents, may be used for any purpose without the consent and knowledge of AEW.
Hans Vrensen, CFA®, CRE Head of Research & Strategy, Europe