DEALING WITH DOUBLE TROUBLE
Even though governments have successfully limited the pandemic’s long term economic impact, the conflict in Ukraine poses an unexpected new challenge for markets. The impact of the war and the related economic sanctions has been a slowdown in the post-Covid economic recovery. The Ukrainian situation further amplifies the pre-existing Covid-19 linked supply chain problems with increases in energy and food prices pushing up already high inflation. With higher than expected inflation, central bank policies have focused more on meeting their targets, with the ECB delayed behind the Fed and the Bank of England. Bond markets have started to price in base rate increases and a tapering of QE. This triggers the obvious question for our mid-year 2022 European Outlook: “How can European real estate investors best deal with the double trouble from high inflation and slowing economic growth?”
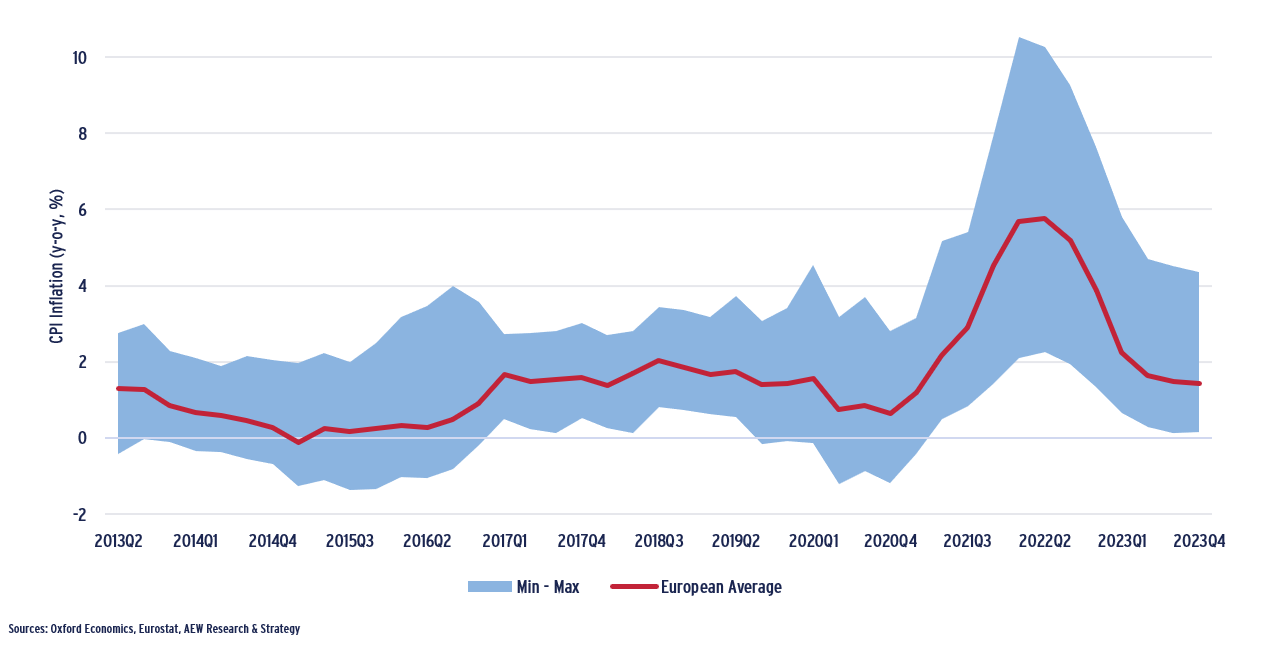
CPI Inflation (% pa) as of Mar-22
EXECUTIVE SUMMARY: DEALING WITH DOUBLE TROUBLE
- Since our year-end outlook, Ukraine-related sanctions and China’s continued lockdowns have slowed the post-Covid GDP rebound and a further step up in already high inflation. Due to this double troubled combination of lower growth and higher inflation, stagflation is our new base case scenario.
- As above-target inflation endures, Eurozone bond investors have priced in rate hikes and tapering for 2023. Our base case assumes only limited rate hikes and government bond yields to remain lower-for-longer, while both our upside and downside scenarios assume more pro-active tightening and bond yield normalisation.
- Post-lockdowns, some normalisation is returning to occupier markets. This is evidenced by a part reversal of the Covid-related record e-commerce share of sales, as consumers return to stores. The most recent mobility and occupancy data also confirm a return to the office, with some significant differences between cities.
- Limited bond yield widening is projected in our current base case. Given our lower-for-longer bond yields assumption and the low historical sensitivity of European property yields to bond yields, our projections for property yields widening are modest over the next five years.
- Our current base case total returns come in at 4.9% pa for all sectors for the next five years mostly based on our lower GDP and rental growth projections. This is 120 bps lower compared to our September base case.
- Prime logistics investments are projected to have the highest returns of any sector at just above 6% pa in the next five years, due to their strong rental growth. Prime shopping centre returns come in second place at just below 6% pa over the next five years due to the high entry yields.
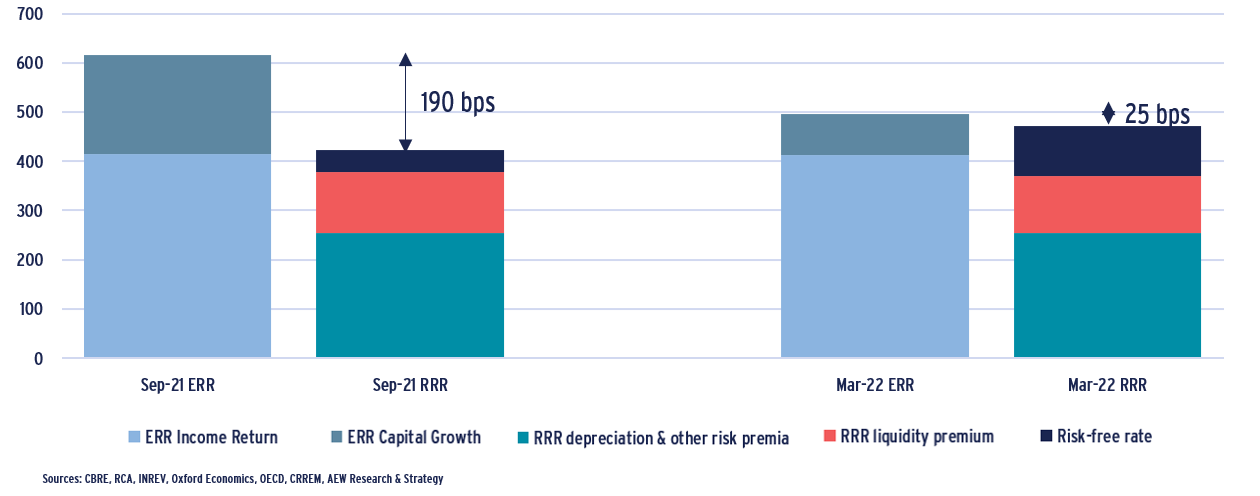
- Our updated risk-adjusted return approach shows an average positive excess spread of the expected rate of return (ERR) over the required rate of return (RRR) of 25 bps for the 168 markets covered. This represents a significant decline of 165 bps in the excess spread versus the previous base case.
- This reversal is due to 120 bps decline in ERR primarily driven by lower capital growth projections. Also, our RRR increased by 45 bps, mostly as a result of recent government bond yield widening.
- By comparing the ERR with the RRR, we classify markets as attractive, neutral or less attractive. Prime logistics has now become our most attractive sector, closely followed by shopping centres. German and UK markets are relatively more attractive.
- Overall, out of the 168 markets, 65 are classified as attractive, 65 as neutral, and 38 as less attractive. In other words, there is plenty to choose from in European markets as they remain in a solid position to deal with the current double trouble.
EXCESS SPREAD OFF EXPECTED RATE OF RETURN (ERR) AND REQUIRED RATE OF RETURN (RRR) - EUROPE ALL PROPERTY TYPE RETURNS, 2022-2026 BPS PA
SECTION 1: ECONOMIC & POLITICAL UPDATE
STAGFLATION IS NEW BASE CASE SCENARIO
- As the largest armed conflict in Europe since World War 2, the situation in Ukraine is having a significant impact on the post-Covid economic recovery.
- The deep economic and financial Western sanctions against Russia could have a lasting impact on growth as it maintains high levels of inflation via energy prices and weakens international trade.
- Government debt will rise further as public spending increases due to the government policies to support purchasing power, the refugee crisis and the required increase in defence spending.
- In turn, consumer and investor sentiment will be hurt by a reduction in real income and wealth levels as a result of a further continuation of the conflict.
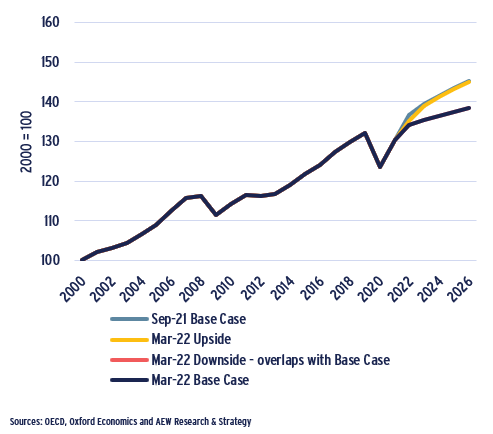
- Therefore, we adopt stagflation as our new base case, reflecting a negative impact of 2022-23 GDP growth of 2.5% versus our previous base case.
- Our stagflation scenario assumes that government bond yields will remain lower-for-longer, as bond markets still expect the ECB to hold rates in 2022.
- Our upside scenario assumes a quicker conflict resolution and return to the previous post-Covid recovery and associated government bond yield normalisation.
- Finally, our downside scenario foresees both lower economic growth (like in stagflation) and bond yield normalisation (like in upside scenario).
European GDP growth index (2000 = 100, based on average across 20 countries)
IMPACT FROM UKRAINE CONFLICT COULD INCREASE
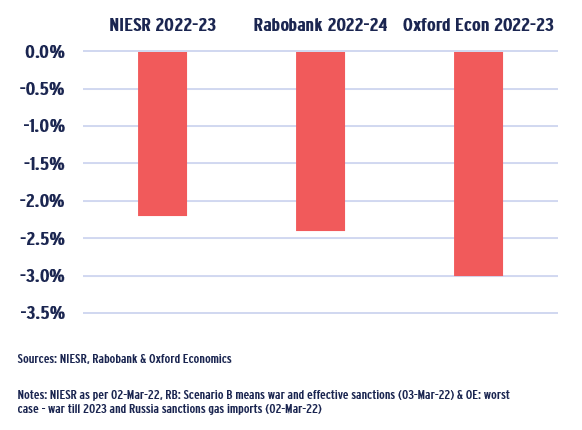
- After the initial shock of the conflict was overcome, various economic forecasters started to assess long term impact on GDP growth.
- There is a high degree of uncertainty on how long the conflict may last and how it might be resolved triggering forecasts to have different assumptions.
- Also, the net impact on GDP growth will also depend on the base line pre-Ukraine recovery prognosis.
- Overall, we see a range of 2-3% cumulative GDP growth impact across the available forecasts, slowing the post-Covid recovery.
- Some forecasters have highlighted the risk of a Eurozone recession, if a more complete ban on Russian oil and gas imports is put in place.
- The knock-on effect on consumer confidence of negative net wage growth might further bring down GDP forecasts going forward.
Cumulative Impact of Ukraine Conflict on Eurozone GDP growth estimates
HIGH SENSITIVITY OF RENTS TO GDP GROWTH
- In our modelling, there are two main transmissions of macro economic drivers onto our real estate market variables.
- GDP growth is the main driver of rental growth
- Government bond yields are the key force behind property yields
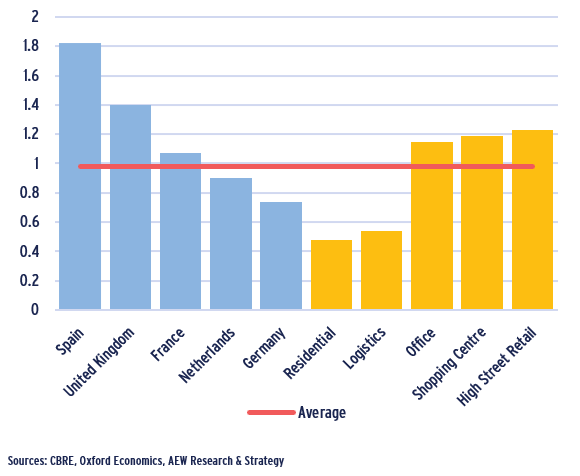
- When we focus on the first transmission, we note that there is a relatively high level of sensitivity of prime rents from changes in GDP growth.
- Our results show that historically a 100 bps change in GDP growth would be associated with a 100 bps change in prime rental growth.
- There are significant differences between sectors, as the sensitivity for retail and offices rents is more than double those for logistics and residential.
- Amongst countries there are also big differentials, with Spain and the UK as more sensitive while Germany and the Netherlands much less than average.
- Data over the last 30 years was used to calculate the regression coefficients of prime rental growth and GDP growth for each sector and country.
Regression coefficients of prime rental on GDP growth (1990-2021, pa growth)
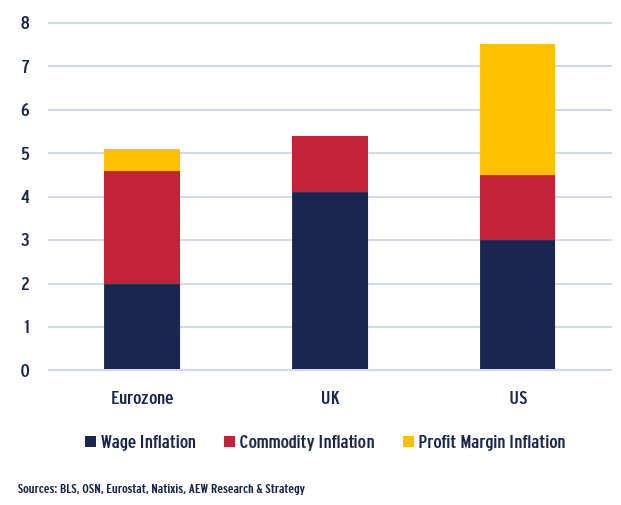
NOT ALL INFLATION IS CREATED EQUAL
- Concerns on inflation’s negative impact consumer spending have stepped up as the Ukraine conflict adds to existing supply chain disruptions from the continued strict lockdowns in China. These will limit the post-Covid European recovery.
- With disturbing short term headline inflation of 7-8% in some recent months, central banks are taking an urgent and closer look at policies.
- However, despite the short term inflation pressure, any previously planned ECB tapering and rate hike policies could be expected to be delayed until 2023 for three main reasons:
- Wage inflation is only a small component of overall inflation
- Rate hikes are ineffective against imported, commodity inflation
- Any hikes will further slow down the post-Covid recovery
- Relative to the UK and US, the ECB has less reason to be concerned about the risk of a traditional wage-price spiral since wages in the Eurozone are set more in collective bargaining rounds and no longer indexed as they were in the 1970s.
- This is a solid justification to assume lower-for-longer bond yields in our base case stagflation scenario.
Breakdown of Inflation – January 2022
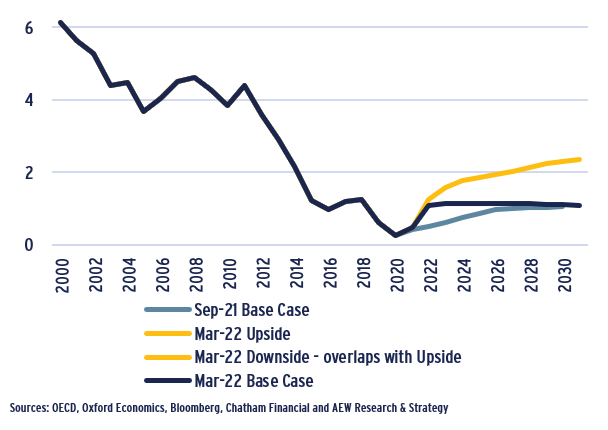
FLATTENING YIELD CURVE PRICED IN BY INVESTORS
- Government bond yields across our 20 country average have increased by 58 bps over the last quarter since year-end 2021.
- As bond investors take into account the fast changing news flow on the Ukraine conflict, sanctions, the economic slowdown and their impact on monetary policies, government yields adapt.
- A flattening government bond yield curve emerged, which implies that the long term outlook on rates remains uncertain. We use this pricing as our lower-for-longer bond yield assumption in our new base case.
- Compared to our previous base case, the year-end 2026 yield is only 20 bps higher.
- However, in both our upside and downside scenarios we use the Oxford Economics yield normalisation forecasts.
10-year European Government Bond Yields (% pa, Average across 20 countries)
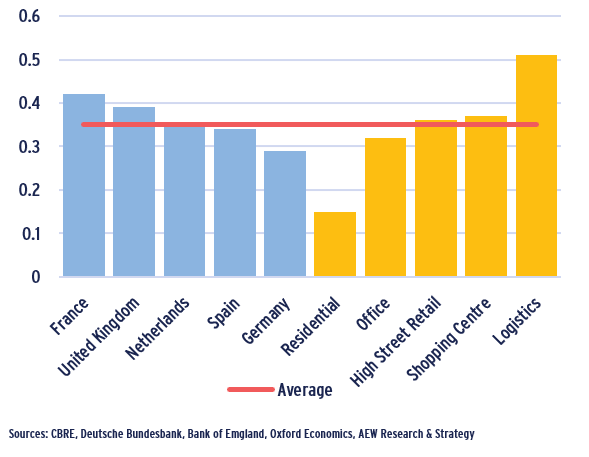
LOW SENSITIVITY OF PROPERTY TO BOND YIELDS
- As mentioned above, there are two main transmissions of macro economic drivers onto our real estate market variables in our modelling.
- GDP growth is the main driver of rental growth
- Government bond yields are the key force behind property yields
- For the second transmission, we note that there is a relatively low level of sensitivity of property yields from changes in government bond yields.
- Our results show that historically a 100 bps change in government bond yields is associated with a 35 bps change in prime property yields.
- Differences between sectors show a higher sensitivity for logistics yields and lower for residential.
- However, the high logistics sensitivity is likely a legacy data issue as the sector has firmly established itself as institutional in the last 5-10 years.
- Amongst countries there are smaller differentials, with France and the UK as more sensitive while Germany and Spain less than average.
- Data over the last 30 years was used to calculate the regression coefficients of property yields and government bond yields for each sector and country.
Regression coefficients of prime property on government bond yields
(1990-2021, pa growth)
SECTION 2: OCCUPER & INVESTOR MARKET OUTLOOK
POST-COVID SHOWS PARTIAL RETURN TO NORMAL
- The main occupier impact of Covid-related lockdowns were focused on:
- Increase in internet sales as share of total retail sales; and
- Working from home (WFH) impacting on office occupancies
- As the lockdowns have now been finally released across Europe, the data shows some normalisation in these trends post-Covid.
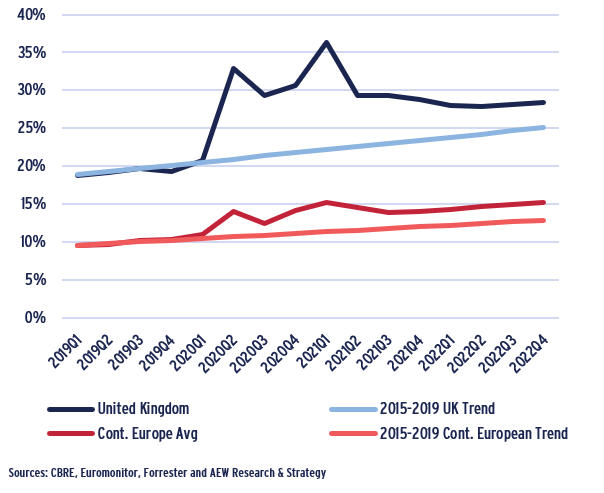
- In the case of online share of retail sales, the UK data shows it came back down from a record high of 36% in 1Q21 to 29% in 4Q21, as consumers returned to more traditional behaviour.
- Online share of retail sales in Continental Europe were lower pre-Covid, but did also come down from their 1H21 peaks in the second half of last year.
- In both cases, it would be reasonable to expect a return to increases in online share of retail sales set pre-Covid after taking into account the near 5% permanent Covid-related lift.
- Late March 2022 UK office occupancy data from Remit Consulting show a consistent return to normal as they rebounded to near 25% from a low of 9% in May 2021. The low level is unexplained, but the trend is positive.
- Hybrid working with around 2 days per week of home-working is the new normal, but the impact on office demand is lower than initially anticipated as occupiers are still adjusting.
UK & Continental European Internet Sales as % of Total Retail Sales
OCCUPIER STATS CONFIRM STRENGTH IN LOGISTICS
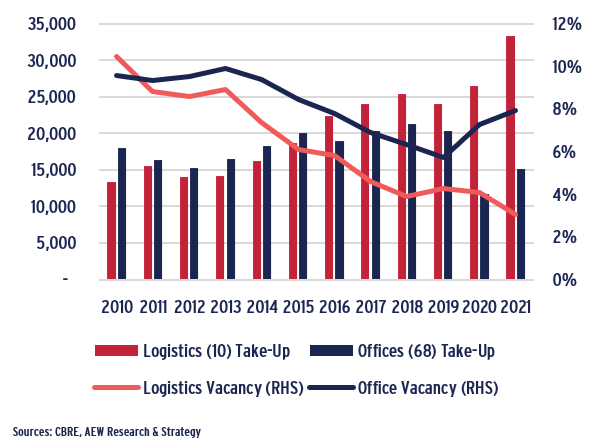
- Strength in occupier markets can be illustrated by annual take-up and vacancy trends. This allows also for a quick comparison of sectors.
- Covid-related lockdowns and increased working from home triggered office take-up in the 2020-21 period to be nearly 30% below its long term 2010-19 annual average.
- At the same time, a strong beneficiary of e-commerce which flourished during lockdown, logistics take-up more than doubled in the last eight years to set a new all-time record in 2021.
- Vacancy rate trends confirm the relative strength of logistics. Vacancy at year-end 2021 was reported at just above 3%.
- Office vacancy jumped back to near 8% from below 6% at year-end 2019, but remained below its 10-year historical pre-Covid average of 8.3%, partly due to a limited pipeline of new development activity.
European Office and Logistics Take-Up ('000 sqm) & Vacancy Rate (%)
RENTAL GROWTH HALVED FOR OFFICES
- Across all sectors, our projected base case average prime rental growth came down by 33% from 1.8% pa to 1.2% pa for the 2022-26 period.
- Prime rental growth across residential and logistics markets showed continued strong momentum at just above and below 2.5% for the next five years.
- This is a step up in rents for both sectors, particularly for logistics.
- Our new base case office, shopping centre and high street retail projected prime rental growth show a significant reduction, while the current upside scenario is broadly in line with the previous base case.
- Prime office rental growth halved from just over 2% pa to just over 1% pa in our new base case and downside scenarios.
- Prime shopping centre and high street retail growth for our base case and downside scenarios are just above zero and just below zero respectively.
- The residential and logistics resilience as well as the negative impacts for retail and office are consistent with the sectoral difference in GDP to rental growth sensitivities discussed on page 4.
- Please note that our projected market rental growth does not reflect any inflation-linked indexation of rents under existing lease contracts due to lack of consistent market data across Europe. Such indexation is assumed to be imbedded in market yields.
European average prime rental growth by property type 2022-26 (% pa)
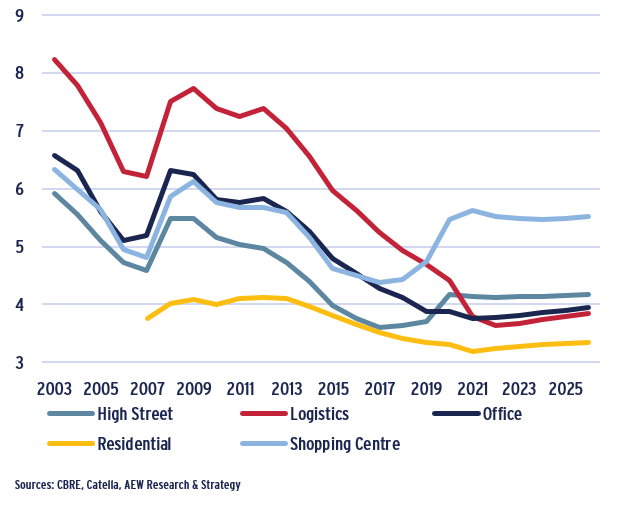
PRIME YIELDS PROJECTED TO BE MOSTLY STABLE
- As noted before, prime yields for different property types were impacted to various degrees by the pandemic in 2021.
- Logistics prime yields tightened further by 60 bps on average in 2021 despite their historical lows, while prime office yields remained stable at 3.9% on average.
- In general, we expect investors to accept tighter yields for sectors with higher rental growth prospects, such as logistics.
- On the other hand, Covid amplified the already on-going yield widening for shopping centres which since 2018 widened by over 120 bps.
- The significant re-pricing in prime retail recorded over the last 3-4 years did not take into account the difference in quality between prime and secondary assets.
- In our latest base case, we expect prime shopping centre yields to compress by 10 bps in the next five years to reflect the resilience of the best retail locations and formats post-Covid.
- The residential, high street retail and office markets are projected to see some minor yield widening over the next five years of around 10 bps. Logistics is projected to have stable yields over the same period.
European average prime yields by property sector based on current base case scenario (%)
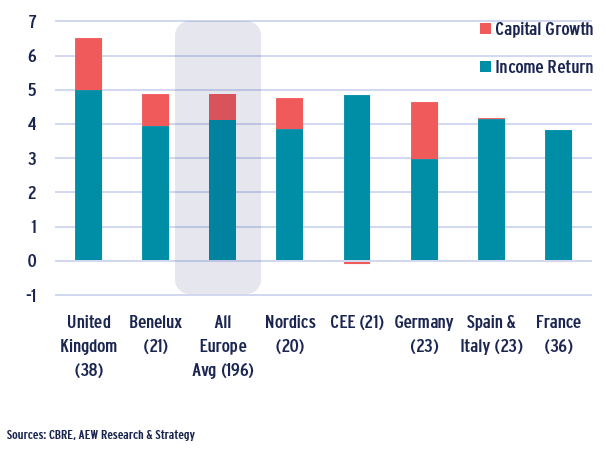
FOCUS SHIFTS TO INCOME AS UK COMES TOP
- In our latest base case scenario, capital growth across all European markets is projected to be less than 80 bps pa and represent just over 15% of the total return of 4.9% pa.
- UK markets show a consistently higher income and total return, as yields did not tighten in as much in the UK as compared to most Continental European markets post-Brexit.
- Our latest base case still provides for German markets to show significant capital growth despite lower income returns compared to other countries.
- CEE markets stand out as the only region where capital growth is negative.
- Our projections for France, Spain and Italy show no capital increase for the next five years.
Income and capital growth returns by country & sub-region 2022-26 based on current base case scenario (% pa)
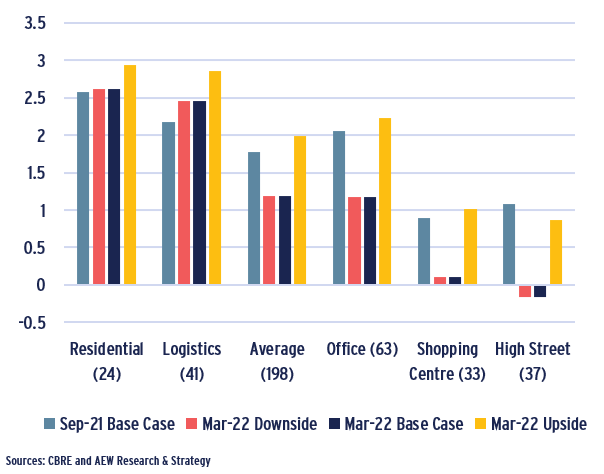
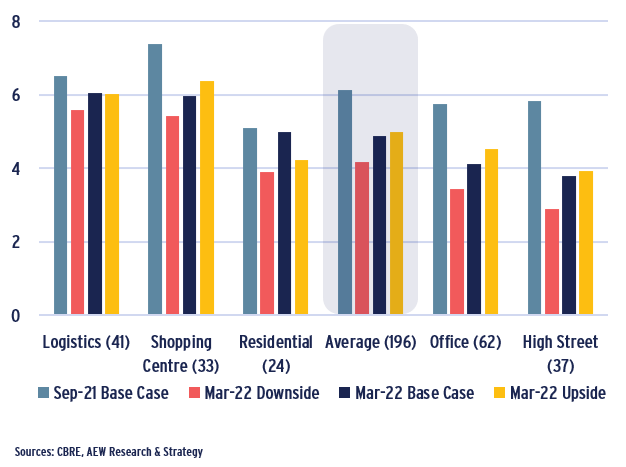
DESPITE RESILIENCE, ALL SECTOR RETURNS DOWN
- Our current base case prime total returns came down by 120 bps pa from 6.1% pa in our previous base case to 4.9% pa for all sectors for the next five years.
- Returns across logistics and shopping centre markets indicate the strongest resilience at just above and below 6% pa for the next five years.
- However, these base case returns are still a step down for both sectors, particularly for shopping centres. Residential returns proved resilient also.
- Our new base case affects prime high street retail and office returns most.
- Prime office returns came down by nearly 165 bps pa from just under 6% pa in our previous base case to just over 4% pa in our new base case.
- Projected prime high street retail returns lost nearly 210 bps pa from just below 6% pa in our Sep-21 base case to well below 4% pa in our current base case.
- These negative return impacts for retail and office are consistent with the bigger changes in GDP compared to changes in bond yields between the current and previous base case scenarios.
- Low sensitivity to GDP growth for residential and logistics rental growth and low sensitivity of bond yields to residential yields also explain their resilience in total returns.
European average prime returns by property type 2022-26 based on different scenarios (% pa)
SECTION 3: RELATIVE VALUE ASSESSMENT
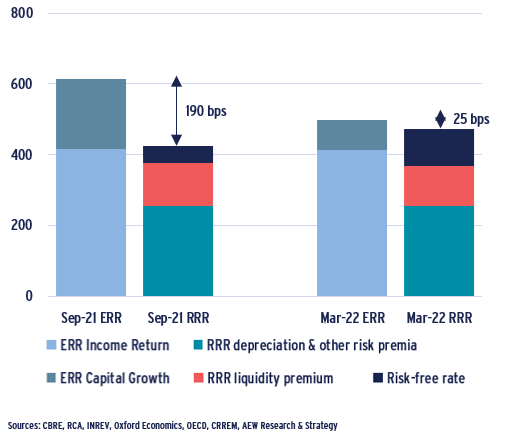
EXCESS SPREAD REDUCED OVER LAST SIX MONTHS
- Our relative value approach shows two major shifts in the relationship between required and expected rates of return in our base case.
- First, expected returns (ERR) have come down by 120 bps pa in anticipation of further policy rates increases combined with weaker economic growth outlook.
- This ERR decrease is primarily expressed by lower capital growth projections, driven by lower rental growth and higher yields.
- Second, our required rate of return (RRR) increased by 45 bps relative to our previous estimate, despite our lower-for-longer bond yields.
- This RRR increase is triggered by inflationary pressures across the markets triggering central banks to raise policy rates, which already resulted in higher bond yields. Both ERR and RRR estimates exclude financial leverage.
- Improved investment activity over the recent quarters decreased liquidity premium by 7 bps, while depreciation and the other risk premia were unchanged over the period.
- As a result, the excess spread between RRR and ERR decreased by 165 bps over the last six months (from 190 bps to 25 bps).
REQUIRED (RRR) VS EXPECTED RATE OF RETURN (ERR) – EUROPE ALL PROPERTY TYPES
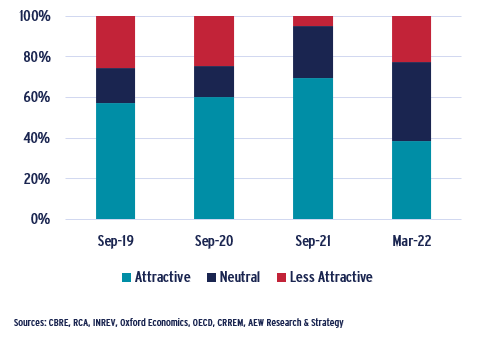
FEWER ATTRACTIVE AND MORE NEUTRAL MARKETS
- Our latest relative value assessment shows that the evolution of our view on attractiveness of the markets since Sep-2019 has decreased.
- In Sep-21, the consensus anticipation of rapid post-covid recovery, coupled with lower for longer yield assumptions resulted in nearly 70% of the markets classified as attractive.
- Our latest Mar-22 outlook shows circa 40% of the markets demonstrating large enough spreads of expected return over the required rate of return to be considered attractive.
- The share of markets with a neutral classification increased from circa 26% to 39%.
- Finally, the share of markets classified as less attractive (with low expected returns relative to the required rate of return) increased from 5% to 23% of covered markets.
% PROPERTY SEGMENT BY ATTRACTIVENESS (CURRENT MAR-22 VS PREVIOUS YEARS’ BASE CASE SCENARIOS)
LOGISTICS & RESIDENTIAL SHOW MORE RESILIENCE
- Despite our less optimistic outlook across all of the sectors, some sectors demonstrate more resilience to the new challenges.
- A majority of logistics markets remain attractive in the new environment, as the sector’s yield shift has a smaller impact on capital values relative to the other markets. Also, solid rental value growth is anticipated even with slower economic recovery assumptions.
- Another resilient sector is residential where nearly half of the covered markets remain attractive. Strong rental value growth compensates for government bond yield widening.
- The dynamics in the retail sector are mixed across subsectors. Prime shopping centres anticipate some yield compression from quite high levels.
- Prime high street retail markets, however, are more sensitive to a rise in government bond yields due to their low levels and this is not compensated by strong rental growth.
- Office market projections show some rental growth and yield widening, which, on a broader level cancel each other out. The majority of the office markets have a neutral outlook.
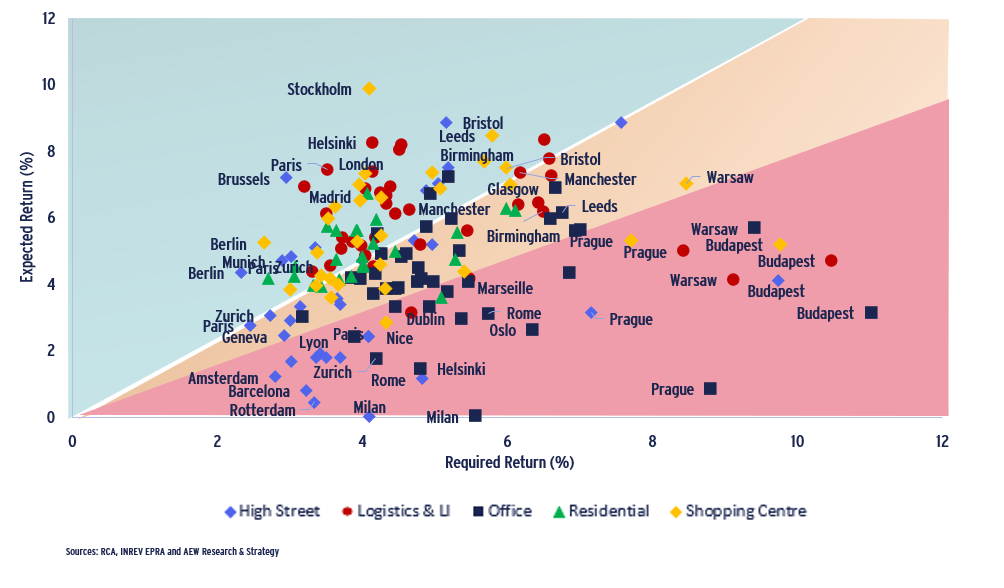
RELATIVE VALUE ANALYSIS (BASE CASE): PLENTY TO CHOOSE FROM
- The below scatter graph can be interpreted as follows: the required rate of return (RRR) is represented on the horizontal axis and the expected rate of return (ERR) for the next five years is represented on the vertical axis.
- Markets in the green area show ERR sufficiently in excess of the RRR as attractive. The red zone markets are classified as less attractive, given their ERR does not meet the RRR.
- The yellow background indicates a range of 20% of the difference between the two, which is deemed an appropriate range where markets are not clearly over- or underpriced. As a result, markets within this middle yellow range are labelled as neutral.
- The scatter chart indicates the strength of the logistics and shopping centres sectors, where most of the markets remain attractive. Residential markets are also in a good place with half of the markets in the green zone.
- Majority of the office markets are in the neutral area, while nearly a third of office markets is in the less attractive category.
- The largest number of high street retail markets are in the less attractive zone. However, over 60% of the high street retail markets are still classified as neutral or attractive. This indicates high variability of local market attractiveness.
- Country-wise the most attractive markets are in Germany and in the United Kingdom. French markets are evenly distributed across the three attractiveness classifications. Least attractive markets are in Hungary, Czech Republic, and Italy.
- Among the top ten most attractive markets in the top-left section of the chart there are five shopping centres, three logistics markets, one residential, and one high street retail market.
BASE CASE 2022-26 – EXPECTED VS REQUIRED RATE OF RETURNS
This material is intended for information purposes only and does not constitute investment advice or a recommendation. The information and opinions contained in the material have been compiled or arrived at based upon information obtained from sources believed to be reliable, but we do not guarantee its accuracy, completeness or fairness. Opinions expressed reflect prevailing market conditions and are subject to change. Neither this material, nor any of its contents, may be used for any purpose without the consent and knowledge of AEW.
