HOW MUCH FURTHER TO GO IN DOWN-CYCLE?
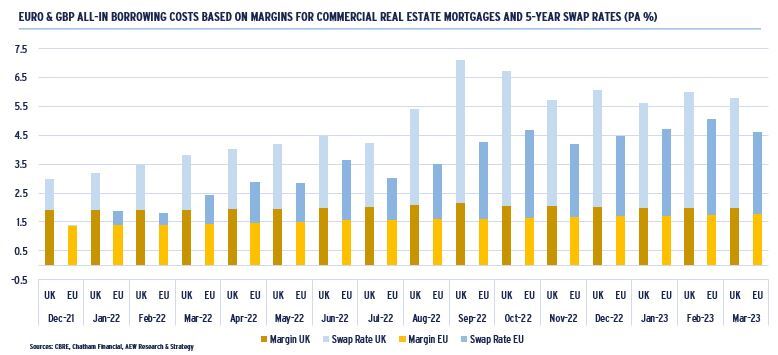
In spring 2023, just when European markets had come to grips with the multiple central bank rate hikes, attention shifted to commercial banks as they raised investor concerns on the back of recent US and Swiss bank failures. In the meantime, the war in Ukraine continues even as its impact on energy prices and overall inflation has started to subside. China’s post-Covid lockdown release has re-started global supply chains helping further ease inflation concerns. As a result, the widely anticipated recession has been pushed back and the macroeconomic outlook has become less gloomy. Bond and stock markets have fully priced in rate hikes and fears of a GFC-like contagion from troubled banks have receded. As a result, all-in borrowing rates for real estate have stabilised a bit as highlighted in the below chart. As yields went up and valuations down in the current cycle, the crucial question for our 2023 mid-year European Outlook is “How much further does the current market re-adjustment have to go?”
EXECUTIVE SUMMARY: LIGHT AT THE END OF THE TUNNEL
- The European macro-economic outlook has improved as a 2023 recession is avoided and financial markets have absorbed recent central bank rate hikes and inflation and bond yields have started to come down. The UK is expected to have one of the lowest economic growth rates amongst the 20 countries covered.
- However, levels of uncertainty remain high and our scenarios help map out the possible impacts. Our new base case scenario assumes that inflation normalises in 2023 with a slow and steady recovery. This means that our downside scenario is deemed less likely since it assumes a recession and lingering high inflation.
- Logistics and residential are the most attractive sectors for rental growth with 3.1% and 2.9% p.a., respectively, benefitting from the improved macro-outlook. Reduced developers’ profitability is expected to limit new supply and contain vacancy rates. Prime European offices are expected to be more resilient than non-prime. This is despite the overall negative sentiment on offices on the back of challenging news on US markets.
- 2022 investment volumes were down 19% vs the record year of 2021 as leveraged investors were priced out by higher costs of debt. Q1 2023 transaction volumes are expected at around €37bn, less than half the Q1 2022 level of €83bn but still well ahead of the lowest post-GFC Q1 in 2009 at €13bn.
- Across all sectors our 2023-27 returns are now at 6.8% p.a. significantly up from 4.0% 6 months ago. Logistics is expected to show the highest returns of any sector at 8.5% p.a., while shopping centres come second at 7.9% p.a. All sectors benefit from improved rental growth and post-2024 yield tightening.
- Our latest total return forecasts factor in some remaining downside in capital values for 2023 – albeit less than the actual 2022 adjustment - with a rebound in capital value post-2024. In Germany and Benelux, the 2022-23 capital value correction is expected to be of a higher magnitude than during the GFC.
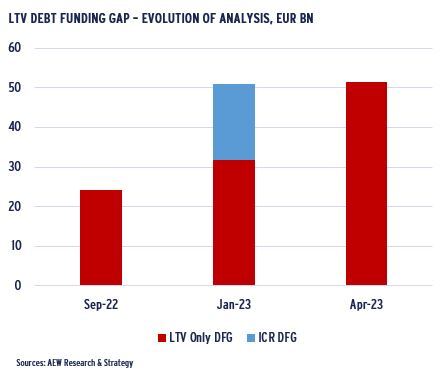
- Borrowing costs have stabilized but re-financing problems remain for maturing loans as values are down and lenders refinance at lower LTVs. The resulting 2023-25 debt funding gap (DFG) remains unchanged at an estimated €51bn, which would represent 22% of the total 2018-20 originations. Our estimated current DFG stands at 60% of the equivalent post-GFC DFG.
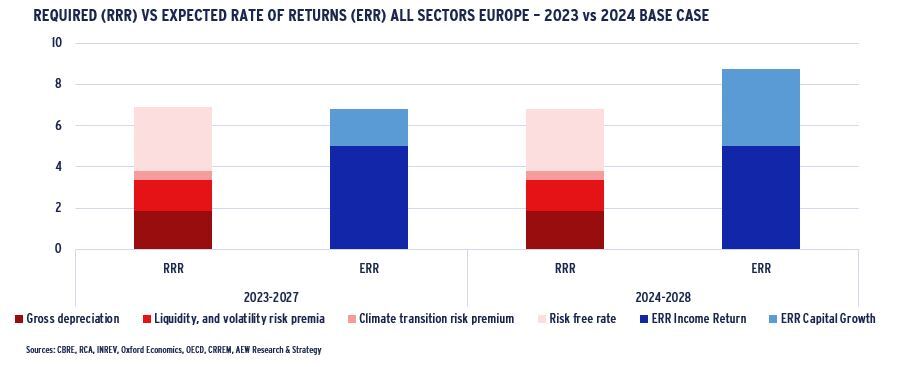
- There has been a significant 268 bps improvement in our relative value assessment (which compares the expected (ERR) and required rates of return (RRR)) from our Nov-22 report. Across the 168 covered markets, there now is only a 13 bps negative excess spread between the 6.8% ERR and 6.9% RRR.
- The double impact from improved rental growth and the projected decline in our average government bond and property yields over the next five years pushed ERR up and in line with the RRR. As property yields start to come down during 2024, ERR and RRR revert to an even more favorable balance as per the below chart.
- As a result of this faster-than-expected re-pricing, over 70% or 122 out of our 168 covered European markets are classified as neutral (77) or attractive (45) as investors meet their RRR. Germany and the UK are our top-ranked markets, while logistics is our most attractive sector.
ECONOMIC BACKDROP – MARKETS PRICE IN AVOIDED RECESSION & RATE HIKES
INFLATION DECLINES BUT SPEED REMAINS UNCERTAIN
- As governments and businesses have found viable alternatives to embargoed Russian gas, the energy crisis has subsided.
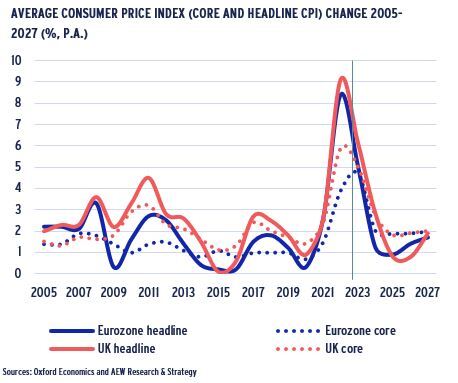
- Headline inflation in the Eurozone fell to 6.9% y/y in March from 8.5% in February as a result of lower energy inflation.
- However, core and food inflation reached new record highs at 5.7% and 15.4% respectively. Core inflation is stickier than expected given that services are more tied to rising wages.
- Based on the latest forecasts from Oxford Economics, average Eurozone inflation was expected to come down to 5% at the end of 2023 and below the 2% target by the end of 2024.
- The precise trajectory of inflation remains uncertain, especially with recent OPEC production cuts and pressures on wages.
- As both central banks and consensus forecasts have struggled to keep up with the 2022 run-away inflation, we maintain our downside scenario with lower growth and higher inflation.
- On the other side, we also have our upside scenario with better growth and lower inflation.
MARKETS NOW PRICING BEYOND RECENT RATE HIKES
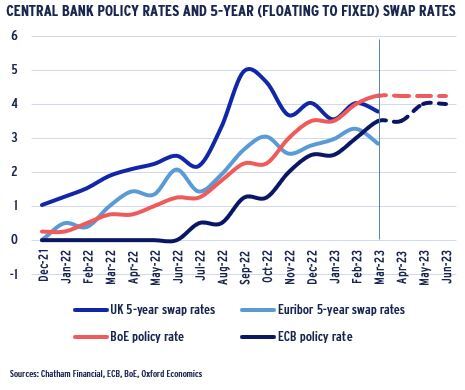
- In order to bring the elevated levels of inflation down central banks raised their policy rates, with the ECB trailing the BoE. The ECB is expected to hike again later in the year.
- Interest rates set in financial markets, like the 5-year swap rates have followed policy rates up. But, there has been divergence along the way, as illustrated in the chart.
- Sterling swap rates jumped as there were serious concerns surrounding the UK mini-budget in Oct-22.
- As the latest UK government reversed many of the announced policies, swap rates came back down.
- More recently, swap rates traded below policy rates implying that the market expects rates to come down over the medium terms as inflation has started to come back down.
- This pricing is in line with recent IMF comments that it expects increases in real interest rates are likely to be temporary as long term factors push inflation down.
- It emphasized that when inflation is brought back under control, central banks are likely to ease monetary policy and bring real interest rates back towards pre-pandemic levels.
EU BANKS SHIELDED FROM CONTAGION
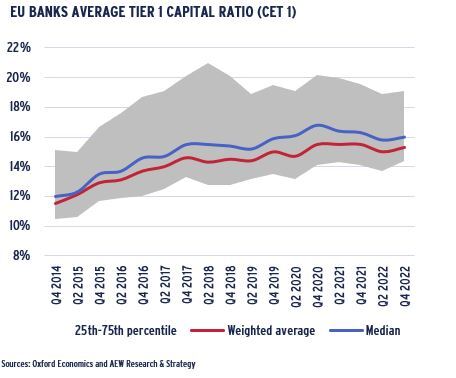
- With increasing rates, banks’ credit and asset quality risks have been increasing, but sizable capital headroom over capital requirements (like the CET 1) provides a solid buffer.
- Average CET1 ratios were at 15.3% in Q4 2022 well above the average guidance for 2022 of around 10.5%.
- Based on this and other indicators, Europe is expected to avoid a systemic banking crisis in the Oxford Economics base case.
- Q4 2022 EBA data showed that European banks recorded rising profitability as well as ample capital and liquidity buffers.
- Real estate and construction exposure is only 5% of European bank’s assets. But, regardless of size, European and US property share the challenge of a rising rates environment.
- It is just that European banks are not facing the same liquidity pressures as the US banks according to J.P. Morgan.
- Its continued ability to provide funding is critical to defining a more positive trajectory both for the European property sector, as well as the asset quality of the European banks.
- Fundamentally, any contagion from either US banks or US CRE onto Europeans peers is not justified, based on a recent J.P. Morgan research note.
ECONOMIC BACKDROP – MARKETS ABSORB CONCERNS ON BANKS
EU BANKS NOT IMMUNE FROM CREDIT RISKS
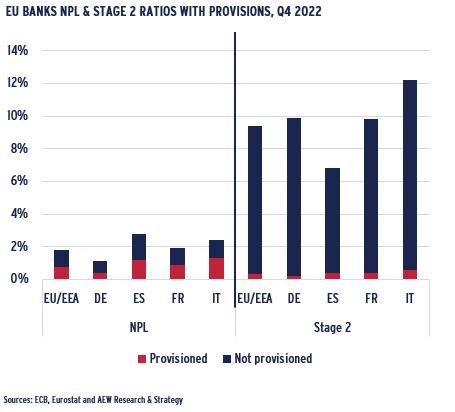
- Despite their solid CET 1 capital ratios, European banks are still expected to step up their provisioning for certain loans.
- The average non-performing loan ratio for EU banks was unchanged in Q4 at 1.8%, the lowest level in eight years of data.
- However, the ratio of underperforming (so-called stage 2) loans deteriorated in 2022 to 9.5% in Q4, marginally lower than in Q3 but higher than at any point during the pandemic.
- The increase was not accompanied by a step-up in provisioning coverage ratios, signaling potentially higher loan losses ahead.
- In a recent note, UBS confirmed that current fundamentals do not warrant a repeat of the 2008 GFC.
- Their covered banks have only 6.5% of commercial property loan exposure. Even if current exposures trigger similar to GFC write-offs at 9-12%, losses will remain in line with reserves.
- We note that compared to past banking crisis trust might be more fragile now in a much more inter-connected complex global system with potential blind spots of risk.
- In short, the impacts from a loss of trust in today’s instantly “better” informed markets where deposits can be moved with a few swipes on your phone app ,might differ from the past.
BOND YIELDS IN LINE WITH HISTORICAL AVERAGES
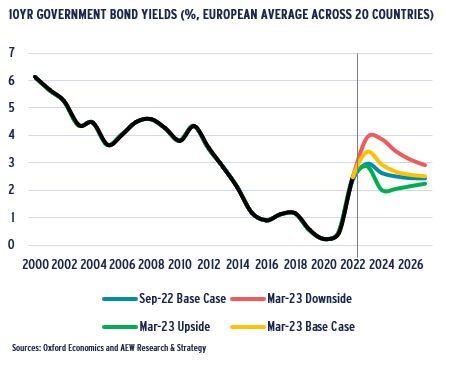
- During the last year government bond yields have moved up by 2.7 percentage points and reached the level of 3.4% on the back of increasing inflation and the central bank rate hikes.
- The increase means a definite reversal from historically low levels of yields that we observed pre- and during the COVID pandemic.
- Pre-pandemic 20-year average from 2000 to 2019 is at 3.4%, which is in line with current levels of yields.
- The yields are expected to reach their peak of 3.5% in Q3-Q4 2023 and gradually decline to 2.5% by 2027.
- The upside and downside scenarios are based on historical volatilities of historical forecasts. Annual average bond yields in these scenarios are forecasted to peak at 4.0% bps and 3.4% respectively.
- All of the figures are based on the 20-country simple average.
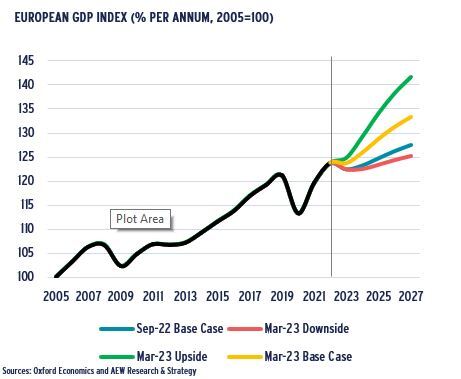
BASE CASE: EUROPEAN-WIDE RECESSION IS AVOIDED
- Our base case scenario from Oxford Economics assumes that a European-wide recession is avoided in 2023, as cumulative growth in 2023 is expected at 0.3% y-o-y.
- This is an improvement from our previous base case scenario from Sep-22 as the flow of negative macroeconomic news subdued.
- The UK is expected to have the lowest economic growth of -0.6% among the 20 countries, and the only major economy with a technical recession in 2023.
- Resolution of the banking crisis in the US and the effectiveness of monetary policy at taming inflation and cooling the economy add to the downside risks, which are reflected in the downside scenario.
- The upside risk include the end of the war in Ukraine, the robustness of the banks, and inflation that drop to the target levels by the end of the year.
MARKET OVERVIEW – LOGISTICS & OFFICES: SENTIMENT TYPICALLY OVERSHOOTS
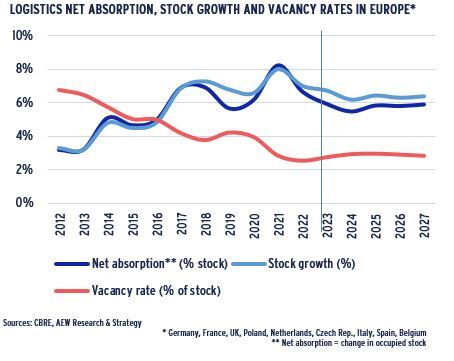
LOGISTICS VACANCY TO PEAK AT 3%
- With global supply chains being restored, fundamental drivers for logistics space demand remain strong.
- Prior to the Covid lockdown new logistics development stepped up. However, since then a more balanced trend for demand and supply has evolved and is projected to continue.
- In fact, there could be a reduction in new future supply driven by increasing interest, labour and construction material costs even if the shortage of land might moderate a bit.
- Across the EU, the target of zero net land take by 2050 has repercussions in the short term.
- With fewer greenfield sites available or new development, existing buildings suitable for conversion or brownfield sites will need to be considered.
- In the medium term, conversion to electric trucks and vans will require further re-development of existing logistics buildings as well as motorways to allow for sufficient charging capacity.
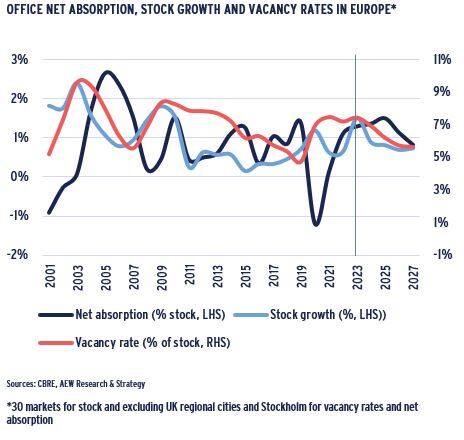
POOR SENTIMENT ON EUROPEAN OFFICES OVERDONE
- Sentiment on offices remains negative primarily driven by extensive media coverage on poorly performing US markets. This is in contrast with the strength in European prime markets.
- In prime office, the negative demand trends of hybrid working, a slower return to the office and a first round of tech job cuts are partly offset by strong recent take-up by serviced and flex office providers, as occupiers prefer to not commit to long term leases.
- Occupiers are increasingly looking at centrally-located, green and efficient office space, which explains the very low vacancy in CBDs. In contrast, peripheral offices suffer from weaker demand.
- As before, we reiterate the positive net impact of limited and lower future office stock growth on the market, as:
- Higher interest rates and construction costs have hurt developers’ profitability.
- Given focus on real estate as a source of banks’ credit issues, less debt will be available for new developments.
- Carbon emissions reduction requirements will force a greater focus on retrofits of existing buildings and less on new buildings.
- Net absorption across the 30 office markets covered will be ahead of new additions to office stock over the next five years.
- Average vacancy rate is now expected to peak at 7.4% in 2023 and come down to below 6% by 2027.
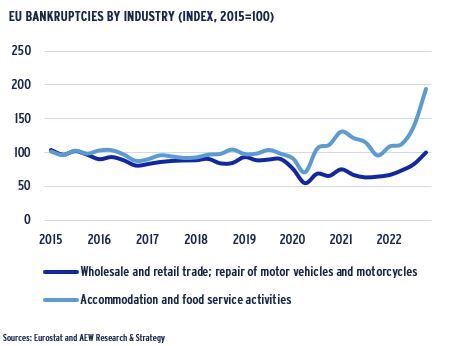
RETAILERS’ BANKRUPTCIES TICK UP
- In the long suffering retail sector, focus has shifted to an increase in tenant failures after the lockdown supports expired.
- Eurostat data shows that EU bankruptcies in the retail sector have increased by 55% in 2022 and more than doubled for the F&B and accommodation sector.
- These increased failures are likely a result of governments ending their Covid support schemes as many businesses now have to pay back their state-backed loans.
- Not great timing, especially as profit margins are under pressure from high inflation reducing turnover as costs have increased.
- The most impacted retailers are in the mass-market fashion industry. This is in sharp contrast with the strong performance of luxury retail groups LVMH and Kering.
- In the UK, 2,300 stores became vacant in 2022 as a result of bankruptcies, a 23% increase compared to the 10-year average.
MARKET OVERVIEW – HIGHEST RENTAL GROWTH FOR LOGISTICS & RESIDENTIAL
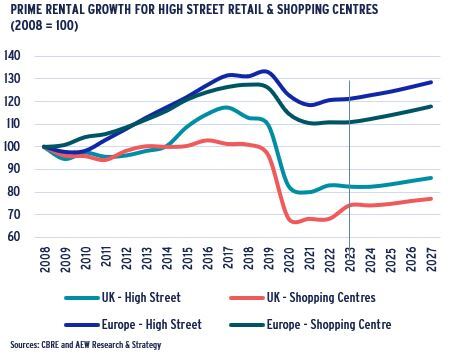
POST-COVID PRIME RETAIL RENTS REVIVE
- UK shopping centre rents are expected to regain some of the losses realized during the pandemic and are expected to grow at 8.6% in 2023 with more modest growth thereafter.
- European shopping centres are expected to show no to little rental growth up to 2025 with a slow revival after that.
- High street retail rents are expected to show no significant growth in the UK and Europe in 2023, with a gradual rebound from 2024.
- In the medium term the nominal levels of rents achieved by the retail sectors will remain well below the historical highs achieved in 2017-2019.
- The avoidance of a recession, low unemployment and improving consumer confidence are the key drivers for our base case rental rebound for the sector.
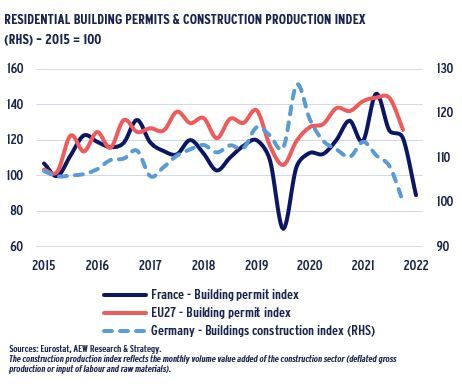
DECLINING PERMITS HIT NEW RESIDENTIAL SUPPLY
- As a result of stricter financing conditions and high construction costs, German residential construction output fell in 2022.
- The supply of new dwellings is not expected to recover in the short-term.
- This will make the housing market in supply constrained cities even tighter than before, and drive market rental growth.
- The number of residential building permits filed in the EU27 – a leading indicator of future developments - also fell in 2022.
- With developers’ profitability challenged by cost increase, these limited permits might not even translate into actual new residential developments delivered.
- The number of residential building permits filed are significantly down in France as illustrated. In Denmark, Ireland, Finland and Sweden the same trend is also noted.
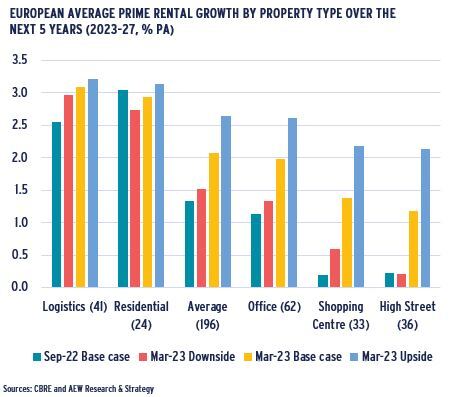
BETTER GDP OUTLOOK PUSHES RENTAL GROWTH UP
- Improved macroeconomic outlook, and stronger GDP growth in particular, translate into more positive outlook for rental growth with all-sector average growth forecast rising from 1.3% to 2.1% p.a. in the next five years.
- Logistics and residential remain the most attractive sectors for rental growth outlook, with an average 3.1% and 2.9% rental growth p.a., respectively.
- For our residential coverage, we have an improved methodology and different market sample which does not allow for a like-for-like comparison with our Sep-22 base case.
- Across all sectors, rental growth is between 1.5% and 2.6% p.a. for our three current scenarios.
- Offices, shopping centres and high street retail are expected to have below average 2023-27 annual rental growth of 2.0%, 1.4%, and 1.2%, respectively.
MARKET OUTLOOK – INVESTMENT ACTIVITY SLOWED BUT BID-ASK SPREADS ARE CLOSING
HIGHER BID-ASK SPREADS LED TO LOWER VOLUMES
- Full year 2022 volumes came in at €282bn ahead of our expectations of €260bn. This was still 19% below the 2021 record volume of €350bn invested in European real estate.
- Q1 2023 transaction volumes are expected at around €37bn, well below the Q1 2022 of €83bn but still well ahead of the lowest post-GFC Q1 in 2009 at €13bn.
- Despite increasing bid-ask spreads, the speed and extent of repricing were still faster than expected, even as some transactions were withdrawn by sellers.
- Many real estate investors have paused to re-assess their allocations as the denominator effect played a role.
- As a result, 2023 volumes are expected to be lower, as pending deal volumes are likely to keep trending down.
- Motivated sales are likely to increase as banks push for sales. Sellers might include funds facing redemptions and/or refinancing challenges.

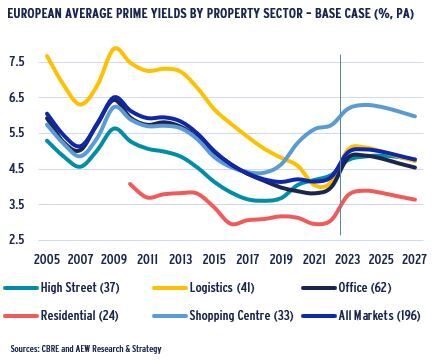
PRIME YIELDS TO PEAK IN 2024 & TIGHTEN AFTER
- Compared to our previous projections, prime yields moved out more than expected in 2022 across all sectors -- as the impact of higher all-in borrowing costs was reflected in pricing.
- As most sellers were able to still tap historical capital value increases, logistics prime yields widened the most of any sector by 90 bps on average in 2022.
- Prime yields for other sectors widened by 50-80 bps on average.
- This means that prime shopping centre yields have widened by over 180 bps since 2018 with high street retail at over 120 bps.
- Given this significant re-pricing in retail over the last five years, we are now able to include some yield tightening in our latest projection of 0-20 bps for retail over the next five years.
- On the back of lower government bond yields, we expect prime yields to move in by 20 to 30 bps for non-retail sectors over the next five years.
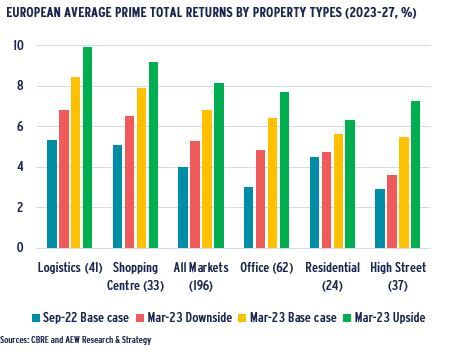
HIGHER RENTS & LOWER YIELDS PUSH RETURNS UP
- Higher projected rental growth combined with forecasted yield tightening pushed returns up across all sectors to 6.8% p.a. for the 2023-27 period – up from 4.0% p.a. in Sep-22.
- Logistics markets are projected to have the highest returns at 8.5% p.a. in the next five years - due to their rapid re-pricing in 2022 and continued solid rental growth projected.
- Prime shopping centres remain in second place with returns of 7.9% p.a. on the back of high current yields and improved rental growth projections.
- Please note that residential returns are impacted by changes in market coverage, methodology and data source.
- As before, our total return calculations are only based on current prime market rents and do not consider income growth from inflation-linked or below-market leases.
- Even our current downside scenario produces returns at 5.3% p.a. on average across sectors, well ahead of the 4.0% in our previous base case scenario.
MARKET OUTLOOK – RE-FINANCINGS TO POSE CHALLENGES
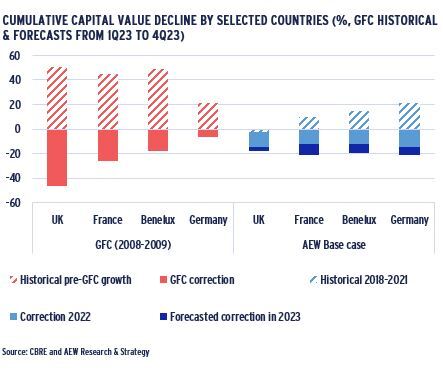
CAPITAL VALUE DECLINES CONSISTENT WITH RUN-UPS
- Our latest total return forecasts are driven by a post-2024 rebound of capital value. This implies that there is still some remaining downside in capital values for 2023.
- Cumulative value declines per country for the current 2022-23 cycle are compared to the GFC actuals in the chart.
- In Germany and Benelux, the 2022-23 capital value correction is expected to be of a higher magnitude than during the GFC.
- This is in contrast to Benelux where cumulative losses are projected to be in line with GFC, and Germany where cumulative losses are forecasted to be more than double GFC levels.
- The remaining forecasted capital value decline for 2023 is less than the actual 2022 adjustment already priced in.
- Similar to GFC, markets that saw the biggest run-up in capital values prior to the re-pricing experienced the biggest declines.
- Capital value declines are the first factor in quantifying the refinancing problem, which will be addressed later.
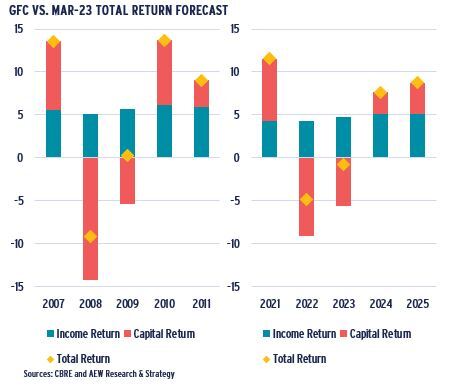
2024 PROJECTED AS THE REBOUND YEAR
- Our next chart further illustrates the comparative timeline of the development of the total returns through GFC and forecasted returns for the full 2022-25.
- Capital value declines, even though lower than during the GFC, are of a similar pattern.
- In both periods we observe a strong correction in a single year followed by a less severe correction in the year following the onset of the repricing.
- After two years of negative returns post-GFC markets saw a strong capital value rebound.
- In our latest projections, we observe a similar rebound pattern in the forecast starting in 2024 and following into 2025.
- Income returns are stable in both the GFC and in 2022-25, however, current returns are somewhat lower than during the GFC period.
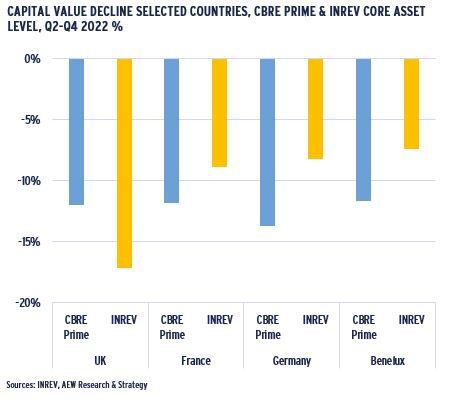
UK DEVALUATION FASTER THAN CONTINENTAL PEERS
- To compare the total levels of repricing that occurred in the last three quarters of 2022 we show both CBRE Prime, as well as INREV core asset level data on capital values.
- There are significant differences between the two datasets: INREV reports actual returns on asset valuations from core funds, whereas CBRE returns are computed with prime rents and yields.
- Looking at the prime returns only, we can see that the degree of repricing is of a similar magnitude of 12% to 14% across countries.
- However, when we compare the INREV valuation figures, we note a large 17% decline in the UK vs. a 7% to 9% decline in the other countries.
- This is likely driven by more conservative valuation practices that are prevalent on the continent.
- Another reason for these valuation discrepancies are the sector weightings for each countries’ constituents.
MARKET OUTLOOK – RE-FINANCINGS TO POSE CHALLENGES
DEBT FUNDING GAP UPDATED FOR LATEST RENT AND VALUE FORECASTS
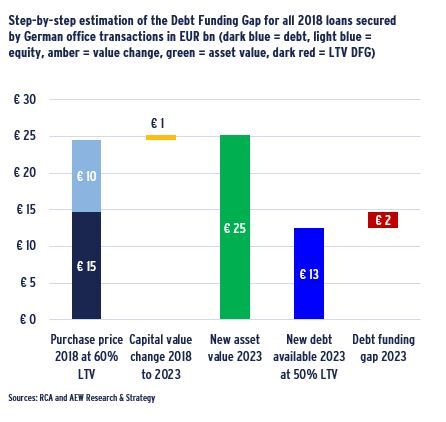
- Based on our latest rental and capital value forecasts, we have updated our debt funding gap (DFG) analyses from Jan-23 and Sep-22. We illustrate our step-by-step DFG methodology for the 2018 vintage German office loans:
- 60% average LTV is assumed for all €24.5bn German office acquisitions (excluding unlevered transactions) closed in 2018 – the debt of €14.7bn at a 1.5% interest rate.
- Our latest capital value data and forecasts for German offices show a +4% increase between 2018 and 2023.
- New debt volume is estimated at 50% LTV of this new value or €13bn, an LTV-related shortfall of only €2bn.
- Based on our assumed 2.00 refi ICR, the available income for the interest of EUR 375mn and the current interest rate of 4.4% implies that €12.1bn of new debt is available. This implies no ICR-related gap but only an LTV-linked gap, requiring additional equity (or junior debt) to avoid loan default.
- In our overall results, we classify the DFG for the four key sectors and three vintages from 2018 to 2020. In our latest results, the ICR threshold is never more restrictive than the LTV, given the increase in our rental forecasts.
UPDATED GAP REMAINS AT €51BN AS ICR RESTRICTIONS FADE
- Based on the above four-step approach for all three countries and four property sectors, we estimate a €51bn combined DFG for the next three years.
- This estimate is unchanged from our aggregate DFG estimate of EUR 51bn from Jan-23, when the ICR 2.0 restriction was still effective for some countries.
- Based on data from DTZ (now C&W) going back to 2010-11, we note that this DFG stands at about 60% of the level estimated post-GFC for the same countries and sectors.
- Compared to our Jan-23 estimate, ICR coverage does not pose any restriction on debt quantum availability. This is due to better-than-expected rent increases in the second half of 2022 as well as our improved rent forecasts for 2023 and beyond.
- Based on these higher rents and stable interest rates, our calculations show no interest payment shortfalls across our coverage.
- To bridge this remaining debt funding gap, lenders and borrowers will have to be creative in re-structuring the complete capital stack.
- As before, we note that our DFG estimate does not take into account the potential bifurcation between prime and non-prime collateral.
ONE IN FIVE LOANS TO FACE A FUNDING GAP
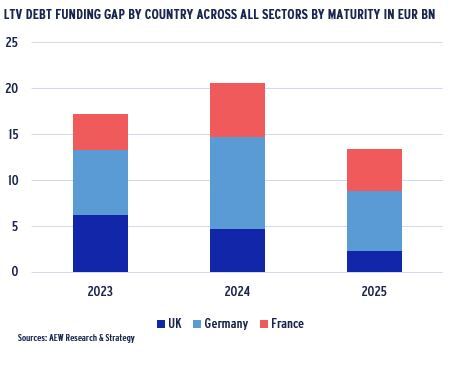
- 46% (€24bn) of this combined gap is related to Germany, 25% (€13bn) to the UK and 29% (€15bn) to France.
- Timewise, we estimate a DFG of EUR 17bn, 21bn, and 14bn in 2023, 2024 and 2025, respectively.
- For lenders and borrowers to get to sustainable LTV and to a lesser extent ICR levels might need more than only maturity extensions, covenant waivers, cash traps and/or a partial restructuring of existing loans before they can be refinanced.
- However, the legal and loan servicing infrastructure to deal with these challenges has remained since the GFC. Lower interest rates are unlikely to offer relief in the short term.
- Restructurings might be swifter as lenders are unlikely to keep their loans unhedged. Once the existing loan and hedge mature, they will need a new hedge at a higher rate than the original one.
- As there was €237bn in 2018-20 loan originations, this means that our DFG accounts for just over 21% of loan volumes. Per country, these vary between 17% for the UK, 22% for Germany and 26% for France.
- Losses across the 2018-20 vintages are estimated at 3.2% of original loan amount, which is in line with historical European CMBS losses.
- Losses are concentrated in retail loans as we assume a threshold of 75% LTV at refi and enforcement-related costs of 25% of the collateral value.
RELATIVE VALUE ANALYSIS: AFTER RE-PRICING OVER 70% OF MARKETS MEET REQUIRED RETURNS
EXPECTED RETURNS SUFFICIENT TO OFFSET RISKS
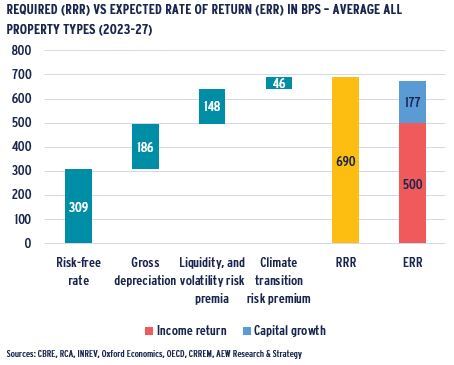
- As a reminder, we note that our risk-adjusted return approach is based on a comparison of the required rate of return (RRR) and the expected rate of return (ERR) over the next five years.
- Our graph shows that the RRR, based on our 168 European markets’ average stands at 690 bps (similar to last November’s 686 bps) while the ERR is 677 bps (up from 408 bps).
- This means that the ERR has a small negative excess spread of 13 bps over the RRR. This is down from the significant negative excess spread of 278 bps over the RRR in our Nov-22 outlook.
- At 309 bps, the risk-free rate remains the largest component of the RRR, but has come down from 317 bps.
- Other risk premia went up by 12 bps compared to Nov-22. table.
- Based on this analysis, investors are mainly compensated for the risks across European real estate markets.
- As before, we classify individual markets as attractive, neutral or less attractive by comparing each market’s ERR and RRR.
QUICKER YIELD WIDENING OFFERS OPPORTUNITIES
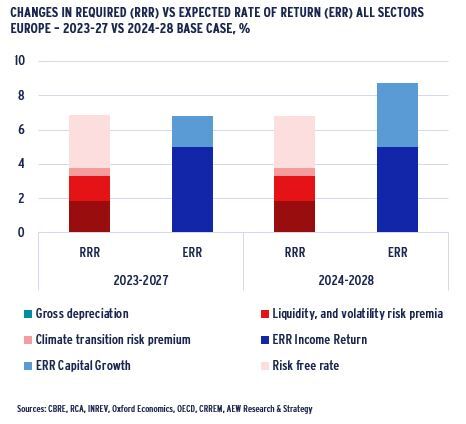
- Much of the anticipated repricing has already occurred in 2022. This is coupled with the improved economic outlook as well as faster compression of yields after the peaks of 2024.
- All of these have pushed our anticipated capital growth up, which meets the need of investors to be compensated for the higher levels of risk-free rates.
- In 2023 the expected rate of return is in equilibrium with the required rate of return, which means that the investors would be compensated sufficiently for the risks taken, on average.
- This situation will improve even further in the next year, by the time all of the re-pricings materialized, giving way for a strong rebound amplified by lower risk-free rates.
- Expected rate of return is projected to increase to 8.7% p.a. thanks to a 2.9 percentage points increase in capital growth, while risk-free rate will decrease by 10 basis points from the peaks of 2023.
- This should re-classify even more markets as attractive for new investments in 2024, as can be expected in a cyclical rebound.
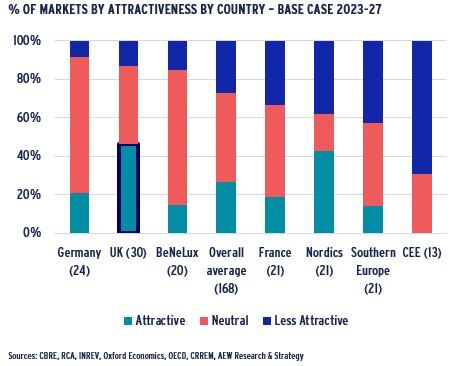
GERMANY PUSHES UK FROM TOP SPOT – SORT OF
- Our latest base case results imply that investors can meet the RRR in over 70% of European markets, up from 30% in Nov-22.
- Out of the 168 covered markets, 122 markets are classified as neutral (77) or attractive (45).
- Germany replaces the UK as our top pick based on that measure, as it has only two less attractive markets.
- At 14, the UK has a larger number of attractive markets than Germany at 5, with the Nordics featuring 9 offset by 8 less active markets.
- France and the Nordics come out with less attractive markets just above the average while Southern Europe and CEE trail the European average most.
- Nearly 30% of markets remain classified as less attractive. But, it should still be possible to source and execute attractive individual deals, especially for managers with local presence.
RELATIVE VALUE ANALYSIS: FULL STEAM AHEAD FOR LOGISTICS, UK & GERMANY
LOGISTICS & RETAIL GET STRONGEST GREEN LIGHTS
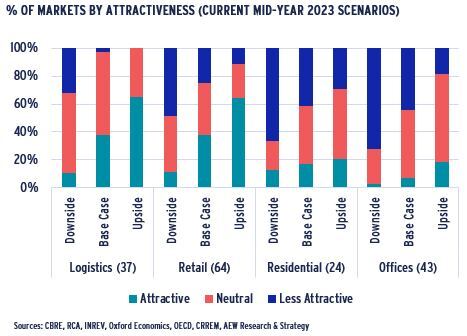
- In our latest base case, there are only one logistics and 16 retail markets in the less attractive classification – clear green lights.
- For residential and office, the results are less positive with 10 and 19 markets still classified as less attractive.
- Despite a general improvement across all sectors, our sector rankings remained unchanged from our year-end outlook.
- Differences between our base case, upside and downside scenarios are consistent with our year-end results.
- As before, our downside scenario assumes higher bond and property yields which are further impacted by slower rental growth with the upside scenario assuming the opposite.
- Yield movements have more substantial impacts on capital values and total returns than changes in GDP and rental growth.
- Offices and residential remain most impacted by both the upside and downside scenarios’ yield widening differentials.
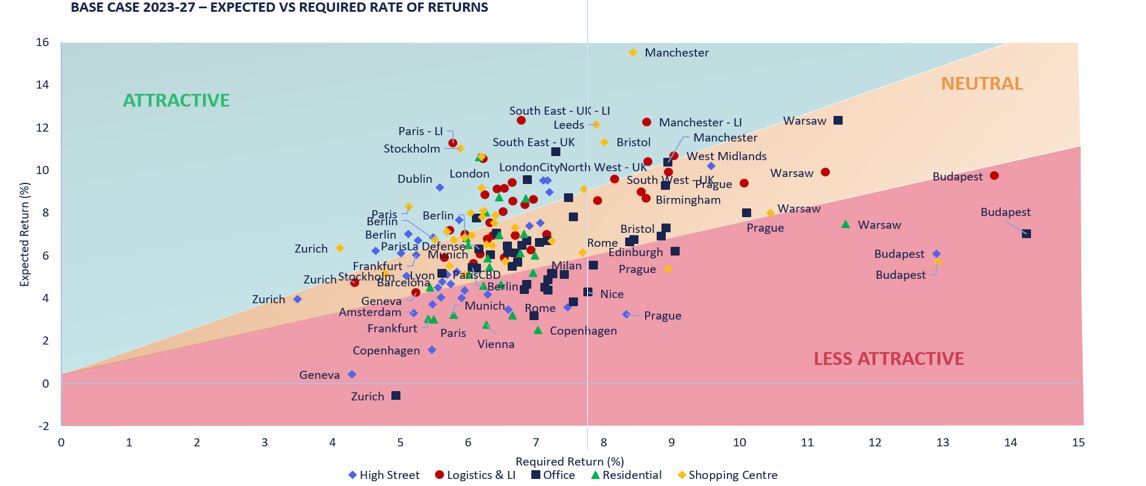
- The scatter graph below can be interpreted as follows: the required rate of return (RRR) is represented on the horizontal axis and the expected rate of return (ERR) for the next five years is represented on the vertical axis.
- Markets in the green area show ERR sufficiently in excess of the RRR as attractive. The red zone markets are classified as less attractive, given their ERR does not meet the RRR.
- The yellow background indicates a range of 20% of the difference between the two, which is deemed an appropriate range where markets are not clearly over- or underpriced. As a result, markets within this middle yellow range are labelled as neutral.
- Similar to last year our universe comprises of 168 markets across five different property sectors. As highlighted above, the scatter chart confirms a more equal distribution of the markets across the segments with most markets in the neutral or attractive zones.
- Logistics and shopping centres are most prevalent in the attractive zone, while offices, high street retail and CEE markets are common in the less attractive category.
- The five most attractive markets are Paris and the Greater London light industrial markets, Stockholm and Dublin shopping centres and London residential as it continue proving its resilience. Among other attractive markets within the top ten, one could highlight some regular patterns, such as the dominance of UK markets as well as the retail and industrial sectors.
Source: CBRE, AEW Research & Strategy
This material is intended for information purposes only and does not constitute investment advice or a recommendation. The information and opinions contained in the material have been compiled or arrived at based upon information obtained from sources believed to be reliable, but we do not guarantee its accuracy, completeness or fairness. Opinions expressed reflect prevailing market conditions and are subject to change. Neither this material, nor any of its contents, may be used for any purpose without the consent and knowledge of AEW. There is no assurance that any prediction, projection or forecast will be realized.