LAND TAKE REGULATIONS TO DRIVE LAND PRICES, DENSITY & BROWNFIELD DEVELOPMENTS UP
- Land is a finite production factor necessary for most economic activities, including manufacturing, housing, transport and agriculture. Land take is defined as the covering of natural land (agricultural land, forests etc) with artificial (non-natural) land uses.
- Natural land is indispensable for the absorption of greenhouse gas emissions. Protecting this natural carbon sink is crucial in achieving net zero emissions. This is why the EU set in 2011 its target to achieve no net land take by 2050.
- France and Germany have started to imbed this target into their national laws. New development will need to use previously developed brownfield land or any new greenfield land take will need to be compensated by rewilding already developed land.
- EU satellite images show that the annual rate of land take has been slowing since the early 2000s. This data shows non-residential real estate at less than 25% of total. However, the EU 27 + UK are still far from its 2050 net zero land take objective.
- The implications of the policy target for real estate are significant, as it is a driver of land take. Logistics in particular represent the majority of new commercial land take, as a result of increasing demand and relative low density of warehouse buildings.
- An increase in the density of new developments should help meet the need for building space for housing, office and other uses while keeping land take down. This increased building density will also justify an increase in land prices.
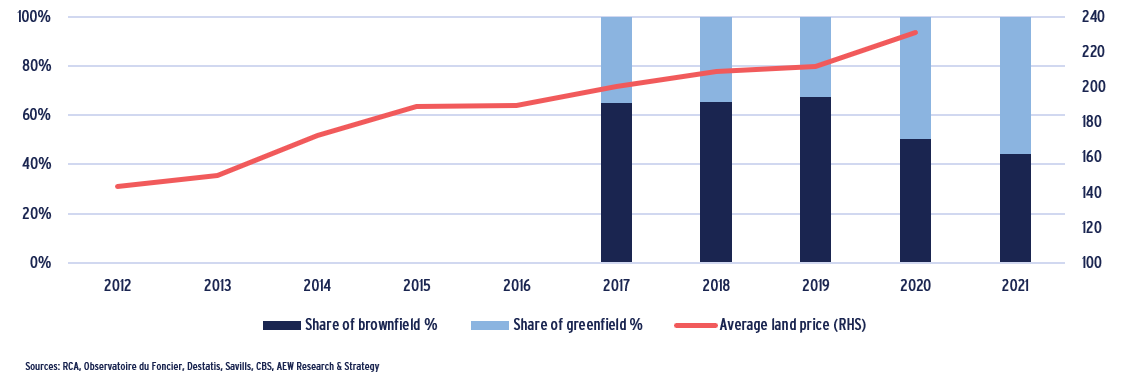
- Shifting from greenfield to brownfield land development provides another solution. Historical data highlights that brownfield sites represented the majority (60%) of land acquisitions developments since 2017, despite a reversal more recently.
- Identifying brownfield plots of land available for redevelopment is becoming an increasingly smart strategy in order to meet future net zero land lake limits leading up to 2050.
- Investors and developers alike should take comfort from the high share of recycled land in specific European cities as illustrated by the data from local satellite images.
- Ultimately, a further increase in brownfield land take and a more intense use of both greenfield and brownfield land to meet the net zero land take target by 2050 will push land prices further up.
All property developments in Europe - share of greenfield & brownfield (%) and land prices (100=2006) (RHS)
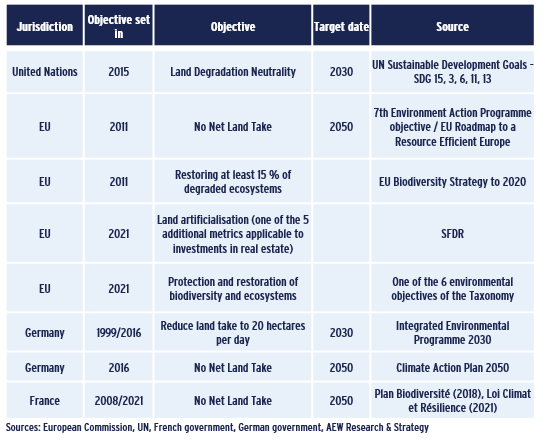
2050 EU OBJECTIVE : NET ZERO LAND TAKE
REGULATORS ARE FOCUSED ON RESTRICTING LAND TAKE
- Land is a finite resource and production factor necessary for most economic activities, including industry, housing, transport and agriculture.
- Land take is defined as the covering of natural land with impermeable material by urban development or other artificial land uses.
- Land take and the sealing of surface land has significant implications for nature biodiversity and ecosystems. Reduced soil hydrology increases the severity of floods and droughts.
- This is not a new problem as more than ten years ago in 2011 the EU set the objective of no net land take by 2050, followed by the United Nations Conference in 2012 identifying land and soil degradation as a global problem.
- This means that by 2050, new development in the EU will need to occur on brownfield land or any new greenfield land take will need to be compensated by rewilding developed land.
- In 2021, the SFDR (Sustainable Finance Disclosure Regulation) identified land artificialisation as a biodiversity indicator.
- French and German governments have already imbedded these issues in national plans and other member states are expected to follow.
Net zero land take target, plan & regulation summary
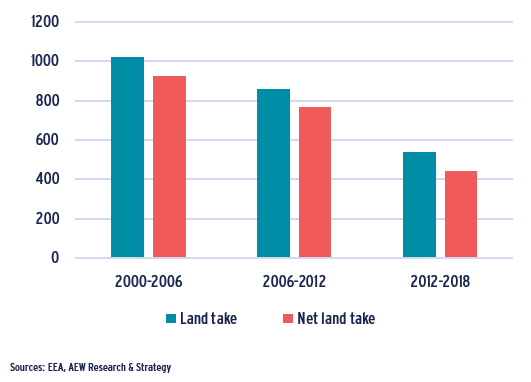
LAND TAKE IS DECREASING BUT FAR FROM 2050 NET ZERO OBJECTIVE
- The amount of new land consumed every year has been decreasing since 2000 in the EU27 + UK, from over 1,000 km²/year between 2000 and 2006 to 540 km²/year between 2012 and 2018.
- Between 2000 and 2018, 78% of artificial land in the EU27 + UK, was taken from agricultural areas (arable lands, pastures, farmlands).
- Between 2000 and 2006, land take was greatest in the coastal regions of the Iberian Peninsula and around the capital regions of Ireland, the Netherlands and Spain. From 2006 to 2012, significant land take emerged in Poland as a result of infrastructure developments. Between 2012 and 2018, land take peaked in the United Kingdom.
- Net land take, the concept behind the EU ’no net land take’ target, takes into account land re-cultivation. Re-cultivation of land increased from 2012 to 2018, led by Luxembourg, the Netherlands, the United Kingdom and Belgium.
- Despite the recent decrease in annual land take, the zero objective appears difficult to achieve.
Net annual land take in Europe in km² - EU27 + UK
LAND TAKE DRIVEN BY REAL ESTATE DEVELOPMENTS
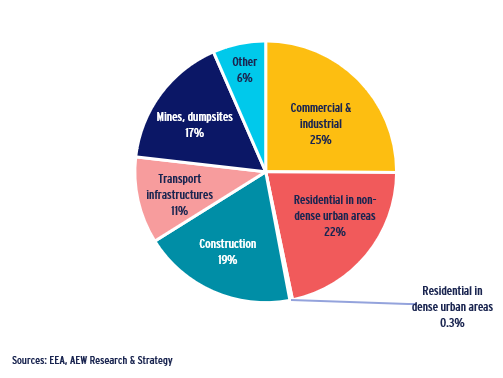
- The main driver of new land consumption across Europe is commercial and manufacturing (25%), which include offices, logistics, retail but also industrial plants.
- The second most important driver is housing, with single-family homes in suburban areas representing 22% of land take between 2000 and 2018.
- By contrast, multi-family residential developments located in dense urban areas only represents 0.3% of total sealed land as these developments are typically “brownfield” in contrast to “greenfield” (developments taking place on former agricultural or natural land).
- The third most important driver is construction, which could not be identified into a particular use by satellite images. Finally transport infrastructures (roads, airports, harbours) represent 11% of land take.
- Due to lack of precise information on commercial real estate land take, we have focused on the available data from RCA, which excludes most residential land take.
Land take drivers (% of land take) – 2000-2018 - EU27 + UK
IMPLICATIONS FOR REAL ESTATE MARKETS
DEVELOPMENT REBOUNDS POST GFC ACROSS SECTORS
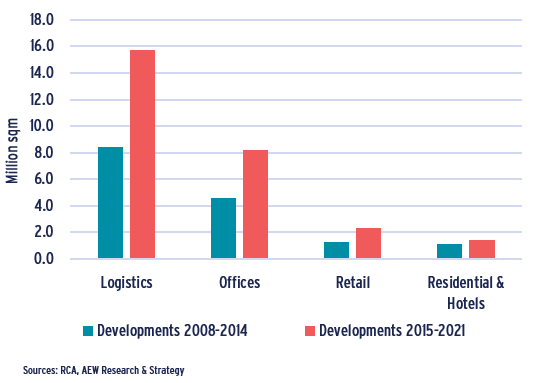
- Despite the overall reduction of land take highlighted before, RCA data shows an increase in commercial real estate development post-GFC from 2015.
- Looking at the main drivers of land take by property type since 2007, logistics comes out as the most represented sector in the development pipeline, followed by offices, retail and finally residential and hotels.
- Again, the RCA residential land take is likely understating the actuals.
- Based on our experience, logistics land will have a higher ratio of non-artificialized green area compared to the other sectors. However, the RCA data does not allow us to correct for this.
- As land take regulations start being implemented, we expect new developments to increasingly take place on brownfield land across all sectors.
- Given the limited land take allowance going forward, new developments are likely to focus on growing demand for residential and logistics.
- Conversion and changes of use has been a trend for some time but should accelerate with more retail being converted to residential, office or urban logistics and offices into residential.
Developments in Europe by sector & construction vintage (million sqm)
DIFFERENCES IN DENSITY EXPLAIN LAND TAKE
- Densification is generally encouraged by regulation to minimise land take.
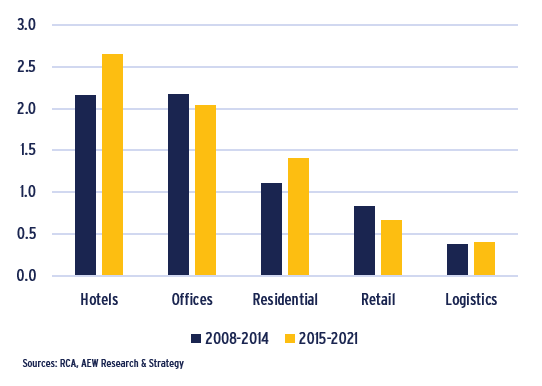
- We have calculated an average building to land area ratio confirming the differences between low density sectors (logistics and out-of-town retail) and higher density sectors (hotels, offices and multi-family residential).
- If we compare the periods 2007-2014 to 2015-2021, these building to land area ratios have increased for hotels and residential but have decreased for offices and retail.
- There is data limitation when it comes to the logistics sector as the building to land ratio does not take into account the increasing height of modern warehouses.
- Clear heights have indeed typically increased from 9m to 12m over the past decades. However, local planning regulation often imposes a height limitation.
- Based on our experience, logistics land will have a higher ratio of non-artificialized green area compared to the other sectors.
Average building to land area ratio, by sector & construction vintage
LAND PRICES ARE RISING
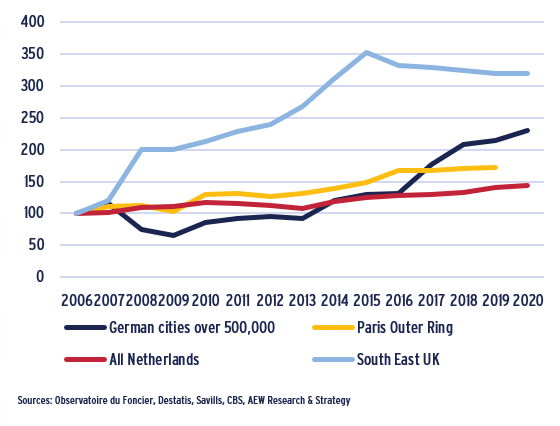
- As a result of increasing competition between land uses and regulation, land prices are rising, particularly in major metropolitan areas where demand for land is the strongest.
- Since 2006, land prices have increased by 43% in the Netherlands and by 73% in the Outer Ring of Paris suburbs.
- Land prices have more than doubled (+130%) in German cities over 500,000 inhabitants since 2006. The increase accelerated from 2016 which coincides with the introduction of an ambitious regulatory target to reduce land take to 20 hectares per day by 2030.
- Since 2006, land prices more than tripled (+220%) in South East UK but have slightly decreased since the UK voted to leave the EU in 2016.
- The expected further increase in land prices as a result of land take regulation will have direct Implications on both prices and rents.
Indexed Land Prices – 2006 = 100
BROWNFIELDS & HIGHER DENSITY SOLUTIONS
BROWNFIELD SHARE TO INCREASE
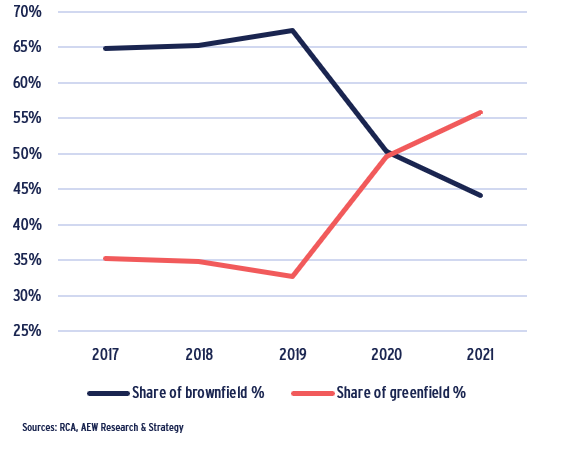
- Historical data shows that brownfield land represented nearly 70% of total development land acquisitions, with greenfield making up the rest.
- The share of brownfield land dropped in the last two years. This can be explained by the fact that logistics represented the majority of developments since 2020 and these are more likely to take place on greenfield land.
- Going forward, it would be reasonable to expect a return to a majority of sites being in the brownfield classification, especially as the awareness of the 2050 no net land intake target increases across the markets.
- In fact, to meet the 2050 no net land intake target a further increase of brownfield site acquisition can be expected to above 70% of total since brownfield sites are not counted as new land take.
- Our analysis splits development acquisitions by the size of land plots across 20 European markets based on the initial use of the land. If the land was previously built upon, the development will be classified as brownfield, the rest as greenfield.
All property developments in Europe – share of greenfield & brownfield (%)
LAND RECYCLING: BROWNFIELD LAND AVAILABLE
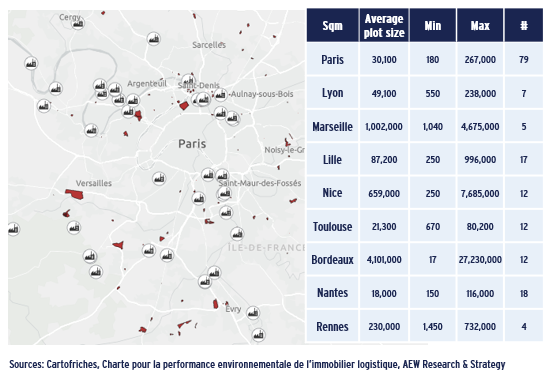
- Identifying brownfield sites has proved challenging for developers. As a result, the French government has created a database of brownfield sites (landfills, former industrial, military or commercial sites, petrol stations, garages etc), which is regularly updated by local authorities.
- The number and average lot size of each brownfield plot available for redevelopment indicated in the table shows the size of the opportunity in the largest Functional Urban Areas. Largest sites are often public-led mixed-use regeneration projects.
- Depollution costs could however represent an additional charge of 20-30% compared to a greenfield development.
- More than a hundred sites have been identified by local authorities for logistics developments in partnership with logistics association Afilog. As part of the agreement, logistics developers have committed to encourage brownfield developments and limit soil sealing.
Brownfield land available for redevelopment – Example of the Greater Paris region & other French cities
LAND RECYCLING: SUCCESSFUL CITIES
- Land recycling refers to the regeneration of vacant or underused land for redevelopment.
- Land densification refers to developments taking place within an existing urban fabric, making maximum use of the infrastructure in place instead of building on previously undeveloped land.
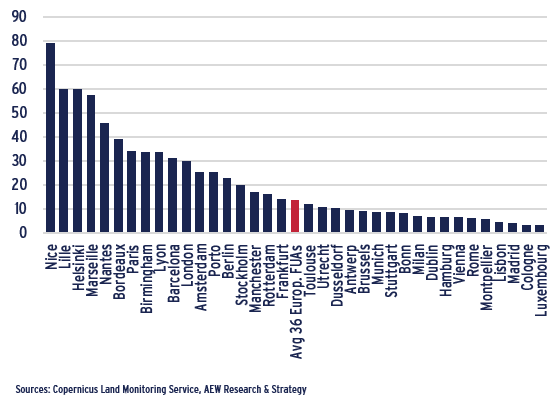
- Satellite images can measure how much land recycling and land densification has been achieved at city level, within the Functional Urban Area (the wider metropolitan area) and not just within the city administrative boundaries.
- Analysis of 36 Functional Urban Areas show that land recycling and densification have been successfully implemented in most French cities (with the exception of Montpellier). Helsinki also scores well as the local authorities have a strong agenda to limit urban sprawl. Land constrained cities due to geography such as Nice, Marseille and Barcelona are also amongst the most land-saving cities.
Brownfield land use and densification as % of total land consumption for the period 2006-2012 by Functional Urban Areas
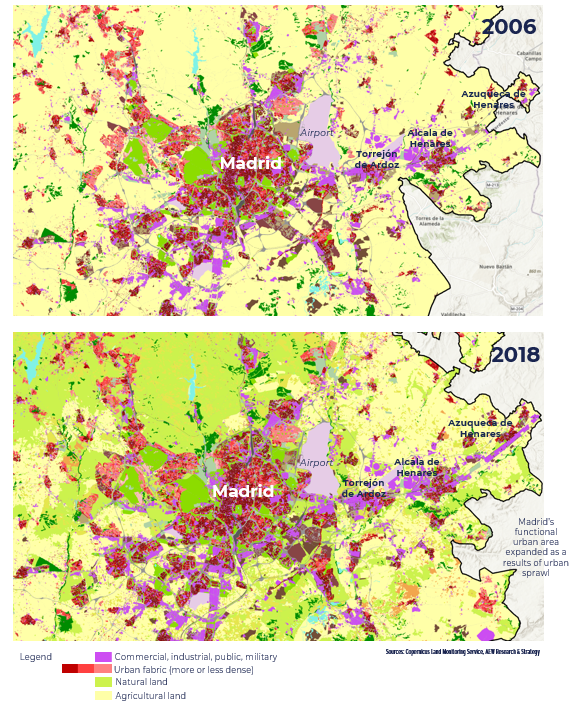
APPENDIX : SATELLITE IMAGES MEASURE LAND ARTIFICIALISATION – EXAMPLE OF MADRID AND ITS PERIPHERY – 2006 & 2018
This material is intended for information purposes only and does not constitute investment advice or a recommendation. The information and opinions contained in the material have been compiled or arrived at based upon information obtained from sources believed to be reliable, but we do not guarantee its accuracy, completeness or fairness. Opinions expressed reflect prevailing market conditions and are subject to change. Neither this material, nor any of its contents, may be used for any purpose without the consent and knowledge of AEW.