The Federal Reserve spent much of 2022 attempting to convince financial markets of its commitment to controlling inflation, pulling forward the pace of expected interest rate increases and raising the expected so-called “terminal rate” for overnight borrowing at each of the last five monetary policy meetings of the Federal Open Market Committee (FOMC). More importantly the FOMC increased the effective Fed Funds rate by more than 400 basis points in less than one year, the fastest and largest increase in the policy rate since the early 1980s.
Figure 1
Change in Effective Fed Funds Rate Over Past 365 Days

Source: Federal Reserve Bank of St. Louis (FRED)

This rapid change in the yield environment and its implications for future growth/recession showed up quickly in the value of publicly traded risk assets with stock, bond and REIT prices typically declining 15%-25% during 2022. For its part, private market valuations for property, as represented by the NCREIF Property Index (NPI) or the Open-Ended Diversified Core Equity (ODCE) fund index, have not yet showed any meaningful valuation change.1
Figure 2
Total Return Index, 2021 Q4 = 100

Source: Factset, NCREIF
The lagged response of private equity valuations relative to public markets is not new and is expected; a similar pattern has been observed in prior valuation adjustment periods. For example, during the financial crisis, publicly traded REIT values began declining during 2007 before reaching a trough during the first quarter of 2009. In contrast, NPI valuations did not begin to decline until the second quarter of 2008 and did not reach a cyclical trough until the first quarter 2010, i.e., a four-quarter lag relative to the public REIT market. If history is an indicator, these private and public values tend to meet somewhere in the middle.
Figure 3
Equity REIT Price Index and NPI Capital Value Index
1977 Q4=100

Source: NCREIF, NAREIT

Figure 4
NPI Capital Appreciation During GFC by Quarter

Source: NCREIF
Hemingway’s observation regarding the path to bankruptcy, gradually and then suddenly, is also an apt description of the path of asset re-pricing in private markets. Often, it takes several quarters or longer for new market clearing prices to be observed and incorporated in valuations of assets already owned. This process can be elongated in times of limited market liquidity. In 2022, despite beginning the year with a torrid pace in aggregate trading in the nation’s property markets (far ahead of the record 2021 pacing), a sharp decline was observed mid-year, largely in response to the disruption of rising interest rates (and credit spreads) on property financing, and the widening of bid-ask spreads that followed.
Figure 5
Cumulative Total Transaction Volume by Year

Source: RCA/MSCI
Table 1
Changing CRE Debt Financing Conditions
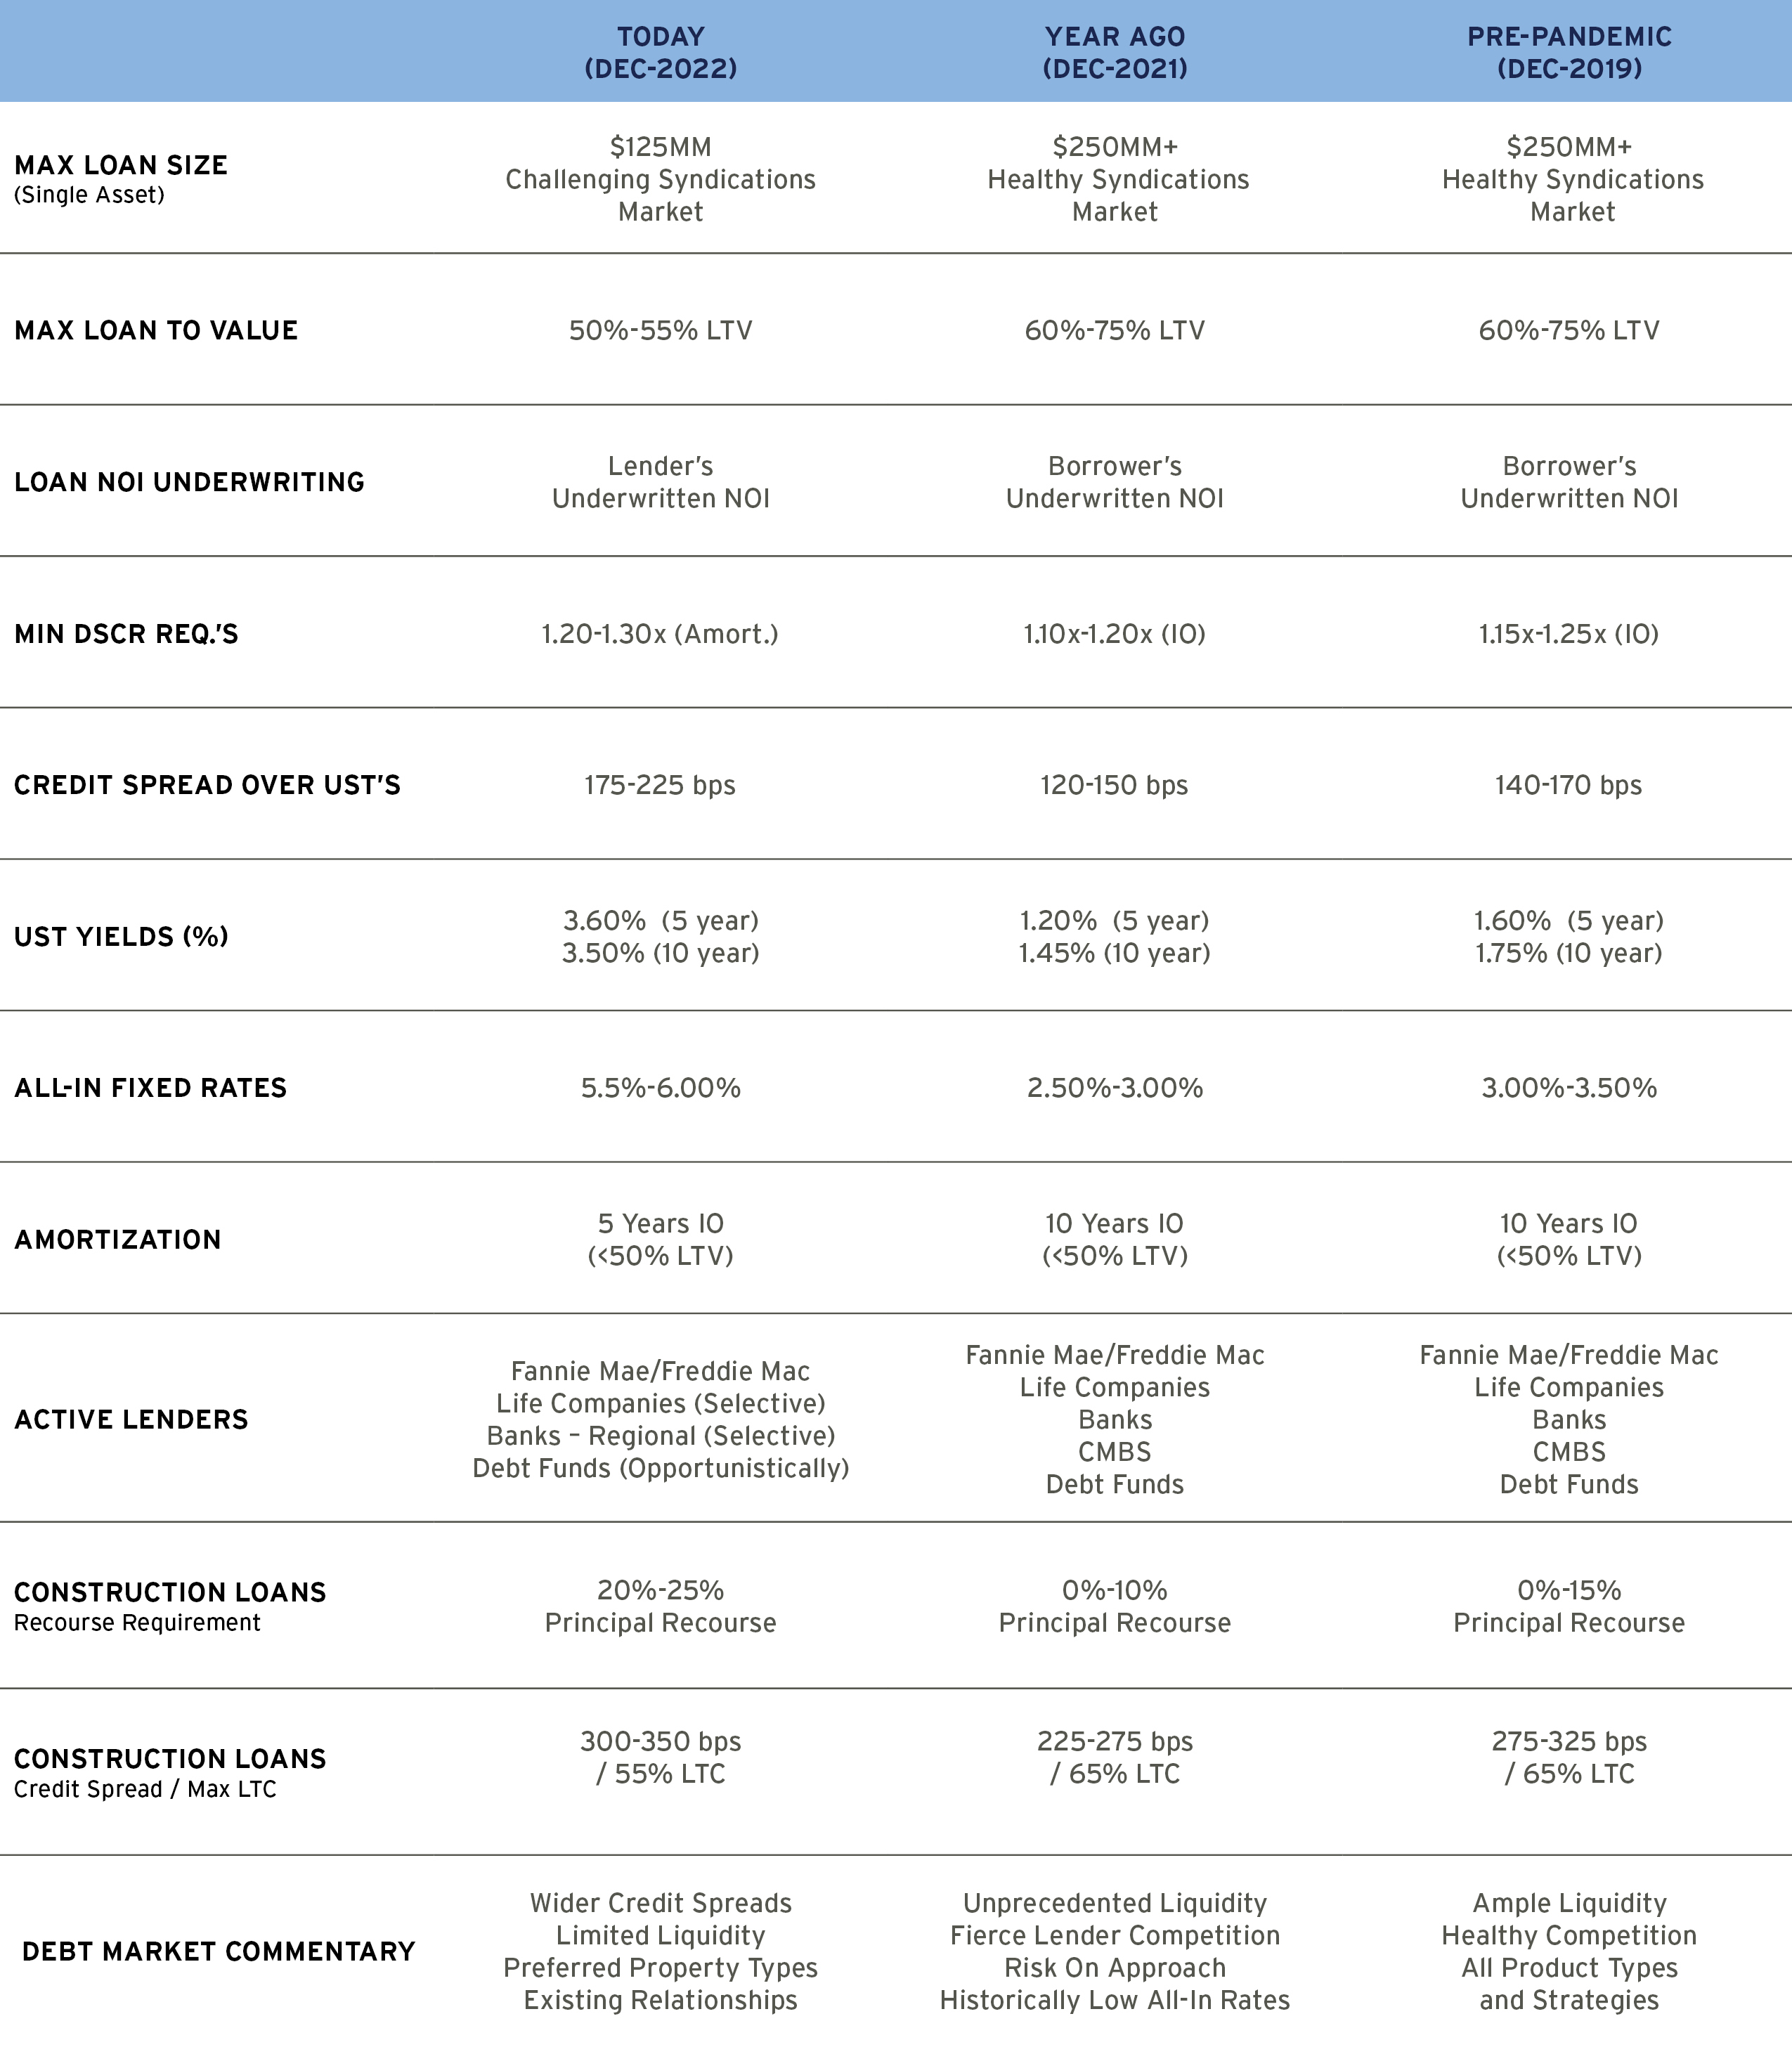
Source: AEW Capital Markets
Table 1 highlights some of the most salient changes that have occurred in property market lending over the past year and relative to conditions prior to COVID. Perhaps the most important change over the past year is the dramatic rise in all-in fixed interest rates facing borrowers today from the extremely low borrowing costs of 2.5% to 3.0% during the depths of the pandemic to rates approaching or exceeding 6% today, albeit at far lower loan volumes to-date. With the typical property in the NCREIF Property Index currently valued at a current yield (cap rate) of less than 4%, current borrowing costs well above the income yield simply do not work for many property investments at current valuations, unless the property fundamentals allow for underwriting significant future growth in property income.
Figure 6
NPI Average Cap Rate and Leveraged Income Yield

Source: NCREIF, American Council of Life Insurers (ACLI)
The disconnect between borrowing costs and valuation yields has, of course, occurred before. During the Global Financial Crisis of 2007-2009, leverage also turned negatively accretive and, in response, property yields were forced higher – despite the Federal Reserve aggressively cutting interest rates and injecting liquidity into the financial system. Today, this same force weighs on property valuations but with significant differences. First, the U.S. economy contracted sharply during 2008, losing roughly nine million jobs during 2008 and 2009 and greatly contracting property demand, while today, the U.S. economy is not yet in broad recession. Second, and perhaps most importantly, the Federal Reserve is aggressively raising interest rates and draining liquidity. Clearly, the yield on currently held properties (and, by extension, on properties that will trade in a re-priced market) will likely continue to rise over the course of 2023 with the usual uncertainties of how much, how fast and the degree to which increasing yields will come from rising property income (NOI) or declining property values. With the U.S. economy seemingly on the verge of a period of significantly slower economic growth or outright recession, the lion’s share of any rise in yields, in the short-term, will likely come largely from property value decline.
2023 (and beyond). Provide Liquidity, Don’t Demand It
Invest/Hold Re-Pricing Properties
Periods of asset re-pricing and credit market dislocation are usually accompanied by elevated demand for liquidity. Today, for example, we see growing queues from core funds with estimated aggregate redemption requests of $20 billion - $25 billion relative to total asset value of approximately $280 billion. Satisfying redemption requests obviously becomes more difficult as the queue of new investment capital shrinks and transaction volume wanes.
Figure 7
Estimated ODCE Funds Investment/Redemption Queue

Source: Various
Following each of the past three periods of asset re-pricing, however, core property has produced outsized total return. Post-trough periods are typically characterized by economic recovery and loosening of credit market conditions, which support improving property market fundamentals and asset valuations, often from a position of higher initial yield. While policy makers today are tightening credit conditions and attempting to slow economic growth, there will come a point where policy pivots towards injecting liquidity and encouraging growth; previously, investing into that pivot has been well rewarded.
Table 2
ODCE Total Return in Periods Following Trough Quarter of Value Decline by Cycle
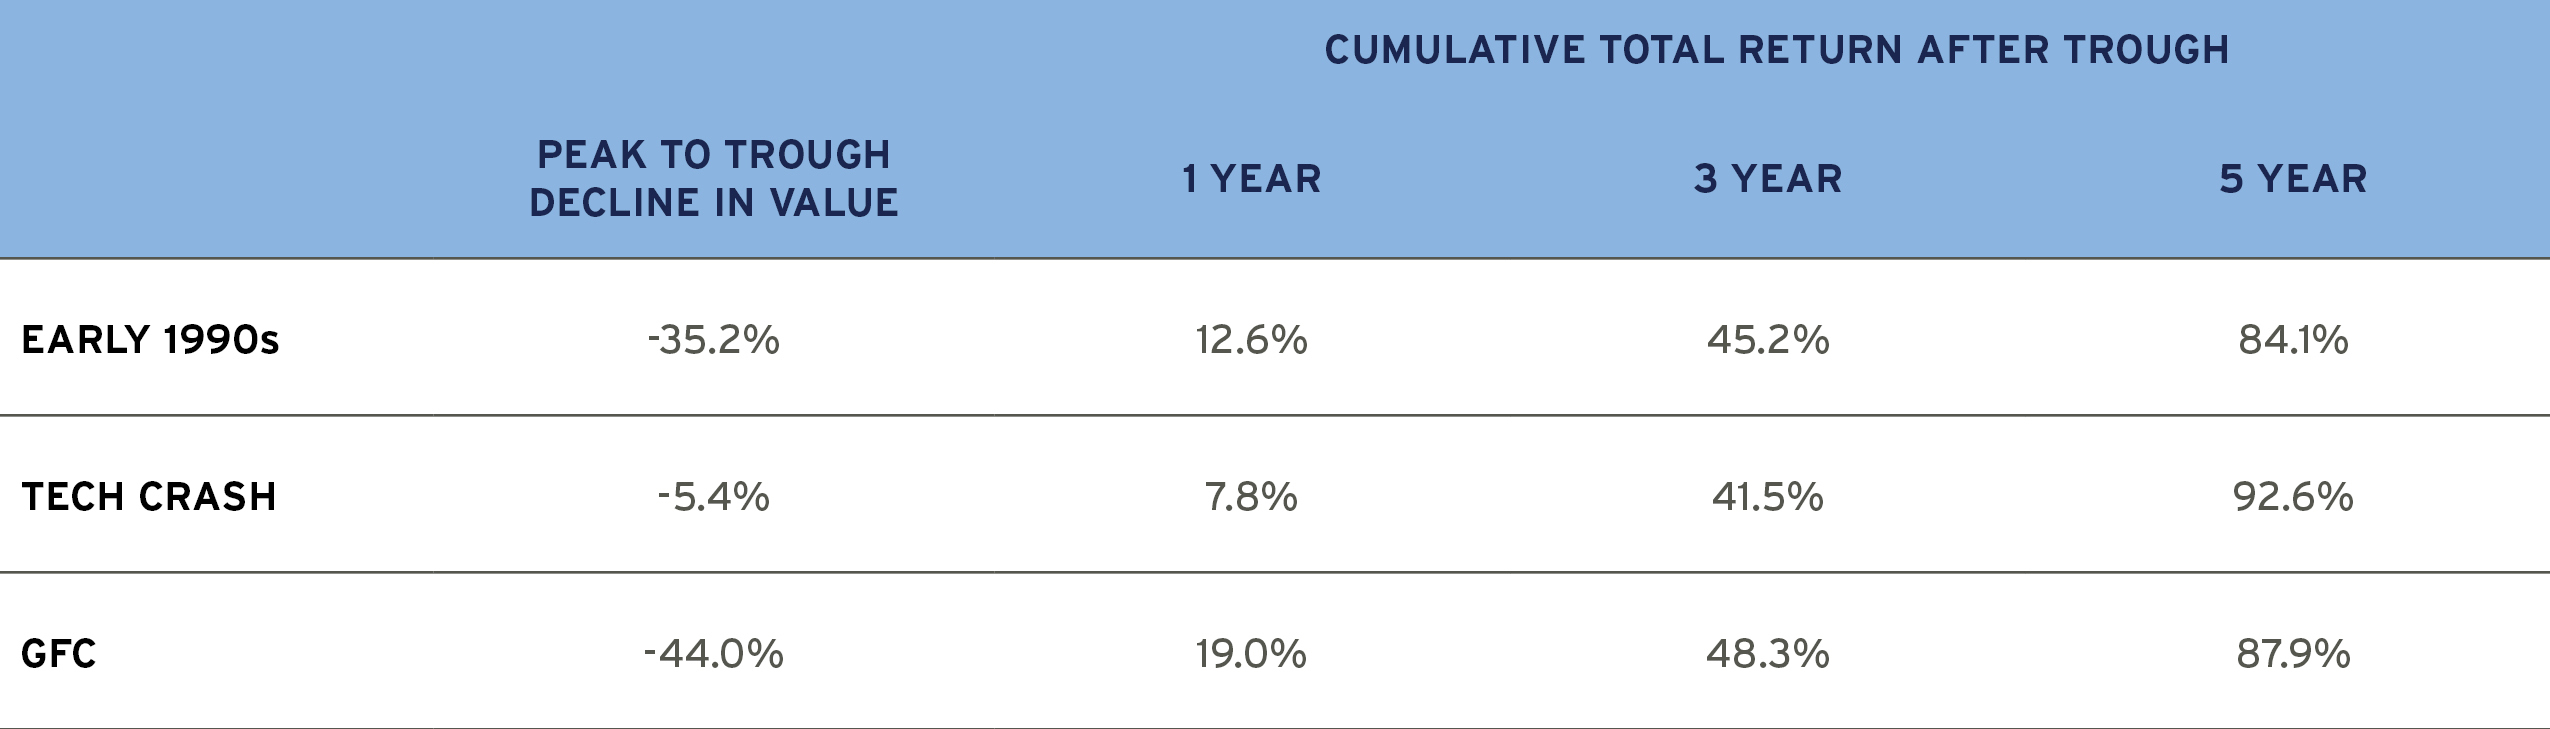
Source: NCREIF
Near-term downward pressure on property values will also put additional stress on the refinancing of maturing property loans over the next several years. Approximately $250 billion of non-bank commercial property loans will mature during each of 2023 and 2024, roughly $100 billion per year more than matured in the years immediately following the financial crisis. While multifamily loans dominated origination during 2018 and 2019, there were also roughly $200 billion of office, retail and hotel loans originated over each year.
Figure 8
Non-Bank Loan Maturities by Originator

Source: Mortgage Bankers Association
Maturing property loans that originated in the years immediately preceding the pandemic will be particularly difficult to refinance if property values have declined over that period. While the average apartment property valuation in the NCREIF universe has increased more than 20% since 2018 and the average industrial property is up more than 75%, several key property sectors have suffered broad valuation declines led by hotels and retail properties. This problem is compounded by tighter lending criteria regarding metrics such as loan to value, debt service coverage and debt yield. Many of these properties will require some combination of so-called rescue capital – fresh equity, senior financing, or mezzanine lending. Recent estimates suggest the near-term capital need for the office property sector alone to be more than $50 billion over the next two years with commensurate capital needs for other property sectors relative to their earlier loan origination volume and valuation changes since origination. 2
Figure 9
2018-2019 Loan Origination by Property Type

Source: Mortgage Bankers Association
Figure 10
Average Change in Capital Value, 2018 Q4 = 100

Source: NCREIF

While the near-term will be largely characterized by challenging capital structures requiring new debt and equity solutions (i.e., rescue capital) with commensurately higher returns, the longer run investment environment following the current period may prove even more beneficial. Many investors, plan sponsors especially, have struggled over the past decade with an investment landscape defined by low or negative nominal and real yields. Following the financial crisis, central banks across the globe collectively distorted the cost of capital in pursuit of varying and likely worthy goals of financial system stabilization, economic growth, pandemic relief, and so on. If today’s coordinated normalization of yields, ostensibly in pursuit of price stability, ultimately gives way to a new normal of positive real sovereign yields, most investors could benefit greatly, in the mid- to longer term. If so, it may once again be possible to deploy capital (debt and equity) at compelling returns with less risk, and potentially without additional layers of leverage. This suggests a new, and likely prolonged period of senior and subordinate lending opportunities with higher yields, the prospect of fresh equity investment into mis-priced equity risk and, eventually, re-priced core property.
1 NPI and ODCE data currently available only through 2022 Q3
2 NPI and ODCE data currently available only through 2022 Q3
For more information, please contact:
AEW Research
+1.617.261.9000
aew.com
This material is intended for information purposes only and does not constitute investment advice or a recommendation. The information and opinions contained in the material have been compiled or arrived at based upon information obtained from sources believed to be reliable, but we do not guarantee its accuracy, completeness or fairness. Opinions expressed reflect prevailing market conditions and are subject to change. Neither this material, nor any of its contents, may be used for any purpose without the consent and knowledge of AEW. There is no assurance that any prediction, projection or forecast will be realized.
