CAN TRANSITION RISK & PHYSICAL RISK IMPACT BE INTEGRATED IN A SINGLE CLIMATE CHANGE RISK PREMIUM?
- The summer of 2023 once again confirmed that climate change is for real with prolonged droughts and fires impacting on high profile urban locations, such as New York and tourist destinations including Hawaii and Rhodes. Policy-makers are not paying enough attention to the dangers of climate change because they are busy with high inflation and political issues, like the war in Ukraine.
- This is our fourth report on climate-related risks in real estate investment. With continuing progress in data and analytical tools, we return to both climate transition risk and physical climate hazards. As with our previous reports, we focus on a quantification of the impact of transition risk and physical climate hazards on European prime real estate returns.
- As a reminder we define climate-related transition risk to include long term anticipated regulatory requirements focused on energy and GHG reductions, which can result in assets becoming stranded if insufficient action is taken. Physical climate-related risks focus on damage and disruption to buildings as a result of storms, flooding, sea level rise, heat and droughts.
- We now re-visit transition-related climate risks now since CRREM - the de facto industry standard for climate-related transition risk – has released its updated version 2.03. Its thoughtful development and adoption by many leading industry groups and firms continues as a validation of the forward-looking approach of its sector and country specific carbon intensity reducing pathways.
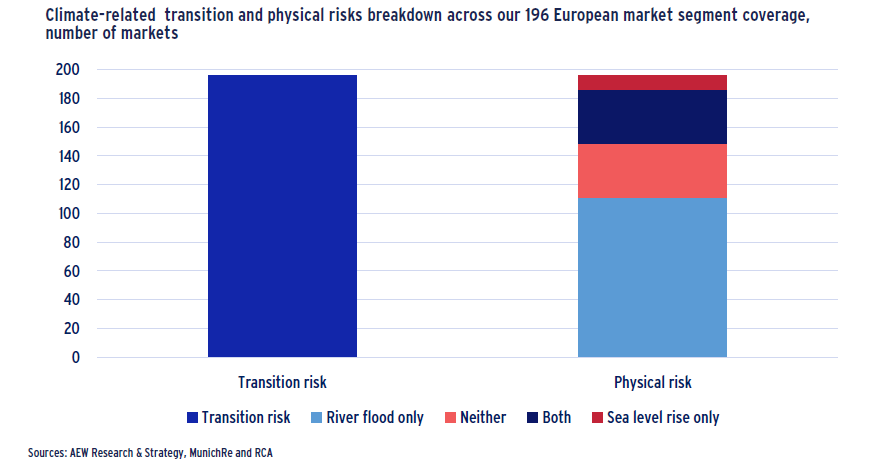
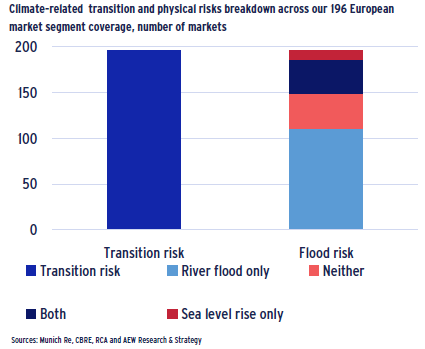
- New data and analytical tools also allow us to test our market-level estimates across our 196 market coverage of sector and city specific market segments. In the case of transition risk, we use new property specific data from CFP Green Buildings. For both river flood risk and sea level rise we test last year’s results with more precise property specific data from IVM’s beta-version of the REACT flood tool.
- Ultimately, our aim is to integrate climate transition risk and physical climate hazards in a single climate risk premium for each of our sector and city specific segments. This integrated climate related risk premium can then later be incorporated in our Relative Value Approach.
CLIMATE RISKS REQUIRE PRIME INVESTORS TO RESERVE 19 BPS OF EXTRA ANNUAL CAPEX ACROSS EUROPE
- In this report, we provide our new integrated and updated estimate of the impact of climate-related transition and physical risks.
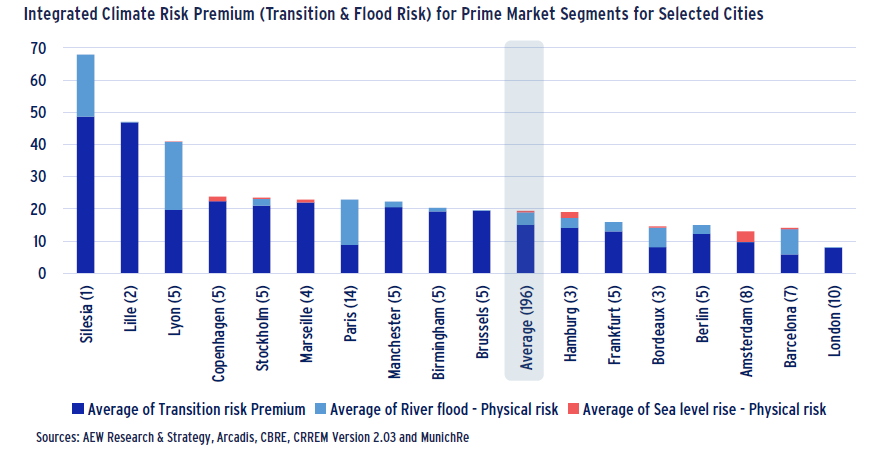
- Our combined climate risk premium stands at 19.4 bps pa on average across our full 196 European market segment coverage, consisting of three elements: (1) transition risk at 15.0 bps, (2) river flood risk at 3.9 bps, and (3) sea level rise at 0.4 bps.
- Lille and Lyon have the highest climate risk premium, estimated at 47 bps and 41 bps respectively. London has the lowest climate risk premium among major European investment markets estimated at 8 bps. German cities in our sample also show below average climate risk premium.
- Our updated 5-step methodology for incorporating the new version 2.03 CRREM pathways results in a lower than previously estimated transition risk premium of €8 per sqm/pa, down from 9 EUR per sqm/pa in July 2022.
- This means that our average transition risk is estimated at 15 bps pa of prime capital value across our universe of 196 markets. This is down from 48 bps in our 2021 estimate due to changes in the pathway and using the prime capital value as denominator. In our updated methodology, cyclical changes in prime capital values also affect the basis points impact of climate risks.
- The differences between sectors remained similar to our 2021 results with prime high street (6 bps) and shopping centres (8 bps) showing the lowest impact. Prime offices (9 bps) and residential (11 bps) come next, while prime logistics (42 bps) showed the highest impact in bps pa. As before, the lower relative capital values for logistics reduce the denominator and lift the bps impact.
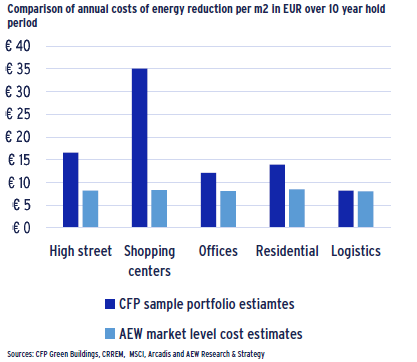
- These updated market-level results were tested against CFP Green Buildings’ estimates of the required retrofit costs for a portfolio of 500+ buildings. CFP showed similar differences between property types but higher levels. In fact, the overall portfolio average was more than double our in-house market level estimates at €17 per sqm/pa, with shopping centres being a significant outlier.
- These discrepancies between CFP test results and our own market estimates are explained by the non-prime properties within the sample portfolio, as well as in the discrete nature of property improvements required, such roof or window replacements or insulation.
- Our river flood risk premiums for the 133 markets affected were updated from 3 bps to 6 bps pa, while sea level rise risk increased from 1.3 to 1.8 bps for the 47 affected segments, based on the latest retrofit costs and consistent capital values. However, when we include unaffected markets, the average river flood risk comes down to 3.9 bps, and sea level rise to 0.4 bps across the 196 markets.
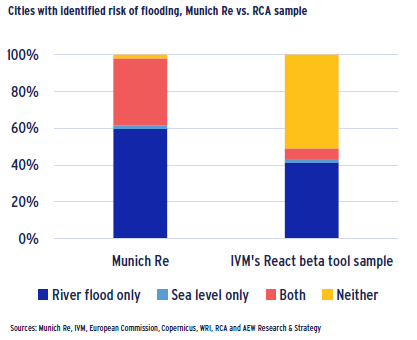
- For our physical risk premium, we also tested last Munich Re’s 2022 results with the new React beta tool from IVM which estimates the damage impact of river flood and sea level rise risks for individual buildings. This test showed that React identified no flood risks at all for buildings in 26 out of 51 cities covered based a sample portfolio of 3300+ properties.
- For cities with river flood risks, the React test data shows an average building impact of 10 bps, more than triple the average of 3 bps for flooded areas only identified by Munich Re last year. Based on the current version, React does not yet offer a suitable alternative, which means that we return to our Munich Re-based estimates from last year and add them to our updated transition risk premium.
- Since the cost of the energy reducing retrofits and flood damage are unlikely to be different between prime and non-prime assets, we estimate that there is an average of 46 bps of required energy-efficiency capex for non-prime European assets. This compares to the 19 bps average for all prime markets as mentioned before.
SECTION 1: UPDATING CLIMATE TRANSITION RISK FOR CRREM 2.03
CRREM VERSION 2.03 SETS NEW & IMPROVED STANDARD
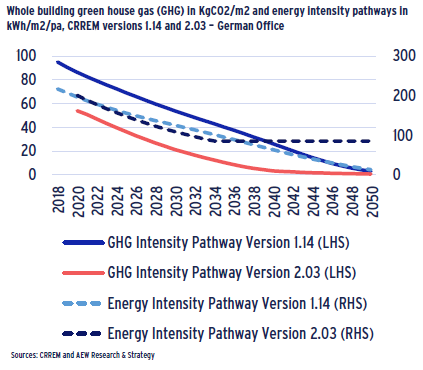
- The 2.03 CRREM pathways are more precisely aligned with the latest climate targets and national grid emission factors from IPCC, IEA and SBTi and focus on energy consumption and available sources of renewable energy.
- New and more granular data from GRESB, local green building councils and others have also been incorporated to move the CRREM baseline year to 2020 from 2018 in the latest CRREM version.
- Since real estate owners cannot improve the efficiency of transmission and distribution of energy, the new decarbonisation budget now also excludes these efficiency losses as per SBTi guidelines.
- CRREM’s latest pathways took into account feedback from a robust external and internal review process which highlights its broad interest and wide acceptance across the real estate industry.
- As a consequence, required energy intensity reductions have diminished slightly compared to the previous version and level out after 2037 as further grid decarbonisation takes over.
CURRENT ENERGY EFFICIENCY VARIES WIDELY
- It should be recognised that the CRREM pathways assume an average building as estimated by data available to the CRREM tool.
- However it is not surprising that CRREM targets should pose a bigger challenge for low-efficiency and non-prime buildings.
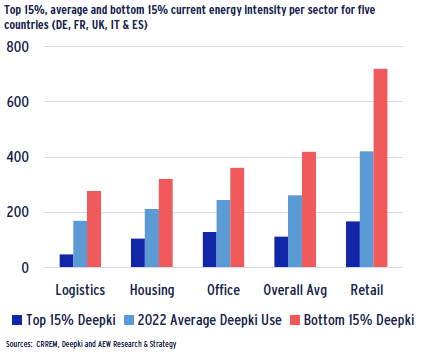
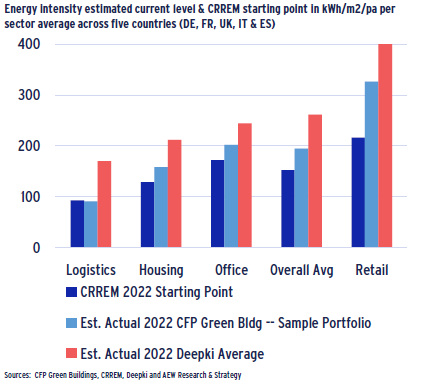
- Based on data released by Deepki we can show the wide dispersion in kWh/m2/pa intensity across buildings in key sectors and countries.
- The most efficient top 15% of buildings have an actual 112 kWh/m2/pa use (less than half the average building at 262 kWh/m2/pa and just a quarter of the least efficient 15% of buildings).
- Across all sectors, the least efficient buildings will have to reduce their energy intensity by seven times to meet the CRREM 2042 target.
- The least efficient (non-cooled) logistics buildings will even need to reduce their energy intensity by 12 times their current levels by 2042.
- These discrepancies highlight the need for testing the CRREM analyses with more precise property-level data.
- To do this testing, we use CFP Green Building data on both actual kWh use and energy intensity reducing capex costs in Euro per m2.
CRREM STARTING POINT WELL BELOW OTHER ACTUALS
- Apart from the dispersion of actual building uses around averages, we also note that CRREM version 2.03 assumes a 2022 starting point of use at 152 kWh/m2/pa, which is lower than some other sources.
- Across all sectors, we have an estimated 152 kWh/m2/pa from CRREM as of 2022. This is low compared to both the 262 kWh/m2/pa reported by Deepki and 194 kWh/m2/pa for our 300+ portfolio sample with CFP.
- The differences on a like-for-like basis are likely to be smaller. CRREM’s data addresses the whole sector based on EU/national data and not just institutional assets. Definitional and data-related issues also play a role.
- Deepki data is based on energy use at the source of production (as required by EU regulations), while CRREM is based on energy use of the building as per the global SBTi guidelines.
- There are also some differences in how property types are defined, with CRREM’s new version differentiating between multi-family and single-family residential and cooled and non-cooled logistics warehouses.
- Since CRREM collaborates with Deepki and other data partners in the market, we expect these differences to become smaller in the future.
- In the meantime, we note the discrepancies but do not adjust for them in our analyses.
ENERGY REDUCTION COST ESTIMATE BASED ON FIVE STEPS
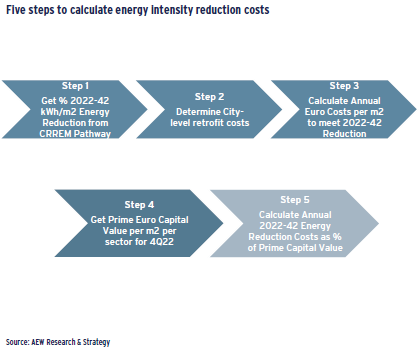
- The diagram shows our five-step approach to estimating the energy intensity reduction costs :
1. Look up the % energy intensity reduction needed in kWh per sqm from the pre-filled version 2.03 CRREM tool for each country’s five sectors (residential, high street retail, shopping centres, offices and logistics);
2. Determine the city-level retrofit costs from Arcadis;
3. Calculate the annual costs in Euros per sqm to meet the 2022-42 energy intensity reduction requirements to meet the Paris Accord targets (taking into account the % needed and the CRREM change in costs over time);
4. Determine CBRE prime capital values as of year-end 2022 for each city-property type segment ;
5. Calculate the annual energy intensity reduction costs to meet the Paris accords-based CRREM pathways as a % of prime capital value for each of our 196 city-sector segments.
STEP 1: NATIONAL ENERGY INTENSITY REDUCTIONS
- The CRREM tool is based on the Paris Accord, which specifies a global carbon budget for GHG emissions to limit the temperature increase to 1.5 degrees Celsius.
- A specific carbon budget for the European commercial real estate sector is the basis for the reduction in GHG for each EU country.
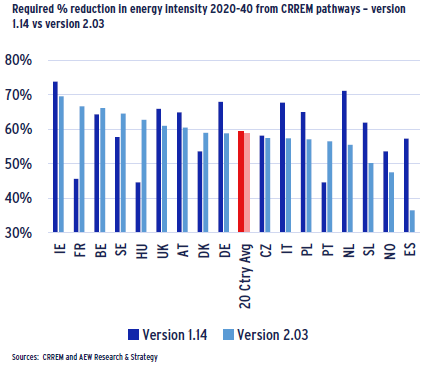
- Our chart shows the wide national dispersion in required kWh/m2 intensity reduction by 2040 with an average of just below 60% from its estimated (and unchanged) 2020 European average level.
- Even though the European average reduction remains unchanged, there are some large adjustments for individual countries compared to the previous version 1.14 CRREM pathways.
- Countries with higher reduction requirements include France while other countries such as Spain, Netherlands, Germany and Italy have lower targets compared to the original pathways.
- As mentioned before, each of these national changes is based on the updated data and improved methodology, as well as input from both national and global partners with the updated 2.03 version.
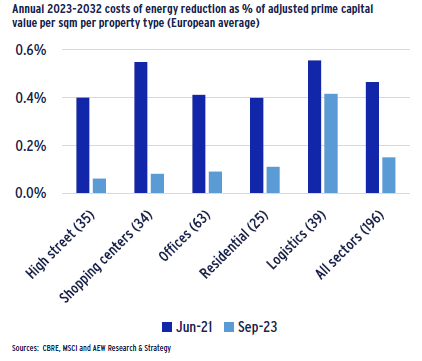
STEPS 2-3: ENERGY INTENSITY REDUCING COSTS AT EUR 8 PER SQM PA
- As before, CRREM allows for variations in local costs based on the European Construction Costs index, or ECC.
- ECC is used to establish the construction costs of 2018 UK office as the benchmark at 1.0 and the cost differences for each country.
- In version 2.03, CRREM no longer makes property sector adjustments, which is logical given that the retrofit costs for double glazing, insulation, LED lighting etc. are unlikely to differ by the use of the building.
- However, we do make one refinement to the costs in CRREM by using city-level data from Arcadis for retrofit costs/ allowing for more specificity across cities since the CRREM tool itself offers a national average.
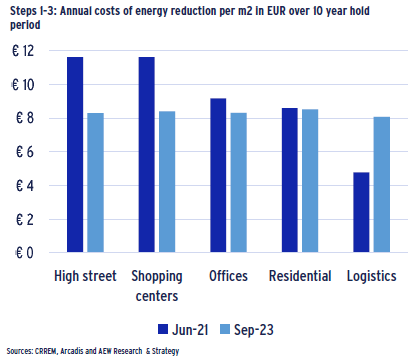
- Our chart confirms lower costs than in our Jun-21 analyses and the lack of sector-level cost differentiation compared to our Jun-21 estimates.
- Our cross-sector estimate of retrofit costs to reduce energy intensity to achieve CRREM pathways stands at 8 EUR/m2/pa across sectors using the latest 2.03 CRREM version.
- It would be reasonable to expect further CRREM refinements in the future as better cost data becomes available.
STEP 4: USE ADJUSTED PRIME CAPITAL VALUES AS DENOMINATOR
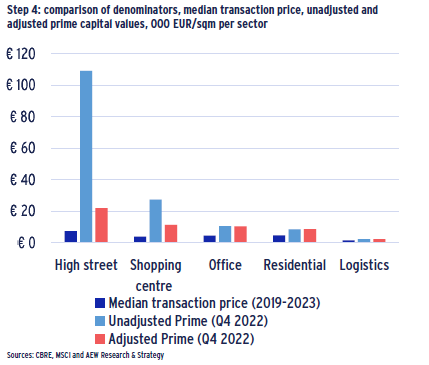
- In our next step, we make a major adjustment compared to our 2021 approach by changing the denominator from historical transaction prices to each segment’s prime capital value as of year-end 2022.
- This is done to ensure consistency with the other risk premia in our relative value approach which compares the prime expected return with a risk-adjusted required rate of return for each of our 168 segments.
- The ratio of median transaction price compared to prime capital value is between 1.5 and 2.5 for all non-retail segments.
- Given the extreme difference between median prices and prime values for both high street retail and shopping centers, we adjusted to the prime value at 3.0 times the median price.
- This is justified as liquidity for these prime retail segments is much more limited than in the other property sectors.
- Moving from transaction prices to (adjusted) prime capital values does have a significant impact on our results.
STEP 5: TRANSITION RISK PREMIUM AT 15 BPS ACROSS SECTORS
- Given that our estimate for the required energy intensity reduction costs is specified per city-sector and as a percentage of prime capital values, it can be defined as a climate transition risk premium.
- Investors will require this premium to be compensated for the climate-related transition costs of energy intensity reduction.
- The magnitude of the European cross-sector average transition risk premium is estimated at 15 bps. This is a more than 60% reduction compared to our 48 bps estimated from our Jun-21 analyses.
- This change is explained mostly by our change in the denominator from price-linked to prime capital values. However, it should be noted that the per square meter costs also went down.
- Similar to the Jun-21 results, we show that the logistics sector has the biggest climate transition risk premium.
- Please note that we have been able to increase our coverage from Jun-21 at 168 to now include 196 market segments.
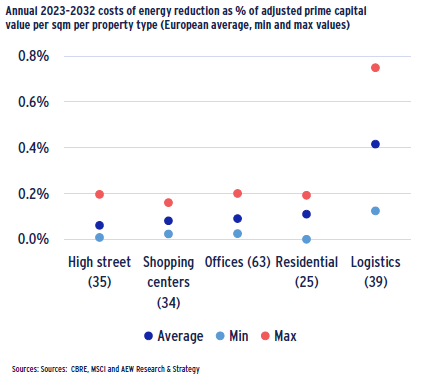
RESULTS SHOW MAXIMUM TRANSITION PREMIUM OF NEAR 80 BPS
- Average values across all markets hide a lot of variation within the analysed sample.
- The variation of the costs varies between as little as 1bps for retail and residential sectors to as much as nearly 75 bps in logistics.
- Sector maximums stand at 20 bps for Budapest high street retail, Edinburgh logistics with 75 bps, Edinburgh offices with 19 bps, Lisbon residential with 19 bps, and Bristol shopping centres with 16 bps.
- The largest variation in the costs is in the logistics sector, where the difference between the highest and lowest costs in the sector is 63bps.
- In other sectors the variation is significantly lower, with an average value of 17 bps between the highest and lowest cost.
- The variation in cost relative to values is attributable not only to the differences in denominator between different markets that are described earlier but also to the differences between sectors within the same city.
- The differences between sectors within the same city are, on average, 23% between the sector with the highest cost to the sector with the lowest cost within the same city.
SECTION 2: REAL WORLD TEST OF THE TRANSITION RISK ESTIMATE
SIMILAR MARKET-LEVEL COSTS BUT DIFFERENT ON SAMPLE PORTFOLIO
- We compare market-level transition risk costs with precise costs that are estimated for a portfolio of 513 buildings by CFP Green Buildings.
- CFP Green Buildings estimates the required capital expenditures that individual buildings need to make to be in line with their national and sector specific CRREM energy intensity pathway.
- The average cost of required retrofit for the portfolio comes out at EUR 17/sqm/pa across the five sectors, as shown in the chart. This is higher than our EUR 8/sqm/pa average estimate for prime markets.
- The largest discrepancy is with shopping centres, where the discrepancy is more than four-fold, while logistics are nearly the same.
- These discrepancies are likely explained by the non-prime properties within the sample portfolio, as well as in the discrete nature of improvements required, e.g. roof, window replacements or insulation.
- This sometimes results in an “overshoot” of energy intensity targets being exceeded as there is no way to only do half a project. We have adjusted for this on our comparison.
HIGH STREET RETAIL HAS THE HIGHEST CAPITAL VALUE PER SQM
- Using a precise sample of 513 buildings allows for more precision in the estimation of property values that are used as a denominator for costs, expressed as bps of underlying property value.
- Transaction prices for the portfolio are sourced from RCA/MSCI and we adjust them to the end of Q4 2022 to account for the value change that happened in the markets since the actual time of purchase.
- The chart presents the comparison between the sample’s property prices indexed to Q4 2022 and market-level prime capital values (with retail sectors adjusted as described before).
- Office and logistics values are the closest in terms of proximity of the CFP portfolio and our in-house market level estimates.
- High street retail and residential sectors’ estimates are higher for the sample portfolio, while adjusted prime shopping centre values are higher on a prime market level.
- These values are crucial for bps interpretation of the costs of climate transition risk for investors.

SHOPPING CENTRES ARE AN OUTLIER IN COMPARATIVE ANALYSIS
- Combining the nominator with the denominator allows the costs as bps of value to be estimated for the 513 buildings, as well as market-level estimates.
- On a market level, average transition costs account for 56 bps of prime capital value per annum for logistics, followed by 10 bps for residential, 9 bps for offices and shopping centres, and 7 bps for high street retail.
- The CFP results show a similar order in regards to sectors across the sample portfolio, with logistics having the average annual costs at 78 bps, residential at 34 bps, offices at 27 bps, and high street at 20 bps.
- Shopping centres, however, are a clear outlier showing a large discrepancy between our market level and CFP’s portfolio level estimates.
- The discrepancy is due to CFP’s higher retrofit cost and actual sales prices, which are lower than the adjusted prime capital values we use in our market level approach.

SECTION 3: RIVER FLOOD & SEA LEVEL RISE COST ESTIMATES WITH IVM’s REACT BETA TOOL
NEW TEST SHOWS NO RISKS FOR HALF OF THE CITIES
- Last year’s MunichRe data showed that only one city is not affected by these risks. 31 were affected by the river flood risk only, one city was only exposed to the sea level rise, and 19 cities by both risks.
- This year we estimate the risks using the React beta tool from the Institute for Environmental Studies (IVM) which is part of the Vrije Universiteit Amsterdam.
- We apply the tool to a sample of 3,303 buildings in 51 cities, which overlap last year’s sample with the exception of Utrecht.
- We were able to identify the river flood risk for the properties located in 21 cities, sea level rise risk in one city, and both risks in three cities.
- In contrast to MunichRe’s results, the sample portfolio showed no building level flood risk for 26 of the 51 cities covered.
- Please note the difference in the samples that we compare: MunichRe’s data was based on prime market polygons, while for this year’s test, we used a sample of individual buildings sourced from RCA.
- The underlying flooding area source is also different: IVM’s React beta tool estimates are based on open-source flooding maps from the European Commission, Copernicus, and World Resources Institute.
FLOOD RISKS COSTLIER AT THE INDIVIDUAL BUILDING LEVEL
- All cities with estimated river flood and sea level rise risk with IVM React’s beta tool were also identified by Munich Re, but with different results.
- The average cost of 10 bps pa for the buildings affected by river flood risk identified with the open-source maps and estimated with IVM’s React tool stands at more than three times the 2022 MunichRe level of 3 bps pa.
- For the sea level rise, IVM’s React Tool allowed us to identify only four regions in the UK and the Netherlands with a sea level rise risk with an average cost of 5 bps of prime capital value of affected buildings versus average 4 bps estimated by MunichRe for these regions.
- Explanation for the higher IVM estimates are linked to sample selection and also the fact that IVM consider affected buildings only.
- MunichRe results were estimated by interpolating polygon-level losses onto the flooded area of the polygons. This likely results in lower estimates than on a per building basis since not all buildings are affected.
- Given that the IVM React tool is still in Beta version, we expect that these estimates will potentially improve in future as higher-precision sea level rise maps become available.

FLOOD RISK UPDATED ACROSS AFFECTED AND UNAFFECTED SEGMENTS
- In our Jul-22 report, we used MunichRe expected loss data on river flood risk and our own estimate on sea level rise to calculate premiums.
- To allow for an updated view, we increased the reinstatement costs and we used the estimate increase from 2022 to 2023 construction costs for UK offices from costmodelling.com as well as the Arcadis city-level differences.
- In addition, to ensure consistency across risk premia, we used our updated capital values as the denominator, the same as those used for the transition risk estimate.
- Based on these two changes in our updated methodology, river flood risk nearly doubled from 3 bps to 6 bps pa across the 133 impacted segments, and to 4 bps across all 196 segments, including unaffected.
- Sea level rise premium increased by nearly 50% from 1.3 bps to 1.8 bps pa on average across the 47 segments affected, and to 0.4 bps across all 196 segments, including unaffected.

SECTION 4: CONSOLIDATING CLIMATE RISK THROUGH QUARTILE STRATIFICATION
RIVER FLOODS EDGE HIGHER THAN SEA LEVEL RISE CLIMATE RISK
- Across our cohort of studied segments we add up our updated transition risks to the physical climate risk.
- We follow a market by market approach where each market has its own physical risk estimation both in terms of sea level rise and river floods.
- River flood risk remains the primarily higher physical risk ahead of sea level rise nearing 3.9 bps on average against 0.4 bps for sea level rise.
- This difference of intensity might be explained by the heterogeneity between the cities within our sample as some are non-coastal, other are subject to natural defenses or might be in some situation exposed to both risks simultaneously
- After our last update and as explained above, our transition risk now stands at 15 bps as a result of the update in the CRREM pathways and a change in our methodology.
- We conclude that our results still show a relatively low but significant physical risk in comparison to a well quantified and identified transition risk.
CLIMATE RISK IMPACTS DIFFER WIDELY AROUND 19 BPS ON AVERAGE
- Markets show disparities in climate change risk premium results whether physical or linked to transition. Whereas transition risk remains ahead in terms of costs, physical may be important in a specific city due to its nature and vulnerability.
- Transition risk differences between the different segments on the other hand, are due to many factors such as energy intensity reduction costs as presented through the last CRREM tool update, retrofit costs or the capital values within the city.
- Across markets, we note that Lyon and Paris show a relatively high river flood risk as their Dutch counterparts Amsterdam and Rotterdam face more of a sea level rise physical risk.
- Some cities like Hamburg or Lisbon are subject to both physical risks simultaneously as a result of their geographical position.
- London is showing relatively low transition risk premium across its different segments due to higher capital values, this denominator effect was highlighted earlier.

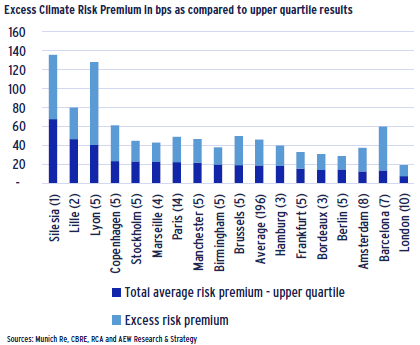
EXCESS CLIMATE RISK PREMIUM FOR NON-PRIME ASSETS
- Since the cost of the energy reducing retrofits is unlikely to be different between prime and non-prime assets, prime assets benefit from high capital values to reduce the basis points impact. Therefore, it is useful to look at the impact on non-prime assets.
- To reflect non-prime asset values, we use an adjustment factor that is defined as the ratio between the 25% highest priced assets compared to 25% lowest priced assets over the 2019-2023 period for each individual segment (sector and city).
- Compared to the 19 bps average for all prime markets, we show an average of 46 bps of capex for non-prime assets required to meet climate related risks.
- For some markets the impact on non-prime assets is estimated to be more significant, as in the case of Lyon, going from 41 bps for prime segments to 128 bps for non-prime segments.
- In an efficient market, we would assume that the 27 bps excess climate risk premium for non-prime assets is reflected in the transaction yields as priced by markets participants. However, we do not suspect that this is currently the case.
This material is intended for information purposes only and does not constitute investment advice or a recommendation. The information and opinions contained in the material have been compiled or arrived at based upon information obtained from sources believed to be reliable, but we do not guarantee its accuracy, completeness or fairness. Opinions expressed reflect prevailing market conditions and are subject to change. Neither this material, nor any of its contents, may be used for any purpose without the consent and knowledge of AEW. There is no assurance that any prediction, projection or forecast will be realized.
Photo Credit: Adobe