REGIONAL OFFICE MARKET RESILIENCE IN TOUGH RE-BALANCING
- European office investment markets are expected to record a post-GFC low annual volume in the full year 2023. This is driven by higher interest rates, rendering debt non-accretive coupled with uncertainty surrounding hybrid working and increased working from home (WFH).
- In addition, a shifting preference for higher quality assets has led investors to reassess the risks of obsolescence of secondary offices. Therefore, they are proving slower to transact as investors need time to quantify the impact on rents, speed of leasing and ESG-related capex.
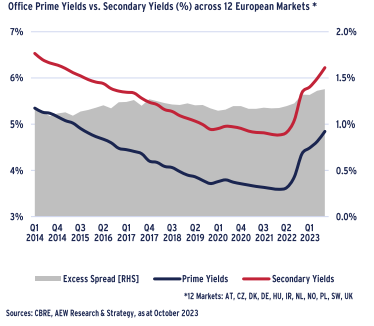
- This bifurcation between prime and secondary European offices is confirmed by the new record high excess spread between prime and secondary yields of 138 bps.
- Overall, we think investors’ concerns about the office occupier market are overstated. Therefore, we take a closer look at the structural drivers of occupier demand and supply.
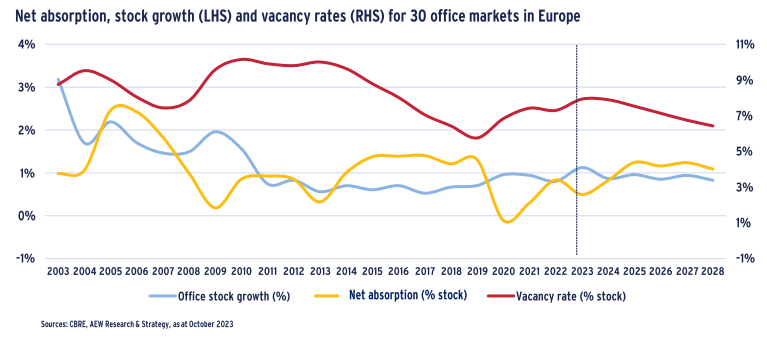
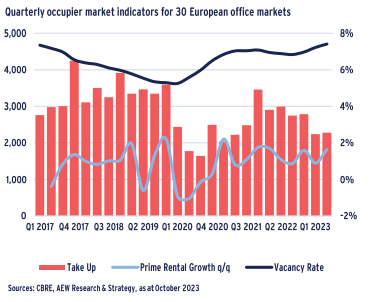
- The limited new supply in central office areas combined with a recovery in post-lockdown take-up is driving rental growth. In fact, prime headline rents have sustained their rebound post-Covid with a solid 1.4% quarterly increase over the last ten quarters.
- Vacancy across European office markets is expected to peak at 7.9% by 2024, as new development deliveries start to slow down.
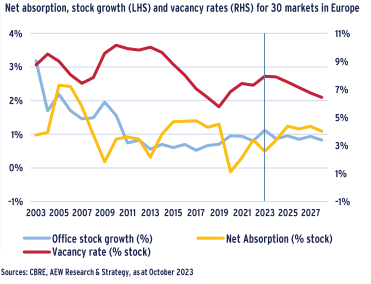
- Stock growth, which has been contained since the GFC, is expected to scale back to under 1% p.a. after a moderate catch-up post-Covid. Simultaneously, net absorption is expected to revert back to pre-pandemic levels by 2025.
- However, office usage rates are still not back to pre-Covid levels, pointing to a lasting impact in terms of reduction of office needs. A recent stabilisation of office space per employee, partially offsets that.
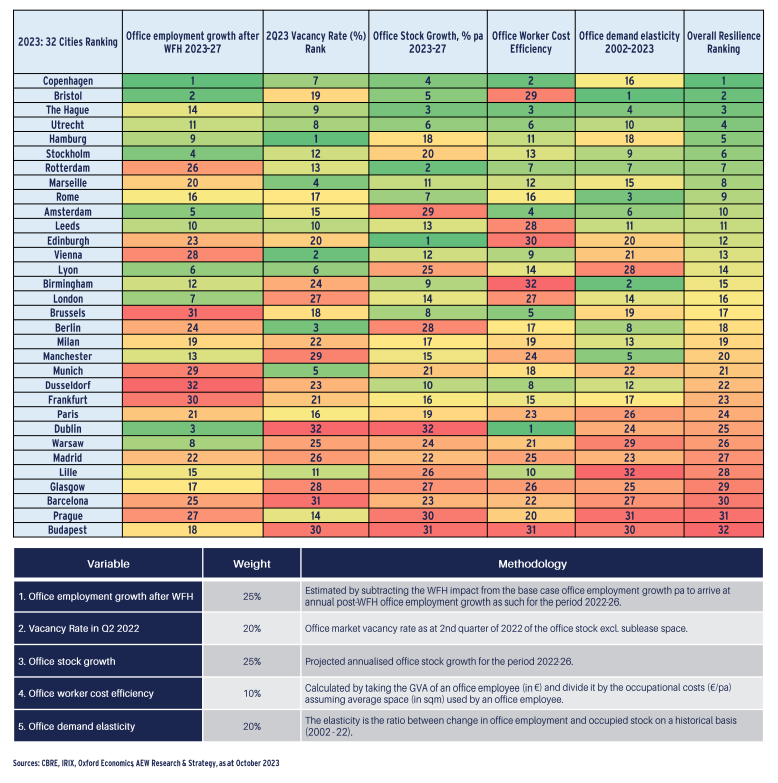
- Our resilience ranking for European office markets, based on a data-driven assessment of property trends, weights five key related demand and supply variables including office employment growth after WFH and demand elasticity for 32 markets.
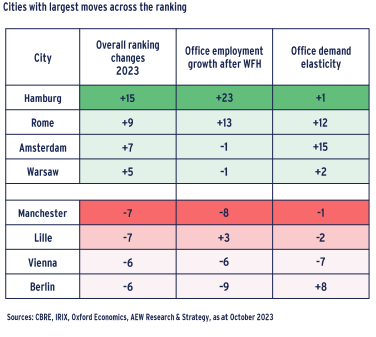
- Our latest rankings show Copenhagen, Bristol ,The Hague, Utrecht and Hamburg are most resilient in a post-Covid office environment. Compared to last year’s rankings, Hamburg, Rome, Amsterdam and Warsaw recorded the largest positive changes.
INVESTMENT MARKET: OFFICES LATE TO REPRICE
2023 OFFICE INVESTMENT ON TRACK FOR NEW POST-GFC low
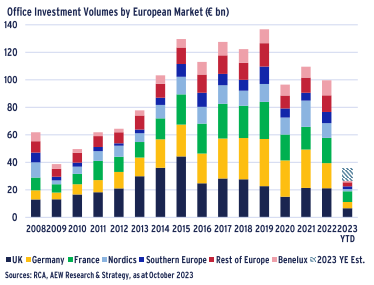
- Quarterly European office investment has declined dramatically after remaining relatively stable post-Covid for both 2021 and 2022.
- This slowdown in office investment which began in H2 2022, has continued to gain momentum in 2023, with Q3 2023 volumes falling to €6.1bn - their lowest quarterly level since 2008.
- As a result, 2023 YTD transactions total €27.8bn. This is still 26% higher than the post-GFC level of 2009.
- However, investment activity remains subdued as a significant repricing of office assets is under way.
- Investor sentiment is dampened by rising interest rates, limited availability of debt and continuing uncertainty surrounding hybrid working practices.
- Resulting bid-ask spreads will take time to close before trading volumes can recover. As a result, we estimate full year 2023 European office investment volumes at €36bn, just below 2009.
HIGHER INTEREST RATES RENDER DEBT NON-ACCRETIVE
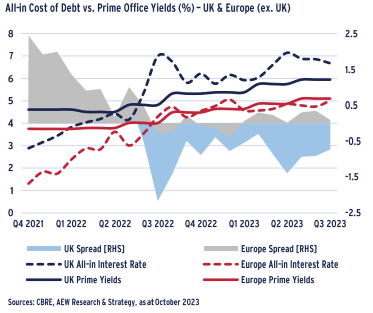
- Since many investors have traditionally used debt to finance their acquisitions and all-in debt costs have stabilized at an elevated level, the key question is whether debt is still accretive.
- In that respect, the excess spread of prime European office yields over all-in interest rates has narrowed significantly, since 2021 year-end, but remains positive.
- On the other hand, UK all-in borrowing costs as well as prime office yields have been higher than in Europe over the period, as indicated in the chart.
- Consequently, the UK excess spread has been negative since Q3 2022. Since then, it has improved from its lowest level of -220 bps by the end of Q3 2022, despite a short reversal in Q2 2023.
- This means that at the moment, debt is not accretive versus prime yields for prime office acquisitions, especially in the UK.
- As inflation levels subside and central banks pause rate hikes, bond yields and borrowing costs will start to come down, which should mean that the excess spread becomes accretive once again.
BIFURCATION AMPLIFIED BETWEEN PRIME & SECONDARY
- Yields have increased for both prime and secondary offices due to the high interest rate environment and investors’ concerns about the rise in hybrid working and required capex to meet ESG standards.
- Both prime and secondary European office yields widened from their lowest point in Q2 2022 to Q3 2023 by 126 bps and 147 bps, respectively.
- As a result, the excess spread between prime and secondary across 12 European markets increased to a new record high of 138 bps, reflecting the bifurcation in investor demand.
- Secondary assets are expected to underperform, due to escalating energy, locational and amenity requirements from occupiers
- Secondary offices that no longer meet EPC and ESG standards for investors and occupiers are more likely to remain vacant for longer, and therefore secondary yields have widened more sharply.
- In the current rate environment, this is likely to continue until secondary yields are attractive enough to attract value-add investors willing to carry out energy retrofits and redevelopments.
RENTAL GROWTH RETURNS DUE TO LIMITED SUPPLY
POST-COVID PRIME RENTS POST SOLID 1.4% QUARTERLY GROWTH
- Prime headline rents have continued their post-Covid rebound with a solid 1.4% quarterly average growth for the last ten quarters after their declines during the height of the pandemic in 2020.
- The limited new supply in central office areas combined with a recovery in post-lockdown demand take-up are driving these prime rent increases.
- While many occupiers have downsized their office space requirement recently, these reductions have mostly affected peripheral sub-markets, like La Defense and Canary Wharf.
- In central business districts, the demand dynamics for prime space remain positive, additionally driven by an increase in take-up from co-working operators.
- Average European vacancy rates increased by 220 bps from their lowest level of 5.2% pre-pandemic Q1 2020 to 7.4% in Q2 2023.
- However, it is expected to peak by 2024 as new development deliveries start to slow down.
GROWTH IN OFFICE SUPPLY SCALED BACK TO UNDER 1% P.A.
- Most concerns regarding offices have focused on the demand side of the market, but it is important to consider new supply.
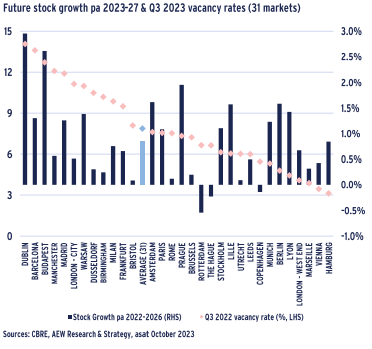
- CBRE projects office stock to grow 0.9% p.a. over the next five years across the 32 markets for which data is available. This is low, compared to a historical average of 1.3% p.a. (2001-2019).
- CEE markets with high current vacancy rates will be vulnerable as they are projected to have a strong increase in stock as well.
- Markets in the UK and Germany with low stock growth and below average current vacancy are better positioned.
- Future stock growth could be lower than CBRE projects because:
- 1. Higher construction costs (materials and wages) erode developers’ profitability for planned projects
- 2. With recent rate hikes this will limit the availability of new development debt finance and increase its costs
- 3. Upcoming EPC regulatory deadlines will force a greater investor focus on retrofits of ensuring the viability of existing buildings and less on creating new ones
NET ABSORPTION EXPECTED TO RETURN TO PRE-COVID LEVELS
- Based on the latest CBRE projections, net absorption will be ahead of new additions to office stock from 2024 onwards.
- This means that average vacancy rate across our 30 covered office markets is expected to peak at 7.9% in 2023/24 and come down to 6.4% by 2027.
- Occupiers’ ability to downsize will depend to a large extent on whether they can manage their workers’ usage peaks between working days as well as whether they are able to implement hot desking.
- Since many occupiers have been focused on securing high-quality office space in the best locations, prime rental growth should prove resilient amid undersupplied core office markets.
- However, the CBRE net absorption projections may not be fully reflective of the WFH impact yet. This warrants some deeper analysis.
OFFICE DEMAND INDICATORS STARTING TO STABILISE
OFFICE USE ON A STABILIZING TREND
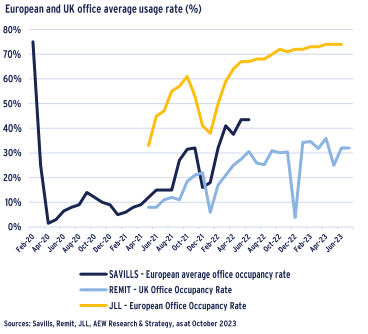
- Despite official vacancy rates recently increasing to 7.4%, data on actual office use shows a stabilizing trend.
- It should be noted that sources vary widely and use various definitions and anchor points.
- JLL European office occupancy has stabilized and stands at 74% of pre-pandemic levels, a dramatic improvement from the 40% levels seen during the lockdowns.
- Savills’ data, which measures office occupancy rates based on the average number of office workers over the course of a working week shows a similar trend up until June 2022.
- Savills’ latest available update from February 2023 indicates that the average occupancy rate increased to 55% which still remains substantially lower than the 75% level recorded pre-Covid.
- Savills’ European data is consistent with office usage data recorded by Remit Consulting in the UK for overlapping periods.
- Looking at the most recent available data from JLL and Remit, office usage has started to stabilize as companies implement their flexible working practices.
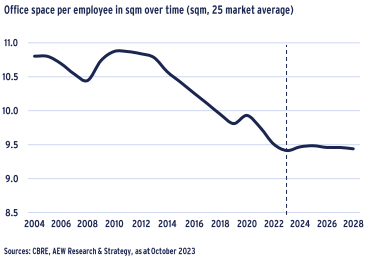
SPACE PER OFFICE EMPLOYEE EXPECTED TO STABILIZE
- As highlighted before, the long term trend of reduced office space per office employee since the early 2000s can be seen as confirmation of the long term viability of WFH.
- This lower space per worker has also supported the increased conversion from traditional office layouts to more flexible and serviced office space planning.
- Based on CBRE historical data, the average space per employee has declined from 10.8 sqm in 2004 to 9.8 sqm in 2023.
- During the last 20 years, office stock grew by 1.1% on average every year while office based employment grew faster at 1.7% annually, reducing the space per employee ratio.
- From 2024 onwards, it is worth noting that the office space per worker ratio is expected to stabilize as both office stock and employment are both set to grow at a slower rate of 0.9% y-o-y.
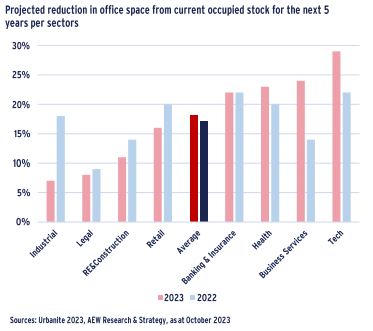
LATEST SURVEY SHOWS DICHOTOMY IN NEEDS ACROSS INDUSTRIES
- An 18% reduction in space demand is projected over the next five years based on the latest Urbanite survey of office occupiers in 16 countries, covering 15 million sqm of occupied space.
- This latest 18% projected reduction is similar to the 17% predicted in last year’s Urbanite survey.
- However, office space reduction from Health, Business Services and Tech related businesses are increasing from 2022 to 2023, while expectations for Banking and Insurance stabilized.
- On the other hand, projected reduction in office space in Industrial, Legal, Property and Retail have abated.
- As another year has passed since the pandemic and the surge in WFH, the impact of structural changes on office space needs seems to be identified more precisely between industries.
- To fit this new survey data into our existing analytical framework, we have used the industry sector specific survey results to adjust our original assumptions from 2022.
OFFICE EMPLOYMENT GROWTH REMAINS SOLID AS FLEXIBLE WORKING BECOMES PERMANENT
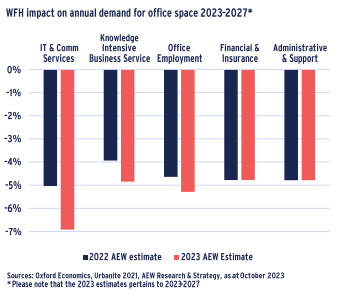
WFH IMPACT STARTING TO STABILISE AT JUST OVER 5% OF DEMAND
- Based on the latest Urbanite City Index survey data for 2023-27, we have updated our forecasts on the WFH impact on office space demand.
- Our analysis shows a further decrease in office employment due to ongoing WFH policies. Our 2023-27 projections fell to -5.3% pa from –4.6% p.a. from our 2022 estimates.
- As a result of greater remote working allowances, 36.6% of employees will work from home by 2027. As expected, this figure remains lower than our 2021 forecasts of 37.3%, as these took into consideration the WFH impact immediately after the pandemic.
- However, our 2023 results mark a slight uptick from last year’s projections of 35.5% by 2026, as companies have already started to incorporate flexible hybrid initiatives. This is a useful stabilisation.
- Divergence remains across industries. A bigger decline in office demand is projected for the IT and business service industries as employees are more likely to WFH.
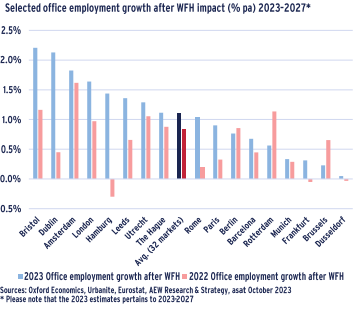
FUTURE OFFICE EMPLOYMENT RESILIENT DESPITE INCREASED WFH
- In order to calculate office employment growth after the WFH impact, we adjust annualized Oxford Economics projections for office employment with our WFH impact forecasts per city, for the 2023-27 period.
- Across our 32 markets, our estimated average office employment growth after adjusting for WFH increased to 1.1% p.a. from 0.8% last year.
- In our estimates, we have kept the 2016 INRIX traffic congestion levels consistent per city, as the basis to adjust the overall WFH impact for each city.
- Time lost, cost of transport and overall decrease of quality of life due to congestion are key reasons as to why employees would look to WFH more when commuting to/within congested locations.
- Annualized office employment growth (2023-27) in Hamburg, Dublin, Bristol and Rome, has improved the most compared to our 2022-26 forecasts.
- Conversely, the Dutch and major German markets scored below the average, with Budapest being the most negatively impacted by WFH prospects.
OFFICE EMPLOYMENT STILL BIGGEST DRIVER IN OUR RANKING
- When comparing the overall resilience rankings for 2023 vs. 2022, the final results demonstrate some significant moves across the individual cities.
- Whilst Hamburg saw a big drop in 2022, it has in fact recorded the largest improvement in this year’s results. Additionally, Amsterdam remains in the top four rankings, whilst Berlin in the bottom four.
- On the other hand, Manchester, Lille and Vienna saw the biggest losses.
- Similar to 2022, the overall resilience rankings for 2023 were mostly driven by the changes in WFH adjusted office employment growth, as is the case for Hamburg and Rome.
- In addition, changes in office demand elasticity also impacted our market rankings, but not to the same magnitude as office employment. This is pertinent to Amsterdam and to an extent, Rome.
- Both of these cities recorded lower demand elasticity ratios driven by changes in office employment and occupied stock. The lower the ratio, the less vulnerable demand is to shocks in office employment.
- Please note that office employment and demand elasticity have a weight of 25% and 20% in our overall rankings respectively, as shown on the next page.
EUROPEAN OFFICE MARKET RESILIENCE RANKING
Our resilience ranking for European office markets is based on a data-driven assessment of property trends, including the possible impact of working from home (WFH) by weighting five key related demand and supply variables for each of the 32 markets highlighted below.
This material is intended for information purposes only and does not constitute investment advice or a recommendation. The information and opinions contained in the material have been compiled or arrived at based upon information obtained from sources believed to be reliable, but we do not guarantee its accuracy, completeness or fairness. Opinions expressed reflect prevailing market conditions and are subject to change. Neither this material, nor any of its contents, may be used for any purpose without the consent and knowledge of AEW. There is no assurance that any prediction, projection or forecast will be realized.