REPRICED LOGISTICS GETS NEW LEASE OF LIFE
- While the macroeconomic outlook is expected to improve by 2024, the overall slowdown in retail sales volumes and weak economic sentiment have negatively impacted the logistics occupier demand in the short term.
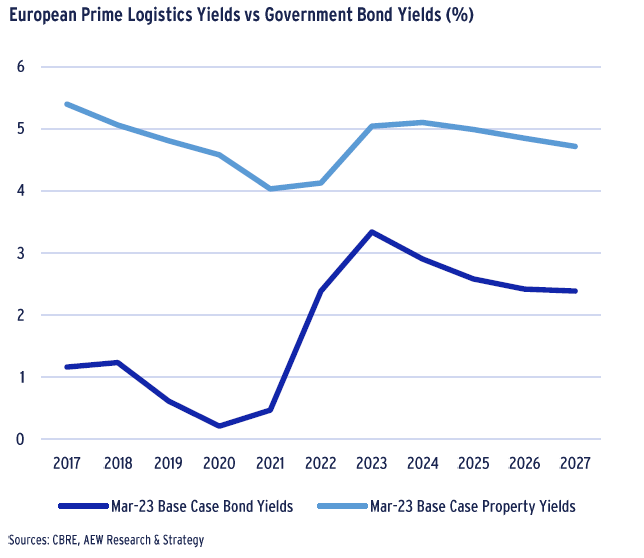
- Separately, government bond yields are projected to peak at 3.5% in Q3-Q4 2023 before gradually declining to 2.5% by 2027, in our base case. This is expected to push prime logistics yields back down by 2027, normalizing the excess spread between bond and property yields.
- European logistics leasing activity continues albeit at a slower pace as costs take center stage and Q1 2023 take-up declined by 44% y-o-y. Many occupiers are maintaining their current footprints for now. Take-up is expected to recover as the economy improves and manufacturing and shipping revert to long term growth and e-commerce penetration rebounds.
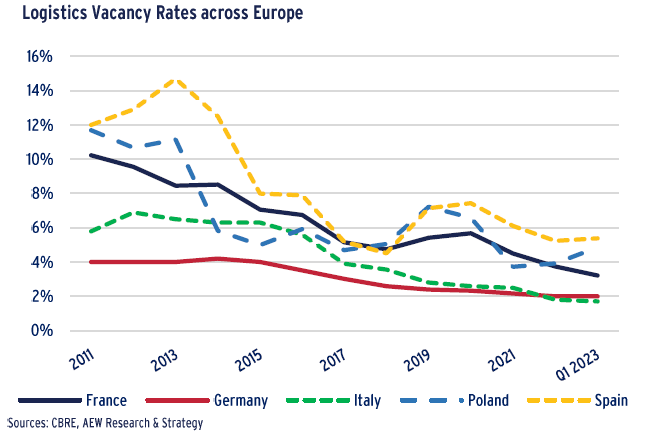
- With weaker take-up in the short term and existing pipeline projects coming online, the average vacancy rate is expected to increase a little bit but remain well below 4% and come down after 2024 as new construction slows down.
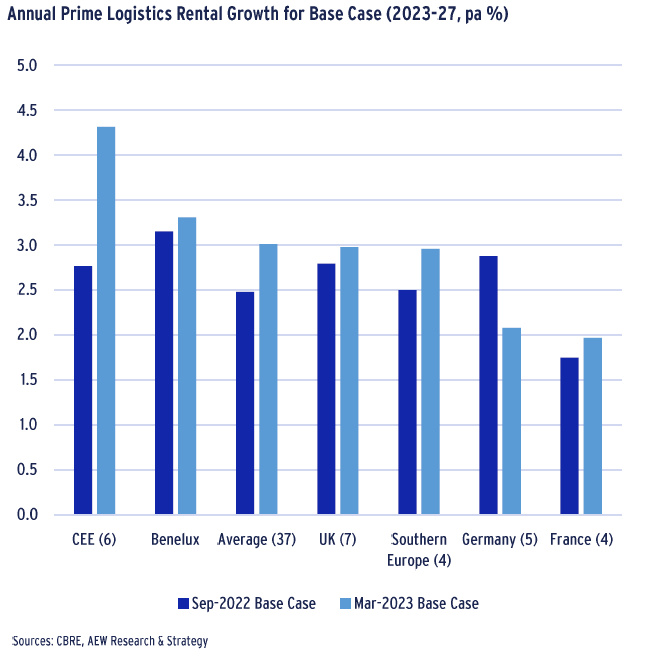
- Despite the rising vacancy rate, growth in prime rents has remained robust. Our logistics rental growth forecasts (2023-2027) remained the best across sectors and have stepped up from 2.5% p.a. in our previous Sep-22 base case projections to 3.0% p.a.
- In 2022, logistics was the quickest sector to re-price, losing an average of 14% of value across all of the European logistics markets. Most investors offset this 2022 loss by a 55% appreciation in the four preceding years, the highest of any sector.
- Logistics values have nearly bottomed out with only 3% further value decline projected in 2023. After this significant 2022-2023 repricing, logistics prime property yields are expected to peak at 5.1% in 2024 and gradually narrow to 4.7% by 2027.
- The 2022-2023 repricing triggered a reduced excess yield spread between logistics and government bonds. We expect this excess spread to return to positive levels and stabilize by 2027 at 2.3%, still below the 4% average 2017-21 spread.
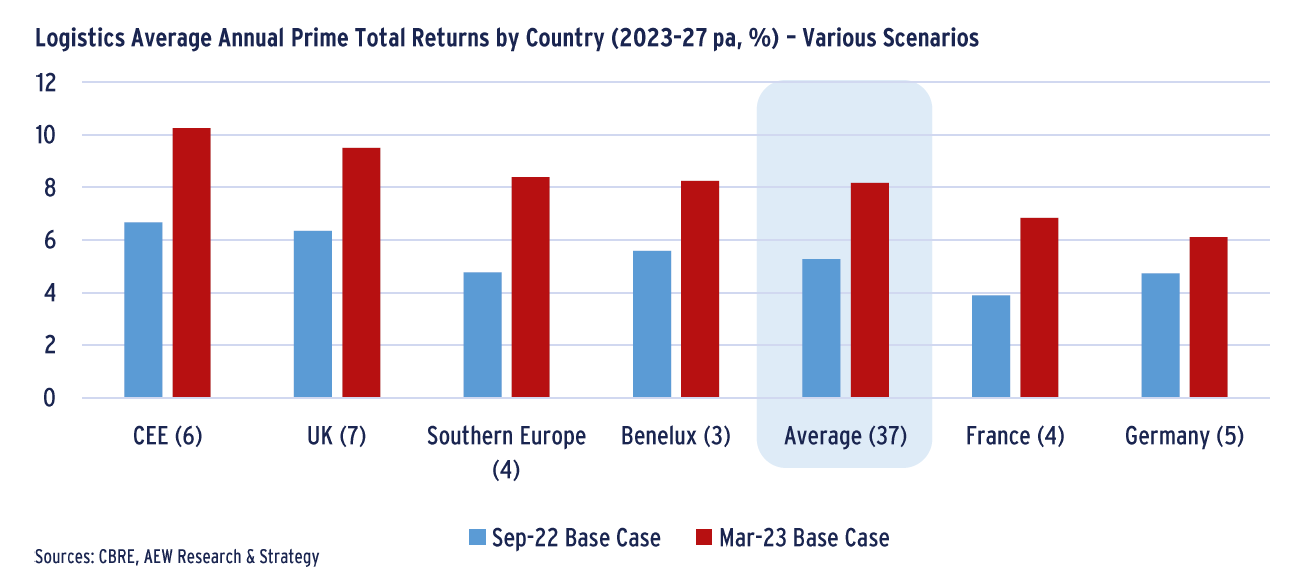
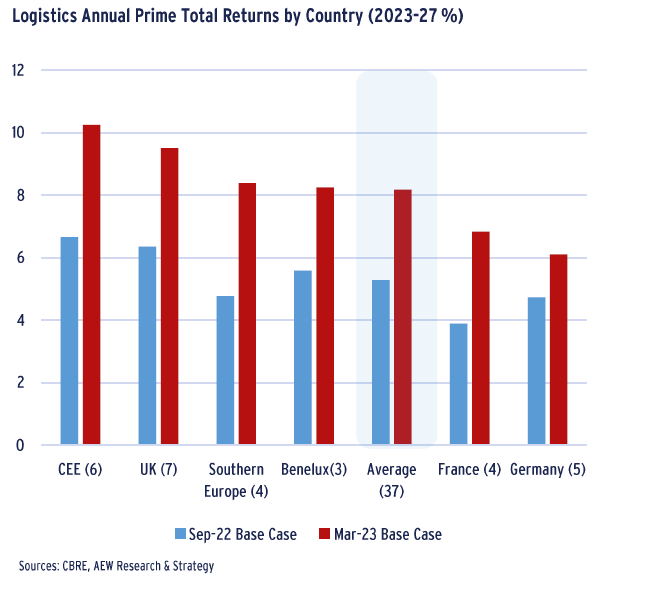
- As rents improve and yields are projected to tighten, total returns for logistics markets across Europe are estimated to improve to 8.2% p.a. for the next five years according to our Mar-23 base case. This is up 290 bps from our Sep-22 base case.
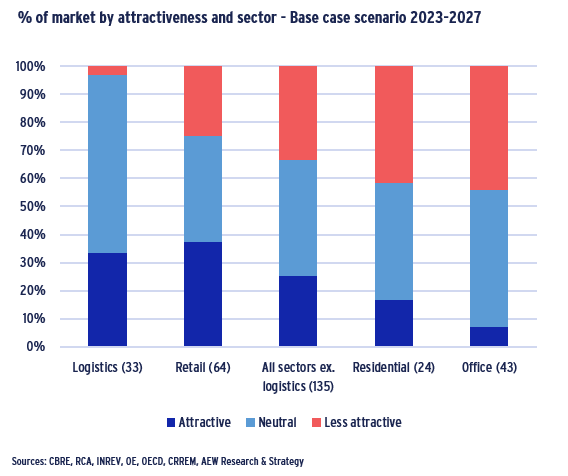
- Hence, in our relative value classification, logistics has the highest proportion of attractive and neutral markets of any sector in Europe. 33% of logistics markets are classified as attractive, 64% as neutral and 3% as less attractive in our base case scenario.
- The Nordics and Benelux regions have the highest proportion of attractive logistics markets. Half of the Southern European markets are classified as attractive. In the UK, France and rest of Europe most of the markets are classified as neutral, with the remainder as attractive. CEE is the only region with a single market (Budapest) that is classified as less attractive.
- On a city level, UK regional logistics and light industrial markets are well represented in the attractive category, followed by Paris light industrial as well as Oslo and Amsterdam logistics.
MACROECONOMIC FUNDAMENTALS
BOND YIELDS IN LINE WITH HISTORICAL AVERAGES
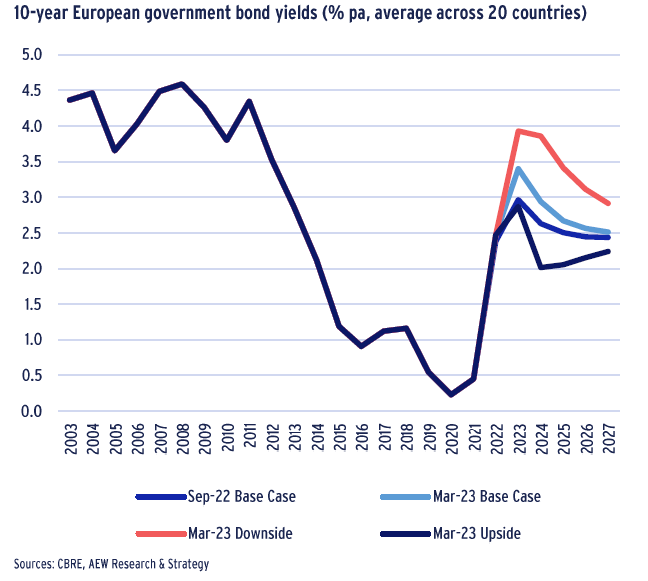
- Macro fundamentals have been driven by high levels of inflation. Over the last year European government bond yields increased by nearly 300bps on the back of central bank rate hikes aimed at curbing high inflation.
- The increase in bond yields means a definite reversal from historically low levels observed post-GFC and during the COVID pandemic.
- However, current yield levels are broadly in line with the pre-pandemic 20-year average of 3.4%.
- Government bond yields are projected to peak at 3.5% in Q3-Q4 2023 before gradually declining to 2.5% by 2027, in our base case.
- In our base case scenario, we also project a steady recovery in GDP growth that avoids a recession. This is a reversal from our Sep-22 base case when a recession and slower recovery was expected.
- The upside and downside scenarios are based on volatilities of historical forecasts. Annual average bond yields in these scenarios are forecasted to peak at 4.0% bps and 3.4% bps respectively.
- All of our bond yields are based on the 20-country simple average.
CONSTRUCTION COSTS MOVE CLOSER TO INFLATION
- As governments and businesses have found viable alternatives to embargoed Russian gas, the energy crisis has subsided.
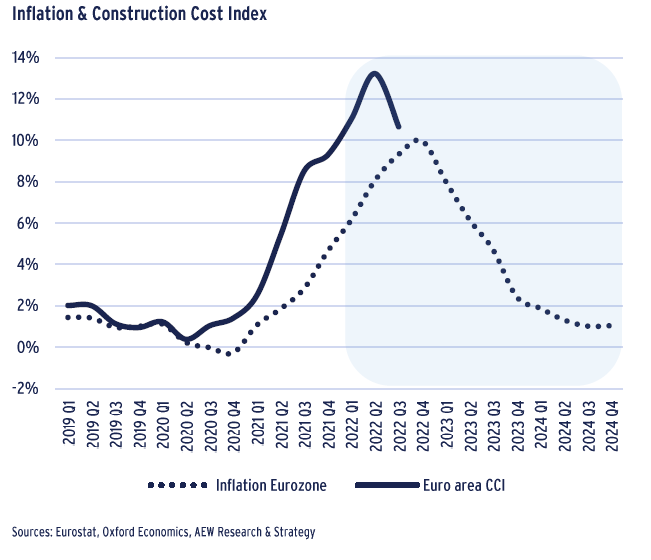
- Headline inflation in the Eurozone fell to 6.9% y-o-y in March from 8.5% in February as a result of lower energy inflation.
- Based on the latest forecasts from Oxford Economics, average Eurozone inflation was expected to come down to 5% at the end of 2023 and below the 2% target by the end of 2024.
- With the construction sector particularly exposed to the European energy crisis and subsequent high inflation levels, the Euro area construction cost index (CCI) peaked in Q2 2022.
- However, price expectations in the sector have been falling again during the last few months, with the CCI recording its first drop in value in Q3 2022, since Q2 2020.
- This comes as a surprise as most respondents expected the price to keep rising due to material and energy shortages. Additionally, the precise trajectory of inflation still remains uncertain; especially with recent OPEC production cuts and pressures on wages.
ECOMMERCE CONTINUES TO DRIVE DEMAND
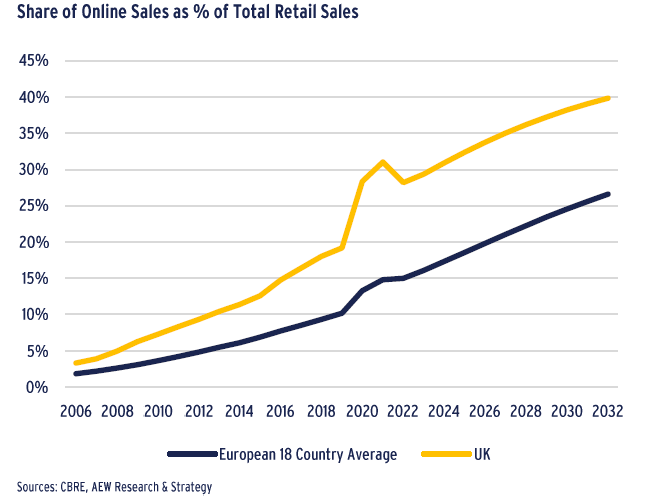
- The share of online sales is expected to double over the next ten years in Europe compared to pre-Covid levels.
- After a rolling series of lockdowns during the pandemic and the lack of open physical retail stores consumers stepped up their online shopping in 2020 and 2021.
- As customers returned to physical stores post-pandemic, the growth of online share paused in 2022 in continental Europe and decreased in the UK.
- Going forward, the number of online sales is expected to increase with online sales reaching 25% of sales by 2032 on average in Europe.
- This trend will support a continued demand for logistics warehouse space in the coming years, regardless of the macro-economic situation.
INDUSTRIAL DRIVERS
SUPPLY CHAINS STARTING TO NORMALISE
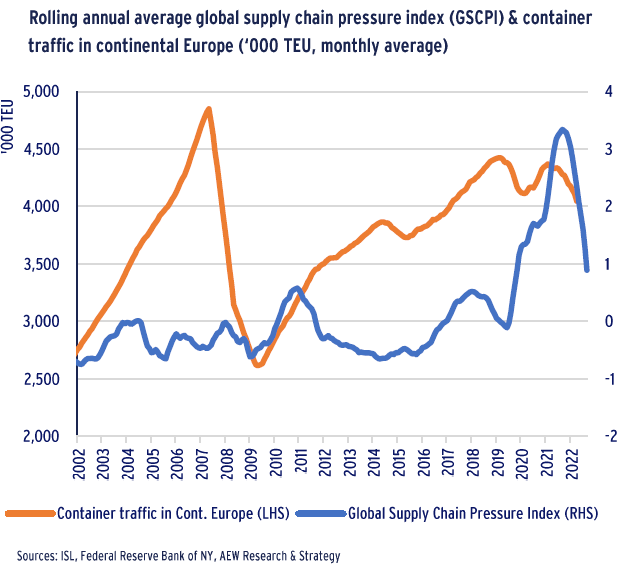
- With most Covid restrictions now lifted, global supply chain pressures are easing. As a result, the Global Supply Chain Pressure Index (GSCPI) has reverted back to its historical average.
- Whilst this means that freight deliveries and rates are more favorable to trade, container traffic is down 10% y-o-y in Q1 2023 as overall demand for global goods has weakened.
- The shipping industry is also impacted by decarbonization, as only 55% of the world’s fleet meets new International Maritime Organization (IMO) 2023 targets on toxic gas emissions.
- Whilst container fleets are gradually modernized to meet the IMO standards, shipment capacity and prices are likely to be negatively affected.
- As global trade continues to be impacted by cyclical and structural changes, we look more precisely at cargo movements within Europe using Kania Advisors data.
PORTS REMAIN LOGISTICS HUBS
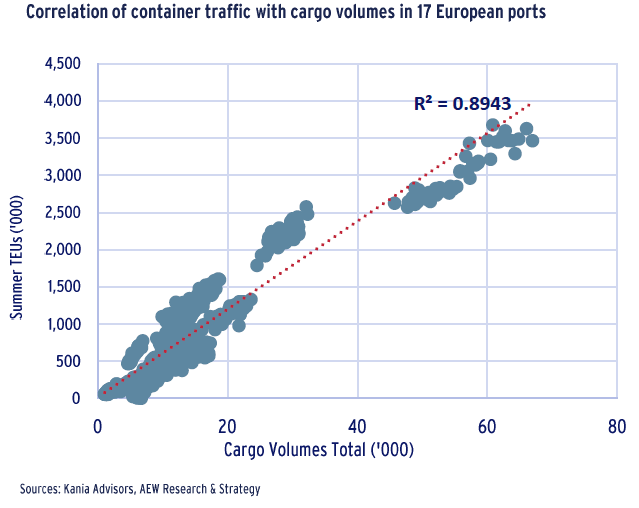
- The scatter chart illustrates quarterly data from Kania Advisors, comparing cargo volumes (including bulk cargo) and container traffic expressed in TEUs (twenty-foot equivalent unit), from 2010 to 2022. Overall, the data demonstrates a high correlation of 0.9 (each point represents quarterly data for each of the 17 European ports covered).
- This high correlation means that European container ports remain strategic logistics locations and entry points for global traders.
- The ports of Rotterdam and Antwerp-Bruges, which are positioned in the upper right cluster of the chart, registered high volumes of cargo as well as high TEU volumes.
- Along with Hamburg, these ports are located in the same vicinity and cover a large densely populated area, strengthening their position as logistics hubs.
- On the other hand, Barcelona and Dublin show lower cargo and TEU volumes as they cover a relatively less dense distribution area.
POPULATION DENSITY & TRANSPORT NETWORKS ARE KEY DRIVERS FOR CARGO VOLUMES
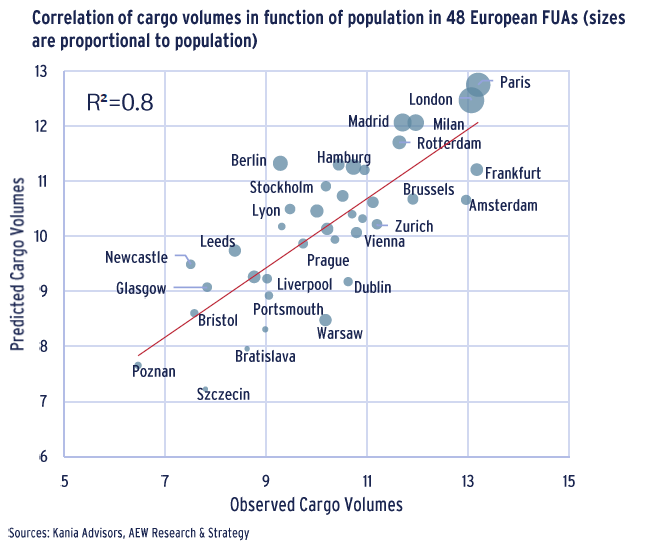
- Analysis, also from Kania Advisors, demonstrates a historical high correlation of 0.8 between cargo volumes (5 year average) and population (to date) within the OECD’s Functional Urban Areas (FUAs). The use of FUAs also considers additional criteria, such as density and the availability of transport networks.
- Cargo volumes in FUAs such as London, Paris, Milan and Madrid are expected to increase. Highly dense road networks coupled with large populations in these locations, require several dedicated logistics hubs to facilitate urban and regional distribution.
- Regional cities in the UK, such as Leeds, Newcastle and Glasgow are also expected to see an increase in cargo volumes.
INDUSTRIAL OCCUPIER MARKET
LOGISTICS TAKE-UP SLOWS DOWN
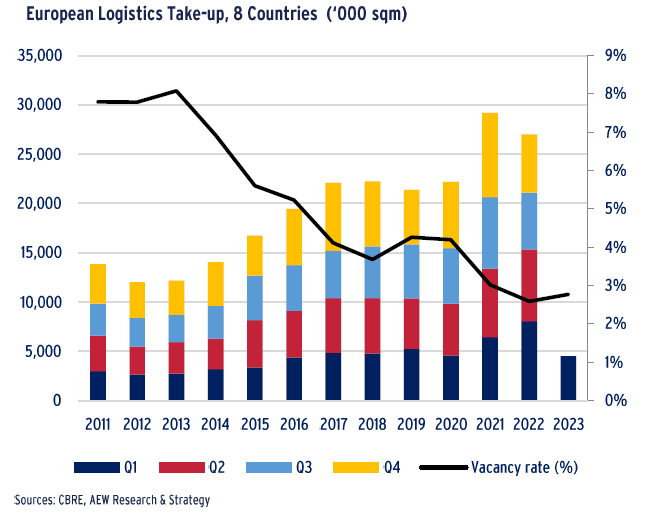
- The initial signs of a slowdown observed in the last two quarters of 2022 were confirmed in Q1 2023.
- European logistics take-up reached nearly 27mn sqm in 2022, down from the record 29.6mn in 2021.
- Q1 2023 recorded a 44% y-o-y decline which represents a significant quarterly decrease compared to the pandemic years. Whilst Q1 2022 was a record quarter in terms of take-up, the performance of Q1 2023 only remains 6% below the 10-year average.
- Deals are still taking place, but the process is taking significantly longer. Occupiers are increasingly prioritizing cost-consciousness due to growing concerns on affordability. This shift in approach has led to a decline in demand for big-box units, which typically require significant capital expenditure for fit-out costs. As a result, occupiers are opting to maintain their current footprints rather than seeking larger spaces.
COMPLETIONS KEEP VACANCY NEAR RECORD LOW
- The average vacancy rate, which had been gradually declining in recent years, increased from 2.6% to 2.8% in Q1 2023, reflecting the impact of slower leasing activity.
- Several factors contribute to this trend. In addition to weaker take-up, we are witnessing the completion of pipeline projects that broke ground when take-up was at an all-time high.
- Furthermore, some occupiers who previously occupied excess space have sought to optimise their footprints by subleasing excess space as their requirements have decreased.
- As a result, there is an upwards pressure on the vacancy rate.
- This trend is likely to continue in Q2 2023 until a slowdown in construction begins to translate into reduced completions later in the year.
IMPROVED RENTAL GROWTH OUTLOOK
- As the chances of a recession have diminished, our macroeconomic outlook has improved with stronger projected GDP growth in particular.
- This has translated into an upward revision of our logistics rental growth forecast (2023-2027) from 2.5% p.a. in our previous Sep-22 base case projections to 3.0% p.a.
- This is supported by the strong underlying drivers of rebounding manufacturing and shipping and increasing e-commerce penetration.
- Logistics remains the most attractive sector in the rental growth outlook (2023-2027), with an average of 3.0% p.a., compared to the all-sector average of 2.1% p.a.
- With new supply of space only exceeding net absorption by a small margin, we expect vacancy rates to stay near record lows.
- The already stiff competition for land for industrial development is likely to worsen going forward, driving logistics rents up.
- The largest rental growth improvement is observed in CEE from 2.8% p.a. to 4.3% p.a., making it the most attractive region for rental growth.
- The Benelux markets rank second with a minor improvement in rental growth to 3.3% p.a. Germany was the only market which recorded a drop in rental growth due to the downward revision in the inflation forecast.
INDUSTRIAL INVESTMENT MARKET
INVESTMENT VOLUMES HAVE SLOWED SIGNIFICANTLY
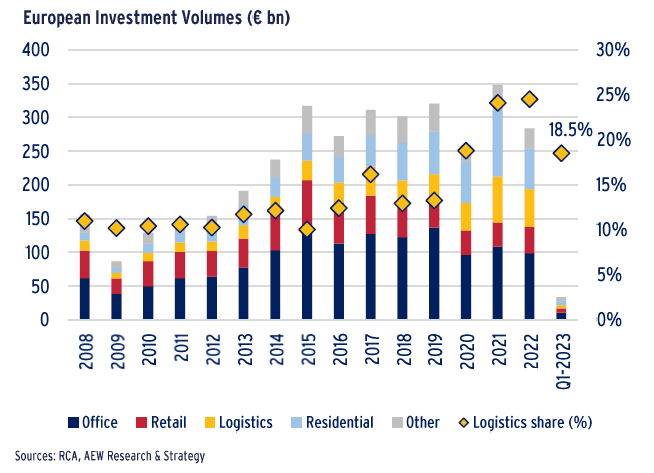
- The deceleration in European logistics investments witnessed during the final months of 2022 slowed more sharply during Q1 2023, with transactions coming to a virtual standstill compared to previous years.
- Logistics investment volumes reached €5.1bn in Q1. This is the lowest quarterly total since the GFC and 57% lower than the 5-year average.
- A primary factor in this deceleration has been tighter monetary policy, as central banks continued to hike interest rates resulting in higher finance costs, negatively impacting investor sentiment.
- Although this affects all real estate sectors, the industrial and logistics sector took the biggest hit. The relatively adverse impact on the sector is reflected in a decline in its share of total investment volumes.
YIELD WIDENING TO REVERSE AFTER 2022-23 REPRICING
- On the back of high inflation and rate hikes, during 2022 and H1 2023 government bond yields widened and reduced excess spread for prime logistics property yields.
- As logistics yields in the slower private markets widened in response to this reduced excess yield spread, the repricing in 2022 and 2023 has been significant.
- The excess spread between the logistics yields and government bond yields is expected to return to more normal levels from 2024.
- Our projections indicate a narrower excess spread than the one investors enjoyed over the 5 years prior to the recent correction.
- In 2017-2021, the average spread stood at around 4.0%, with the expectation that this will stabilize at 2.3% by 2027.
- This change is a further confirmation of the logistics sector as a low-risk sector for institutional investors, as fundamental drivers such as e-commerce drive up demand for logistics space.
- Logistics prime property yields are expected to peak at 5.1% in 2024 and gradually narrow to 4.7% by 2027.
FUTURE LOGISTICS RETURNS UP DUE TO RE-PRICING
- Total returns for logistics markets across Europe are estimated at 8.2% p.a. for the next five years in our Mar-23 base case. This is up 290 bps from our Sep-22 base case as rents improve and yields are projected to tighten.
- CEE and UK markets are expected to produce the highest total returns at 10.2% p.a. and 9.5% p.a., respectively.
- The improvement is consistent across all countries and regions and was primarily driven by the faster-than anticipated yield widening in H2 2022.
- This repricing recalibrates the starting capital values in our calculation. Improved rental growth projections also play a role in better income and capital value growth, with the exception of Germany.
- All of our covered logistics markets are now expected to see some yield narrowing by the end of the 5-year period, as bond yields are expected to peak by year-end before tightening slowly after that.
- In Germany, the yield tightening compensates for the downward revision in rental growth, resulting in overall better returns outlook than previously anticipated, despite being lower than in other regions.
MARKET OUTLOOK – RE-FINANCINGS TO POSE CHALLENGES
REMAINING 2023 REPRICING SMALLEST IN LOGISTICS
- Our latest total return forecasts are driven by a post-2024 rebound of capital values. This implies that there is still some remaining downside in capital values for 2023.
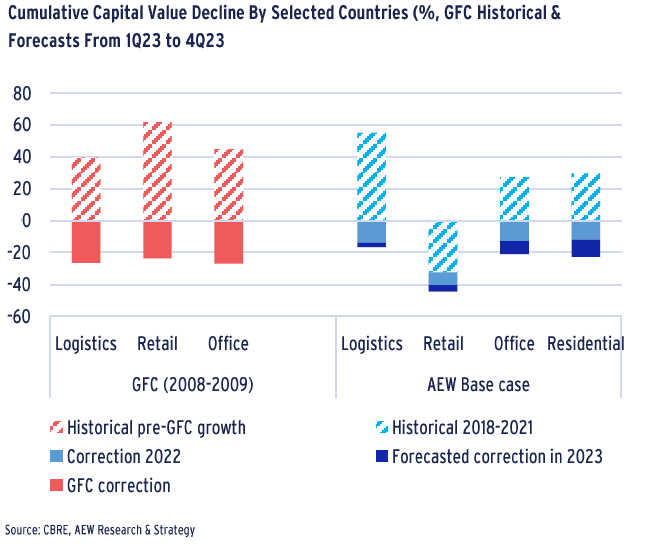
- Cumulative value declines per sector for the current 2022-23 cycle are compared to the GFC actuals in the chart.
- Across all of the sectors, the 2022-23 capital value correction is expected to be of a lesser magnitude than post-GFC.
- In 2022, logistics was the quickest sector to re-price, losing an average of 13.8% of value across all of the European logistics markets.
- For most legacy investors, this loss was offset by the largest value run-up, of any sector, of 55% in four years prior to the correction.
- According to our forecast, logistics capital values have nearly bottomed out with only 2.9% further value decline projected in 2023. This is the lowest remaining correction across all sectors.
- Please note that data availability does not allow for us include residential figures for the GFC period.
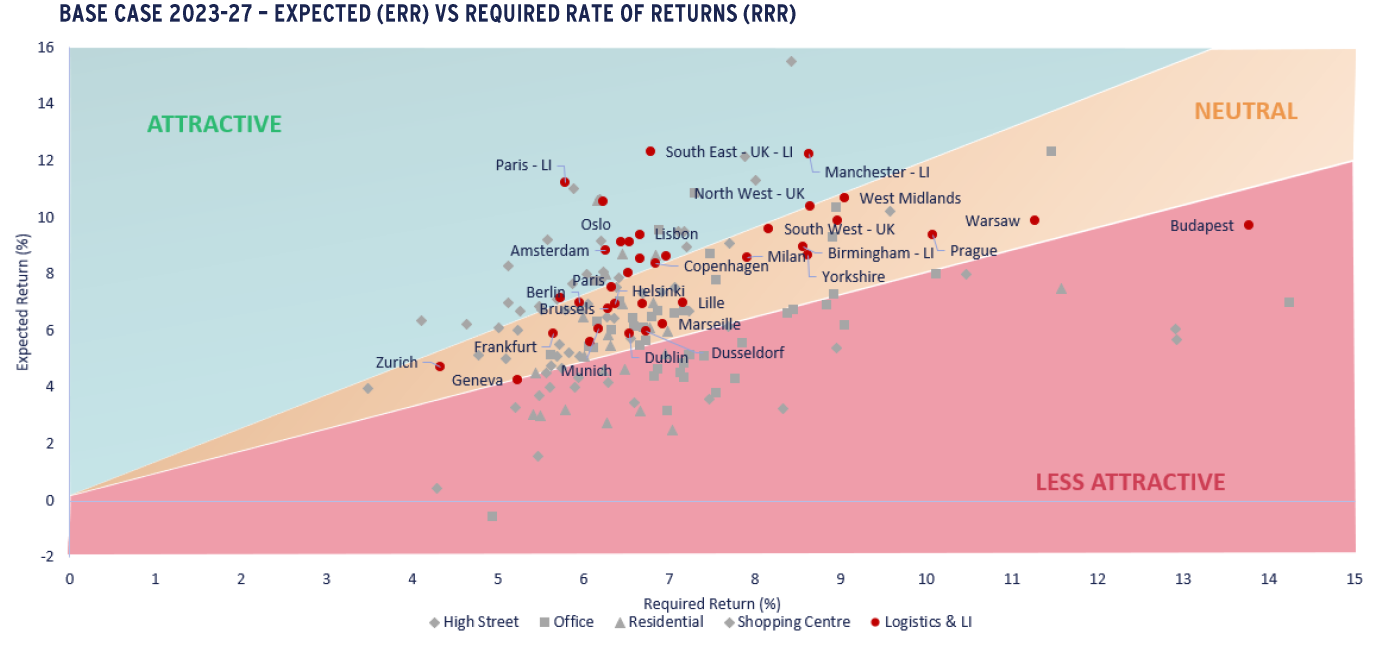
EXPECTED RETURNS OUTPACE REQUIRED RATE OF RETURNS IN LOGISTICS
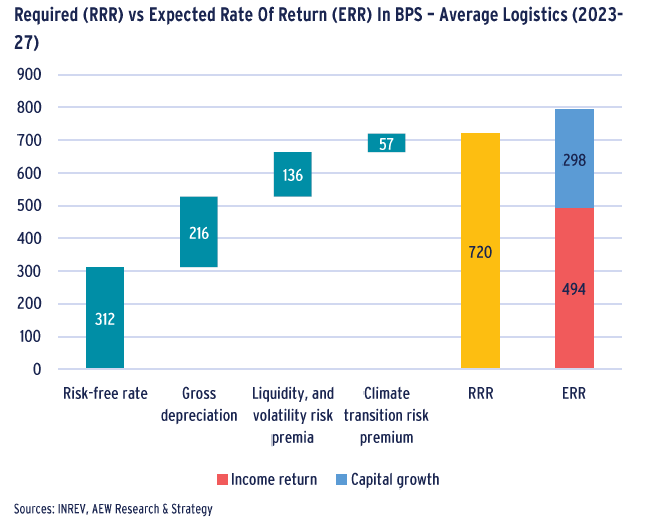
- As a reminder, we note that our risk-adjusted return approach is based on a comparison of the required rate of return (RRR) and the expected rate of return (ERR) over the next five years.
- Our graph shows that the RRR, based on our 33 European logistics markets’ average stands at 720 bps while the ERR is 792 bps.
- This means that the ERR has a positive excess spread of 72 bps over the RRR.
- At 312 bps, the risk-free rate remains the largest component of the RRR, followed by gross depreciation (216 bps), combined liquidity and volatility risk premia (136 bps), and climate transition risk premium (57 bps).
- Based on this analysis, investors are well compensated for risks across European logistics markets.
- As previously, we classify individual markets as attractive, neutral or less attractive by comparing each market’s ERR and RRR.
LOGISTICS IS THE BEST POSITIONED SECTOR
- Our relative value approach classifies markets with ERRs well above RRRs as attractive, and markets with ERRs well below RRRs as less attractive.
- The logistics sector has the highest proportion of attractive and neutral markets of any sector in Europe.
- 33% of logistics markets are classified as attractive, 64% as neutral and 3% as less attractive in our base case scenario.
- This compares favorably to the all other sectors average, where attractive markets stand at 25%, neutral markets at 41% and less attractive markets at 34%.
- The only logistics market that is classified as less attractive is Budapest. This is due to the risk-free rate of 8.4% pushing the RRR to higher levels relative to the other European markets.
RELATIVE VALUE ANALYSIS: INCREASING OPPORTUNITIES IN LOGISTICS
NORDICS AND BENELUX MOST ATTRACTIVE MARKETS
- The Nordics and Benelux regions have the highest proportion of attractive logistics markets; 75% in the Nordics and 66% in Benelux. The remaining markets in these two regions are classified as neutral.
- Half of the Southern European markets are classified as attractive, whilst the other half are considered to be neutral.
- In the UK, France and rest of Europe most of the markets are classified as neutral, with the remainder as attractive.
- Based on the exceptional factors highlighted before, all German markets are classified as neutral.
- CEE is the only region with a single market (Budapest) that is classified as less attractive
- Budapest logistics is expected to produce a high return of 9.7% p.a., but this is not enough to compensate for the risks, as Hungarian government bond yields currently stand at 8.4%.

- The below scatter graph can be interpreted as follows: the RRR for the next five years is represented on the horizontal axis and the ERR is represented on the vertical axis.
- Markets in the green area show ERR sufficiently in excess of the RRR as attractive. The red zone markets are classified as less attractive, given their ERR does not meet the RRR.
- The yellow background indicates a range of 20% of difference between the two, which is deemed an appropriate range where markets are not clearly over- or underpriced. As a result, markets within this middle yellow range are labelled as neutral.
- A majority of the European logistics markets are classified as either attractive or neutral, while only Budapest falling in the less attractive category. 22 of our studied cities are considered neutral whereas 12 are attractive according to the framework.
- On a city level, UK regional logistics and light industrial markets are well represented in the attractive category, followed by Paris light industrial as well as Oslo and Amsterdam logistics.
- Among the neutral or markets with less upside potential, are regional German and French markets along with other southern and northern European markets. These prove to be less sensitive to the upcoming economic rebound than the more mature markets.
This material is intended for information purposes only and does not constitute investment advice or a recommendation. The information and opinions contained in the material have been compiled or arrived at based upon information obtained from sources believed to be reliable, but we do not guarantee its accuracy, completeness or fairness. Opinions expressed reflect prevailing market conditions and are subject to change. Neither this material, nor any of its contents, may be used for any purpose without the consent and knowledge of AEW. There is no assurance that any prediction, projection or forecast will be realized.
Photo Credit: Four