WHICH SECTORS WILL RECOVER FIRST IN THE UPCOMING CYCLE?
As of November 2023, the global focus has shifted firmly to the war in Gaza. A potential further expansion of the conflict to the wider Middle East region, which has some of the world’s largest oil producers, might increase the risk of higher energy prices and a return of elevated inflation. Even as the Ukrainian war has continued, a Europe-wide recession has been avoided and inflation has continued to come down. With elevated interest rates, the economic outlook has remained gloomy. Bond and stock markets had priced amidst a pause in rate hikes. But fears of further hikes have increased due to the potential expansion of the conflict in the Middle East. In times of heightened uncertainty, scenarios can be a useful tool. In our base case scenario, we assume that inflation, bond yields and real estate borrowing costs will come down as highlighted below. The high speed and significant extent of downward valuations already absorbed during 2022-23 triggers the key question for our 2024 European Outlook as “Which markets have sufficiently repriced and will recover first in the upcoming cycle?”
EXECUTIVE SUMMARY: REPRICING TRIGGERS REVIVAL
- Restrictive central bank policies pushed borrowing costs up and inflation down. However, the recent war in the Middle East has worsened geopolitical uncertainty and the need for different scenarios. Our current base case assumes inflation comes down and that a recession is avoided. Our downside scenario assumes that higher inflation will return with a prolonged slowdown. Regardless, drivers of real estate demand like employment and consumer spending remain supportive.
- Commercial real estate debt is expected to become accretive again in the Eurozone from 2025 and in the UK from 2026, based on our base case showing Eurozone inflation and 5-year swap rates to come down sooner than in the UK.
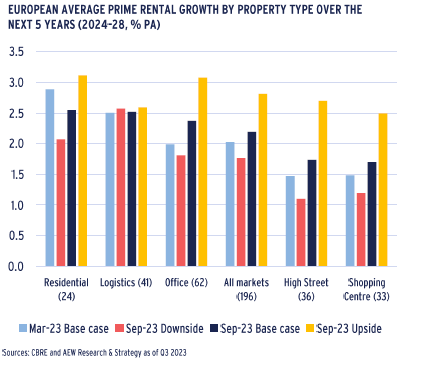
- We make a modest upgrade to our base case prime rental growth across all sectors in Europe from 2.0% (Mar-23) to 2.2% p.a. for 2024-28 due to limited supply of new space, low vacancy rates and positive GDP growth. Prime logistics and residential retain the joint top ranking in terms of rental growth with 2.5% p.a.
- Investor sentiment on offices in Europe seems more negative than warranted by current and projected occupier take-up and the limited new supply of space. Bifurcation between prime and secondary offices is expected to continue.
- 2023 investment volumes are expected to come in at €140bn, down by nearly 50% compared to 2022 as high interest rates locked out traditionally leveraged investors and pushed prime yields out. Given recent re-pricing and our base case lower bond yields, prime yields are forecast to tighten by 20 bps for retail and 60 bps for offices over the next five years.
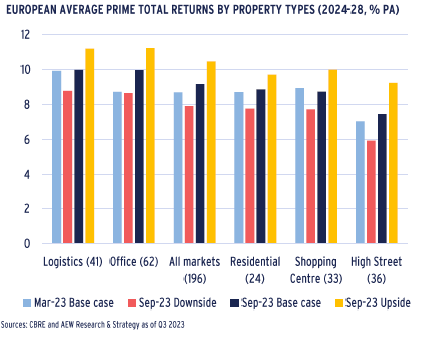
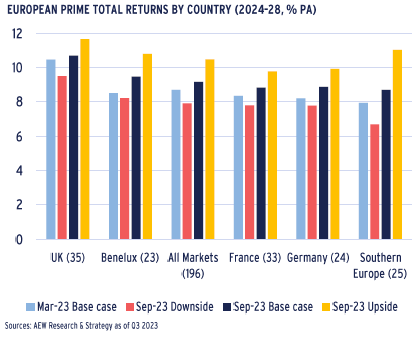
- Prime returns were revised up across all sectors to 9.2% p.a. for 2024-28 in our base case scenario across 196 markets, underpinned by projected yield tightening combined with solid rental growth. Logistics and offices are expected to outperform, generating the highest returns at 10.4% p.a. over the next five years, while retail comes in third at 7.4%. UK ranked top with projected returns at 10.7% p.a. for 2024-28 with Benelux coming second with 9.5% p.a.
- After a cumulative value decline of -17% since the peak in mid-year 2022 to year-end 2023, average prime capital value growth across Europe turns positive at +2% in 2024 despite a few individual markets still showing some downside.
- It is expected that the denominator effect, which restricted many investors during 2023 from expanding their real estate allocation, will reverse in 2024. The highlighted downward adjustment for property combined with the rebound in stocks and bonds over the last year has brought the real estate allocations of multi-asset investors back in line with their targets. This means that we expect more dry powder capital for real estate to be unlocked in 2024.
- Re-financing of legacy loans has been a challenge as interest rates are settling at higher levels and capital values have come down. Our updated 2024-26 debt funding gap (DFG) of €90bn now includes all 20 European countries. Despite including ICR and debt yields refinancing criteria, LTVs remain the dominant restrictive factor. Based on this, 16% of all 2018-21 loan originations are expected to face a relative DFG, down from 22% in our Aug-23 estimate.
- Given that we are shifting our forecast period to 2024-28, therefore excluding 2023 repricing, we show a significant improvement in our relative value assessment which compares the expected rates return 9.1% p.a. (ERR) and 6.9% p.a. required rates of return (RRR) implying an over 200 bps positive excess. With over 97% of our 168 covered European markets classified as neutral (54) or attractive (109) this is a clear signal for investors to return to European markets.
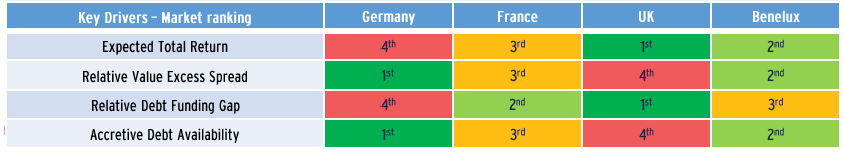
- The below table shows all the key dimensions covered in our 2024 Outlook for our core European markets’ ranking. Germany performs well in terms of relative value and the availability of accretive debt but is challenged with high refinancings and modest absolute returns. The UK on the other hand represents the opposite with top marks for absolute returns and its slow relative level of refinancing problems.
ECONOMIC BACKDROP – ELEVATED RATES EXPECTED TO COME DOWN
NORMALISED EUROZONE INFLATION PUSHES RATES DOWN
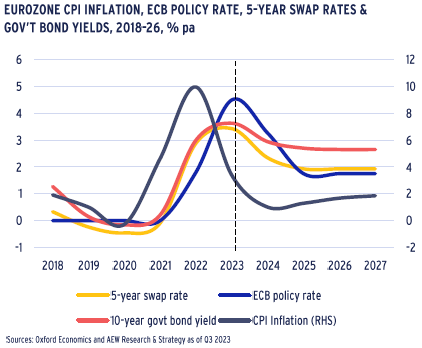
- Headline inflation in the Eurozone fell to below 3.0% y/y in October from the 8.5% February 2023 peak as energy prices have started to come down.
- According to the latest forecast from Oxford Economics (OE), the inflation decline will continue by the end of 2024 inflation is expected to drop to 1%, well below the ECB’s 2% target.
- Given that central bank policy rates are highly correlated to inflation, OE forecast ECB policy rate to settle at 1.75% before year-end 2025.
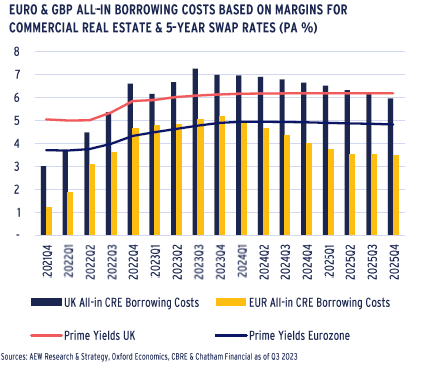
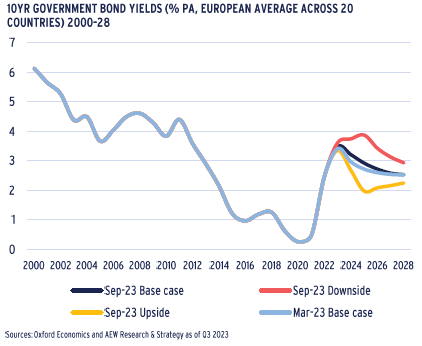
- As shown in the chart, 10-year government bond yields and 5-year swap rates follow these projected declines in inflation and policy rates.
- For real estate investors this means that their costs of borrowing (tied to 5-year Euribor swap rates) is expected to peak in Q1 2024 at just above 3.5% and stabilise below 2% by mid 2025.
- To reflect the current geopolitical uncertainty around oil prices, our downside scenario shows lower economic growth and higher inflation while our upside scenario assumes the opposite.
UK'S NORMALISATION TRAILS EUROZONE
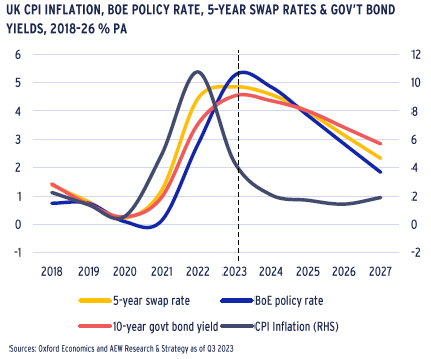
- Headline inflation in the UK fell to below 7.0% y/y in September from the peak of 11.1% in October 2022 and is expected to decrease to 4.4% by year-end.
- This 4.4% is still far from the BoE target of 2%, which will take another year, according to the latest OE’s forecast.
- Given that central bank policy rates are highly correlated with inflation, OE forecast BoE policy rate to reduce to 4.0% before year-end 2025 and below 3.0% before year-end 2026.
- 10-year government bond yields and 5-year swap rates follow these projected declines in inflation and policy rates.
- For UK real estate investors this means that their costs of borrowing (tied to 5-year Sonia swap rates) is expected to peak in Q1 2024 at just above 5% and come back down to below 3.5% by year-end 2026.
- These higher real estate borrowing costs in the UK are in line with historical post-Brexit data.
- The slower reduction of UK inflation and its related rates might be tied to the conservative stance of the BoE as well as some structural damage in bond pricing from the recent UK government’s policy reversals.
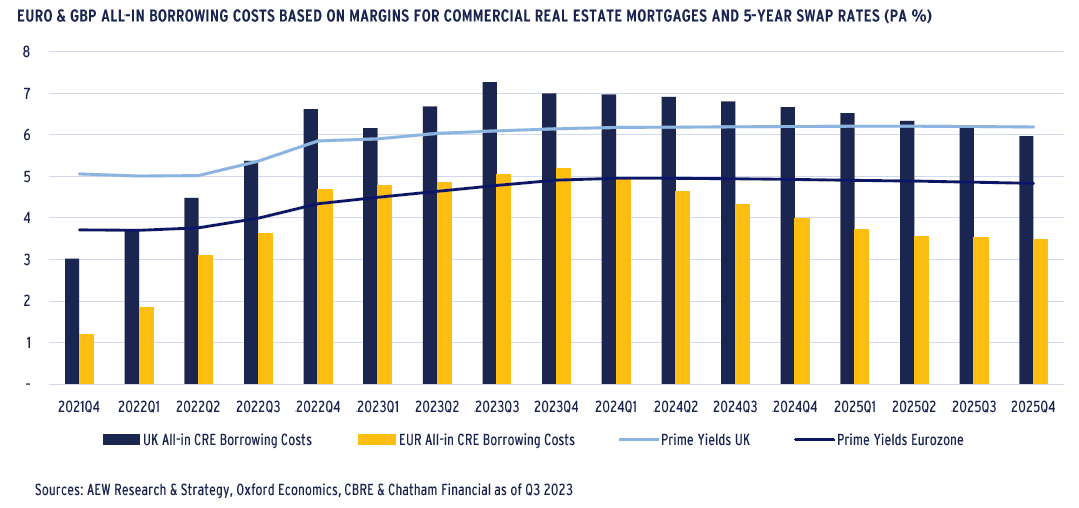
DEBT WILL BE ACCRETIVE AGAIN AFTER 2024
- With both Eurozone and UK 5-year swap rates projected to normalise over the next two years, we can estimate where borrowing costs will move to as well.
- Assuming that loan spreads over swaps will return to their Q2 2022 levels by year-end 2025, we project Eurozone borrowing costs would be just below 3.5% - down from 4.3% in Q3 2023.
- UK all-in borrowing costs would remain 250 bps higher at 6.0% by year-end 2025. This is due to UK 5-year swap rates forecasts to be nearly 200 bps above the Eurozone’s and margins remaining over 50 bps higher.
- Despite a slower normalisation in the UK, borrowing costs are expected to come down over the next two years and they are not projected to return to historic pre-Covid low levels.
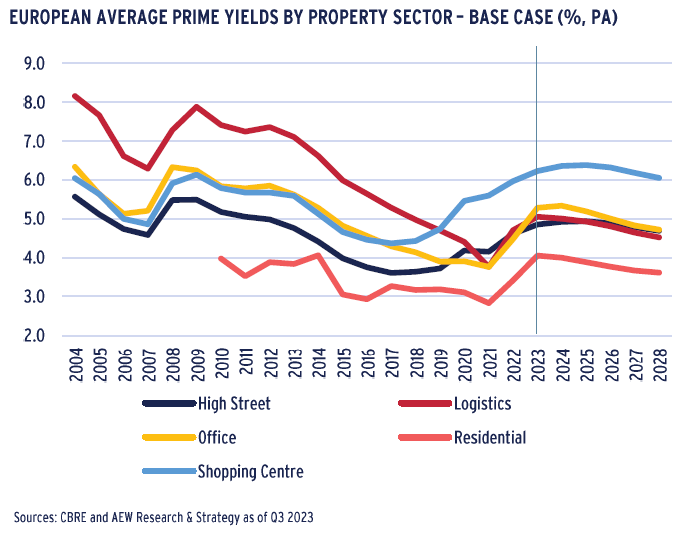
- Cross-sector prime yields in the Eurozone and UK forecasted to be at 4.8% and 6.2% by year-end 2025.
- Therefore, we expect a return of accretive debt by year-end 2024 in the Eurozone and later as well as to a lesser extent in the UK.
- In the meantime, we expect investors to limit any legacy capital value losses, working out debt refinancing and deploying any available equity capital without new non-accretive debt.
ECONOMIC BACKDROP – MODEST GDP GROWTH DESPITE UNCERTAINTIES
ELEVATED BOND YIELD TO COME BACK IN
- Average government bond yields across our 20 European countries have increased by 300bps and are expected to peak at 3.5% by year-end 2023 on the back of high inflation and central bank rate hikes.
- Coincidentally, this means 3.5% is a return to the pre-pandemic 20-year average of 3.4%.
- Similar to our Mar-23 base case, government bond yields are expected to gradually decline to 2.5% by 2028.
- In times of war and increasing geopolitical and economic risks, our upside and downside scenarios prove useful and remain based on actual volatilities of historical forecasts.
- In the downside scenario, government bond yields are expected to peak at 3.9% bps in 2025. In the upside scenario, the peak is expected at 3.3% in year-end 2023.
GDP GROWTH REMAINS POSITIVE ALBEIT MODEST
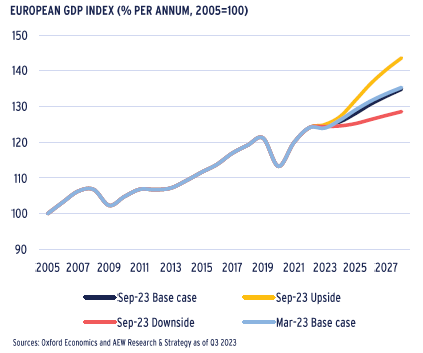
- OE’s latest base case scenario forecasts for European 2023 GDP growth comes in at 0.5% year-on-year, an improvement from the -0.1% projected earlier this year.
- This upgrade for 2023 is offset by a downgrade for 2024 GDP growth to 0.9% p.a., down from their previous Mar-23 forecast of 1.8%.
- The UK, Germany and France are projected to have economic growth of below 0.6% in 2024.
- Restrictive monetary policies through higher interest rates and quantitative tightening are successfully reducing inflation and are expected to bring bond yields down in 2024.
- Our downside scenario reflects a further slowing of economic growth and an increase in inflation on the back of increased geopolitical uncertainty.
- Our upside scenario assumes that the wars in Ukraine and the Middle East are resolved, and that inflation drops below central banks’ target levels by the end of 2023.
LOW UNEMPLOYMENT TO DRIVE CONSUMER SPENDING
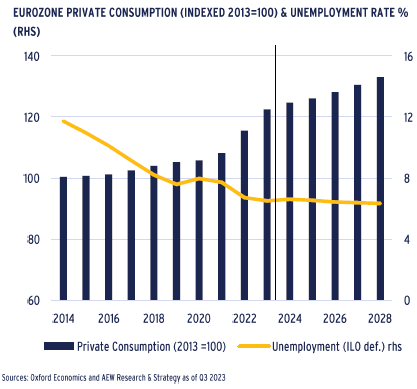
- Unemployment levels are still projected to remain low over the next five years to around 6.5%, even if the 1.4% p.a. GDP growth expected over the next five years across the Eurozone looks unexciting.
- Despite the recent pick-up in the unemployment rate to 6.5% in October, this remains a remarkable reduction from the 12% recorded in 2014, even if it is partially explained by reduced participation rates and low population growth.
- In this context of tight labour market and high inflation, wage growth has been trending upwards.
- As a result, private consumption across the Eurozone is estimated to grow by 1.7% p.a. over the next five years.
- As employment is a strong intermediate driver of demand for offices, this provides a solid base for the occupier markets.
- For retail and logistics, consumer spending growth is projected to outstrip GDP growth – even if some of it is diverted to e-commerce and does not directly translate into more demand for retail space.
MARKET OVERVIEW – LOGISTICS & OFFICES: SENTIMENT TYPICALLY OVERSHOOTS
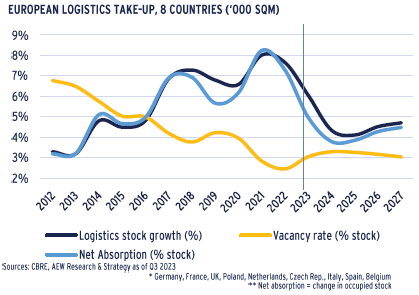
LOGISTICS VACANCY TO INCREASE MODERATELY
- As demand for logistics space increased, the development of new supply has accelerated over the last five years.
- Going forward, we expect a stabilisation of both demand and supply at relatively balanced levels.
- As big-box units typically require significant capital expenditure from occupiers for fit-out costs, some tenants may opt to maintain their current footprints rather than seeking larger spaces.
- There might also be some downside to new supply. This is because apart from increasing construction costs, the shortage of land for industrial development is likely to increase.
- The average logistics vacancy rate in Europe is projected to slightly increase to 3.3% by 2024 as net absorption is expected to balance the more limited level of future completions.
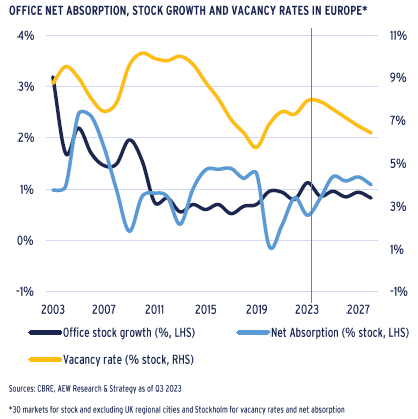
OFFICE ABSORPTION AHEAD OF NEW SUPPLY
- Based on the latest CBRE projections, net absorption will be ahead of new additions to office stock from 2024 onwards in Europe overall.
- This means that average vacancy rate across our 30 covered office markets is expected to peak at 7.9% in late 2023 or early 2024 and come down to 6.4% by 2027.
- Occupiers’ ability to downsize will depend to a large extent on whether they can manage their workers’ usage peaks between working days as well as whether they implement hot desking.
- Since many occupiers have been focused on securing high-quality office space in the best locations, prime rental growth should prove resilient amid undersupplied core office markets.
- This shifting preference for higher quality assets leads investors to reassess the risks of obsolescence of secondary offices as well as speed of leasing, rent level and ESG-related capex.
- However, actual office occupancy rates are still not back to pre-Covid levels, pointing to a lasting reduction of office space requirements.
- Overall, we think investors’ concerns about the European prime office occupier market remains overblown as the news flow is dominated by negatively-impacted US markets and submarkets.
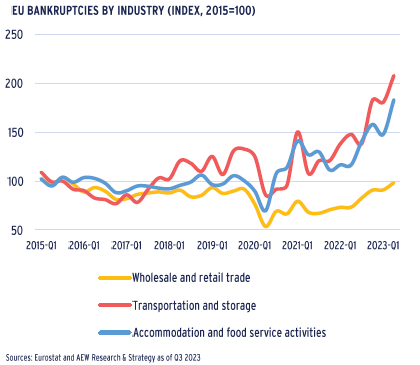
POST-COVID BANKRUPTCIES TICK UP
- Another challenge that might be overstated by investors could be the increase in tenant defaults.
- Eurostat data shows that EU bankruptcies in accommodation & food services increased by 57% in the last four quarters.
- Transportation and storage failures also rose by 41% over the same period, which may pose some problems for the logistics property sector.
- However, wholesale and retail trade bankruptcies are more modest and in line with pre-Covid levels.
- Increased business failures are linked to the mandatory repayment of companies’ state-backed Covid loans, the rise in energy prices and interest rates.
- Separate data from Weil implies firms’ financial stress remains well below GFC levels.
- Investors should be protected from income losses, even if tenants default or their credit quality suffers, as active asset managers should be able to easily replace tenants, especially if market vacancy levels remains low.
MARKET OVERVIEW – HIGHEST RENTAL GROWTH FOR RESIDENTIAL & LOGISTICS
IN-STORE SALES TO STABILISE IN EUROPE & UK
- Total retail sales volumes in the UK remained relatively flat in 2022, growing only by 1.3% relative to pre-pandemic levels of 2019, whilst European real retail sales grew by 5% over the same period.
- The emergence of e-commerce initiated a decline in the share of in-store sales, and naturally this trend was further accelerated by the Covid pandemic and related lockdowns.
- After experiencing a decline of 7% in the UK and of 1% in Europe by 2022 compared to the pre-pandemic levels of 2019, the absolute volumes of in-store sales have stabilised and are expected to remain relatively unchanged over the next five years.
- However, future growth in total retail sales will be primarily attributed to the increase in online sales, expected to rise by 33% in the UK and 54% in Europe by 2027 from 2022 levels.
- These challenges have already been reflected in a significant reduction in retail rents, especially in shopping centres.

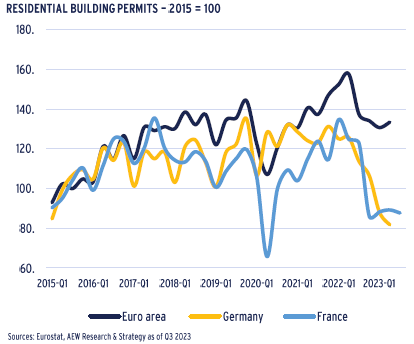
LOW PERMIT TO LIMIT FUTURE RESIDENTIAL SUPPLY
- Similar to the logistics sector, supply of new residential dwellings has been limited and is not expected to recover in the short-term.
- Rental housing markets across Europe, especially in supply constrained cities are expected to become even tighter than before, which is expected to drive market rental growth.
- The number of residential building permits filed in the EU27 – a leading indicator of future developments - started to stabilise in H1 2023 after a significant decline in 2022.
- Despite recent reductions in some material costs, developers’ profitability remains challenged by both elevated labor and finance costs, these limited permits might not even translate into actual new residential developments delivered.
- As the chart shows, the number of residential building permits filed are significantly down in Germany and France – even if the latter shows stabilisation at a low level in 2023.
LIMITED SUPPLY & MODEST GROWTH LIFTS PRIME RENTS
- Limited supply of new space, low vacancy rates and positive GDP growth drive a modest upgrade in our base case prime rental growth forecast, from 2.0% in our March 2023 base case to 2.2% p.a. for 2024-28.
- Residential and logistics retain top spots in our latest prime rental growth outlook, both with an average 2.5% rental growth p.a..
- Prime rental growth across all sectors ranges between a solid 1.8% and 2.8% p.a. for our three current macro scenarios.
- Shopping centres and high street retail are expected to have below average 2024-28 annual rental growth of 1.7% p.a. for both.
- Since our forecasts focus on prime rents only, we note that rents for secondary assets are under more pressure.
- Apart from many occupiers preferring modern space in energy efficient buildings, investors are increasingly aware of the weak or negative rental outlook expected for non-prime assets.
MARKET OUTLOOK – BID-ASK SPREADS DAMPENED INVESTMENT ACTIVITY
HIGHER RATES & BID-ASK SPREADS REDUCE LIQUIDITY
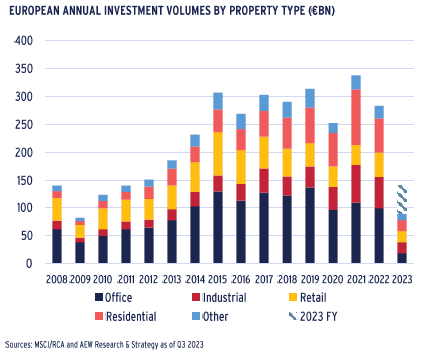
- Year-to-date 2023 transaction volumes stand at €91bn, less than a third of the 2022 full year volumes.
- Regardless of the weakness in year-to-date volumes, taking into account the traditional strength of the fourth quarter, we estimate that full year 2023 volumes will come in at €140bn.
- This is about half of the 2022 volumes of €282bn and about one third of 2021 €350bn record volumes.
- Bid-ask spreads remain high, especially for offices. Repricing has been faster than expected, as transactions proceed at lower prices than many sellers’ original reserve prices.
- In 2023, many investors re-assessed their real estate allocations in light of changes in relative valuations across all other assets classes. But there is likely to be a change on how that effect will play out in 2024, which we will discuss a bit later.
- Motivated (and distressed) sales are likely to increase as banks recover their loan principal amounts. Sellers might include retail funds facing redemptions and/or refinancing challenges.
PRIME YIELDS TO TIGHTEN AFTER 2024
- Higher swap and interest rates pushed prime property yields up in both 2022 and 2023 by more than initially anticipated.
- Office prime yields widened the most of any sector by 150 bps on average over the past two years, followed closely by logistics and residential at 130 bps and 120 bps, respectively.
- Prime shopping centre yields are projected to widen a bit more in 2024 for a cumulative widening of 200 bps since 2018 with prime high street retail expected to experience a 130 bps expansion by 2024.
- On the back of recent re-pricing and our base case projection for lower government bond yields, we expect prime yields to move in by 20 to 60 bps across all sectors over the next five years.
- In fact, prime office yields are forecast to tighten by 60 bps over the next five years from year-end 2023, followed again by logistics and residential at 50 bps and 40 bps, respectively.
LOWER YIELDS TO TIGHTEN AFTER 2024
- Projected yield tightening combined with solid rental growth drives our prime returns up across all sectors to 9.2% p.a. for the 2024-28 period – up from 8.7% p.a. for the same years in our base case from Mar-23.
- Logistics markets are projected to have the highest returns at 10% p.a. over the next five years due to their rapid re-pricing in 2022-23 and continued solid rental growth projected.
- Surprisingly, prime offices come in second place with returns of 10% p.a. on the back of their more significant re-pricing, high current yields and improved rental growth projections.
- Even high street retail is projected to see 7.4% p.a. total returns, as our projection period no longer includes the poor 2023 performance.
- Given the current increase in geopolitical uncertainty, we should consider that our latest downside scenario shows returns at 7.9% p.a. on average across all sectors while our upside scenario indicates 10.5%.
- The exclusion of 2023 from our forecast period has a strong impact on total returns, indicating an attractive vintage of acquisitions for 2024.
MARKET OUTLOOK – REBOUND IS COMING, EVEN IF IT FEELS TOO EARLY
9-11% RETURN RANGE AS UK RANKS TOP
- The average total return across all markets, as mentioned before, is projected at 9.2% p.a. for the 2024-28 period.
- UK markets are projected to deliver the highest average total return of 10.7% p.a., which is driven by a stronger than in other countries forecasted yield compression.
- Benelux markets are ranked second with a forecast return of 9.5% p.a., largely driven by a strong forecasted yield compression. Indeed, other countries’ yield compressions are not forecasted to be as strong.
- Despite a strong rental growth forecast, Southern European markets are projected to only have a modest average yield compression, causing them to lag behind, albeit with a solid return of 8.7% p.a.
- Southern European markets also show a larger difference between the upside and downside scenarios as these markets have historically been more volatile during cycle turns.
- Just to emphasise again, the exclusion of 2023 from our forecast period has a notable impact on total returns, implying that investors that can be pro-active in 2024 should do well over the five-year period.
READY OR NOT, REBOUND EXPECTED FOR 2024-25
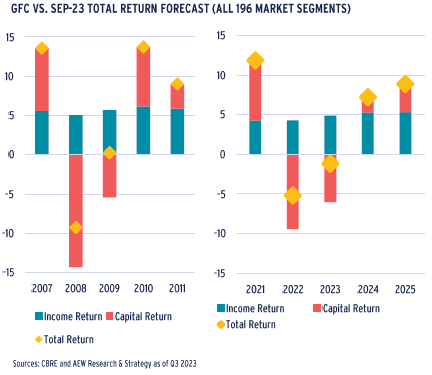
- The above price changes can be further contextualized by a comparison of total returns during the GFC and our base case return projections for the 2021-25 period.
- Capital value declines in the current cycle are projected to be at 17% cumulatively -- in line with recent price data.
- Our projections for the current cycle show a similar pattern to GFC with stable income returns and a dramatic first year of value adjustment followed by a modest correction in the second year.
- As many in our industry are still dealing with the negative repercussions of these ongoing value declines, it might feel too early for the capital values to rebound in 2024.
- However, cycles do have a tendency to turn. Post-GFC, 2010 recorded a much stronger value rebound than expected by most.
- Our latest base case projections indicate a similar rebound pattern for 2024 and 2025, albeit less exuberant than in 2010.
- Precisely timing the cycle might prove more difficult than usual as bid-ask spreads remain large, indicating a lack of consensus on the underlying value of the assets.
CAPITAL VALUES ARE STILL ADJUSTING IN 2024
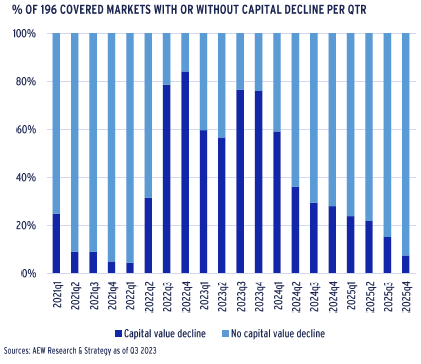
- Even if across all European markets we project a modest 2% capital value growth for the full year 2024, our forecasts still show some painful value adjustments for 2024.
- Average capital growth of 2% projected for 2024 masks fact that the markets are still going through capital value adjustment.
- In fact, over half of the 196 markets (116) are still expected to post a capital value decline in Q1 2024.
- In Q2 2024 most of the markets would have already reached the bottom, and more than 90% of them (181 market) will be past that point by the end of 2025.
- This variation reflects structural differences between European markets, where common macro themes are not completely synchronized, and the speed of valuation adjustments vary.
- Looking at the number of markets with continuous value declines is a limited metric as the magnitude of the declines also matters. This is especially relevant as our forecasts tend to be smooth and revert to the long term mean.
- We investigate the extent of the forecasted declines next.
MARKET OUTLOOK – REVERSAL OF DENOMINATOR EFECT TO UNLOCK DRY POWDER IN 2024
VALUE INCREASES OVERRULE DECLINES FROM Q2 2024
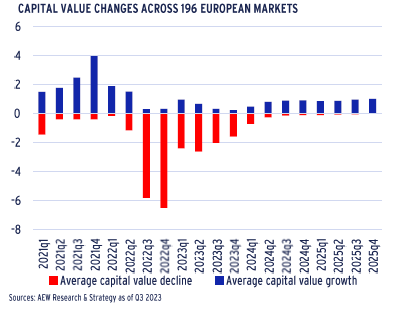
- In respect of the extent of capital value declines, we note that since Q3 2022 to year-end 2023 we expect a cumulative adjustment of 19% across our markets.
- Over the same period, we also saw markets with capital appreciation, but this came at a modest 3%.
- If we look across all of 2024, we project a 1.9% increase which is consistent with our earlier chart. However in Q1 2024, there is a net decline of 0.2%, although capital value growth offsets this over the rest of the year.
- From Q2 2024, the extent of the net value increases steps up and outrank declines by 50 bps.
- As highlighted previously, our forecasts are created with traditional econometric models, so they tend to smooth away any volatility in the forecast period.
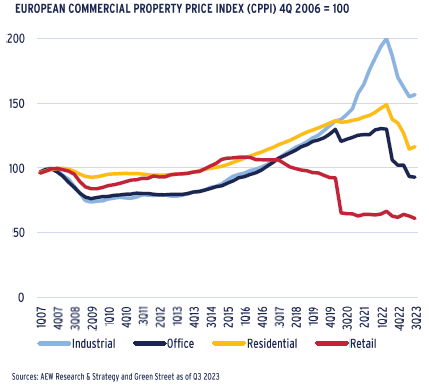
PRICE DECLINES START TO REVERSE IN SOME SECTORS
- As shown in the chart, prices for European real estate have come down significantly since interest rates increased from Q2 2022.
- The speed and extent of these declines has varied widely across sectors, as the latest data from Green Street shows.
- Both industrial (or logistics) and residential assets showed a decline of over 20% decline in the four quarters from Q3 2022 to Q3 2023, but both sectors are expected to show a modest rebound in Q4 2023.
- Offices are estimated to show an even larger decline of over 30% in prices over the same period, as concerns on working from home’s impact on demand for space has hit investors’ sentiment.
- Retail sector showed a value decline of just over 10% in the same period. But it has posted a cumulative price decline of over 50% since Q2 2016, as e-commerce penetration hit demand for retail space, and retail closures during the pandemic further hit the sector.
- These price changes are filtering into valuations and prime capital values from CBRE and other brokers. Fund management teams are actively working to limit the damage for both investors and lenders.
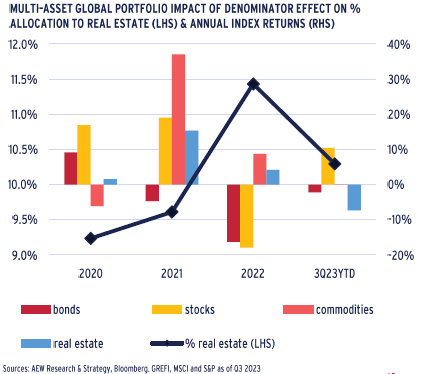
REVERSED DENOMINATOR EFFECT UNLOCKS DRY POWDER
- After speaking with multi-asset investors, it has become clear that the denominator effect, i.e. the share of real estate in a broad mixed-asset portfolio, was limiting their real estate allocations in 2023.
- To better understand this effect, we show global multi-asset investors starting with a theoretical allocation of 40/40/10/10 across stocks, bonds, real estate and commodities as of year-end 2019.
- Due to the index performance of the various asset classes the weight of real estate increases to 11.5% - well above its 10% assumed average target by year-end 2022 – creating a barrier for additional real estate investments during 2023.
- The 11.5% is mostly due to 2022 when we had the negative returns for both stocks and bonds, reducing the share of real estate.
- Based on year-to-date total return indices, real estate is expected to post negative returns while stock returns are recovering, bringing real estate back in line with its target 10% allocation.
- It could be a positive tailwind for 2024 as this reversal should unlock committed dry powder capital, which investors were wary to fund in 2023 due to being over their 10% target real estate allocation.
DEBT FUNDING GAP – RE-FINANCINGS TO POSE CHALLENGES
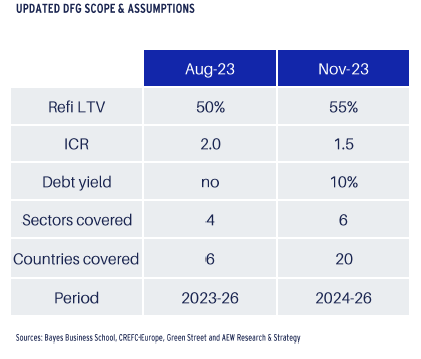
NEW DATA & FEEDBACK DRIVES DEBT FUNDING GAP UPDATE
- Based on new industry feedback and data available from various sources, we updated our debt funding gap (DFG) analysis.
- Our coverage is also expanded to include all 20 forecasted European countries and two more sectors (hotels & senior housing).
- Based on in-house data and the latest Bayes and CREFC-Europe surveys we revise our refinancing LTV from 50% to 55%.
- Having previously tested the ICR at 2.0, industry feedback and data from Green Street indicated an ICR of 1.5 would be more appropriate. For the first time we also tested a 10% debt yield as a potential refi debt limit.
- As 2023 is almost over, we need to deal with 2018 vintage loans maturing in 2023. For 2018 loan vintages we assume that 50% of loans maturing in 2023 DFG has in fact refinanced and the remaining 50% of 2018 vintage loans are extended by 1-3 years and added to the 2024-26 DFG.
- As before our overall results classify the DFG for six key sectors and three vintages from 2019 to 2021.
PAN-EUROPEAN DFG AT €90BN
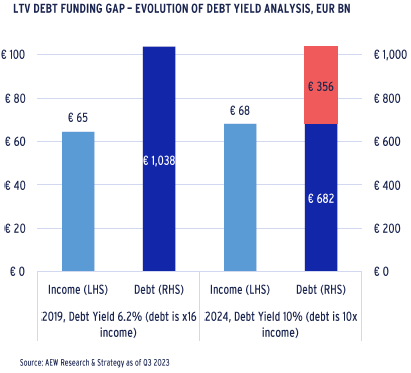
- Our step-by-step DFG methodology is illustrated by the 2019 vintage of Austrian residential loans’ restrictive debt yield impact:
- 60% average LTV is assumed for all €1.7bn Austrian residential acquisitions closed in 2019 results in debt of €1.0bn
- Given the 2019 income yield of 3.7%, income is estimated at €65mn, which implies a 6.2% debt yield at loan origination in 2019.
- Our latest prime rent forecasts for Austrian residential show a +6% increase between 2019 and 2024, which lifts the income to €68mn.
- New debt volume is estimated at a 10% debt yield of this new income or €682mn, a debt yield related shortfall of €356mn.
- Based on our assumed refi ICR and LTVs there are no additional gaps for this vintage segment but only a debt yield-linked gap, requiring additional equity (or debt).
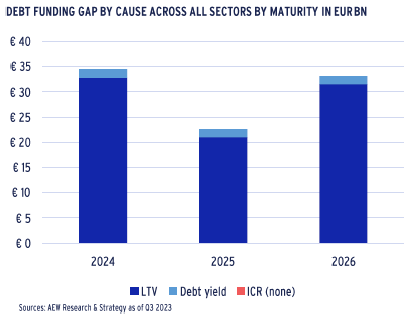
- On top of the debt-yield driven DFG, we also use LTV and ICR restrictions, with the overall DFG estimated at €90.3bn across our expanded scope of four vintages, six sectors and 20 countries.
HIGHER REFI LTV REMAINS THE DOMINANT DFG TRIGGER
- Explaining just under 95% of our new €90.3bn DFG, the refinance LTV remains the dominant restrictive factor of available debt quantum at loan maturity when compared to debt yields (at 10%) accounting for 5% of DFG and ICR (at 1.5x) for none of the DFG.
- This was a bit unexpected as industry feedback indicated that ICR and debt yields were a major factor for lenders.
- It should be noted that our ICR and debt yield analyses required us to estimate income yields and debt costs for some segments.
- Both our ICR and debt yield thresholds (1.5x and 10%) were confirmed with external sources, including Green Street.
- The allocation of the DFG across vintages shows a much lower figure for 2025, which is likely caused by the 2020 loan originations being impacted by the Covid pandemic.
DEBT FUNDING GAP RE-FINANCINGS TO POSE CHALLENGES
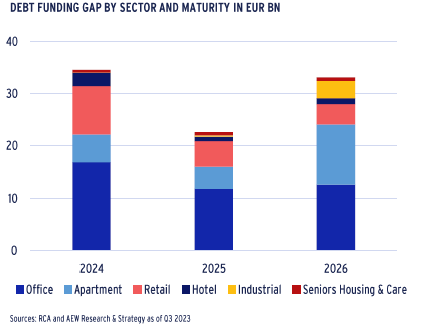
OFFICES IS THE LARGEST SECTOR FOR DFG
- Offices account for over 45% of our new €90.3bn DFG, followed by apartments at 23% and retail with 20% of the total. Hotels, logistics and senior housing make up the remaining 11% of the DFG.
- The dominance of offices in our DFG was not a surprise since our previous estimates also had offices as the largest sector.
- This mostly due to larger overall office transaction volumes and wider relative yield widening in offices compared to other sectors.
- The residential sector is estimated to have the second largest DFG in absolute volumes at €21bn, mostly a reflection of the high transaction volumes and the low acquisition yields.
- This has made the debt yield threshold more restrictive than the refinancing LTV for residential versus other sectors.
- There is also a decrease in our estimated 2025 DFG corresponding to the 2020 origination vintage. 2020 collateral values were widely affected by the pandemic creating a temporary value bottom that was followed by strong capital growth in 2021 and first half of 2022.
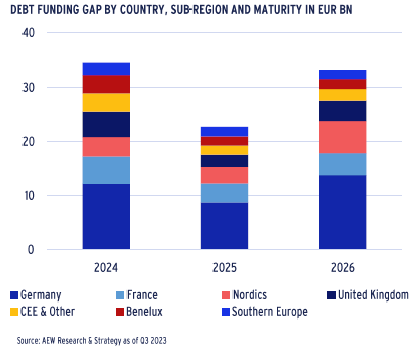
GERMANY TO FACE BIGGEST DFG CHALLENGE
- At 38% Germany’s DFG is the largest country contributing to our new pan-European €90.3bn DFG, followed by France at 14%, the Nordics at 14% and the UK at 12%.
- The relatively large DFG for Germany and small DFG share for the UK and Southern Europe were in line with our previous estimates.
- German banks’ low cost covered bond funding allowed the extension of accretive credit even when property yields reached historic lows. Yield widening from these low levels damaged LTVs more than elsewhere.
- UK bank regulations became very strict post-GFC as the BoE introduced its slotting rules requiring large capital reserves against real estate loans especially speculative development loans.
- Southern European banks took a longer time working out their legacy loans through write downs and NPL portfolio sales. This prevented them from re-entering the CRE lending market in size.
- Nordic investors, especially Swedish REITs, overleveraged and share prices pushed capital values down more than predicted.
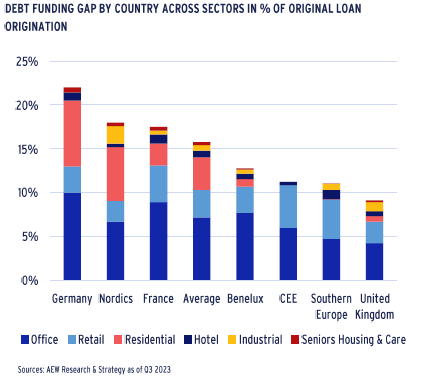
GERMANY HAS THE LARGEST DFG AS % OF LOAN ORIGINATIONS
- Even if the absolute DFG is indicative of the potential EUR refinancing problem, it is useful to place it in a relative context.
- This can most easily be done by taking each country’s DFG as a share of its total originated loan volumes and than rank each country by the relative severity of the refinancing problem.
- The €35bn DFG in Germany represents 22% of all loan originations from the 2018-21 period, the highest share of loans affected across our 20 countries covered.
- The average share across these 20 European countries stands at 16%, down from 21% in our Aug-23 analyses. This is mostly due to our higher refi LTV at 55% and the assumed partial resolution of the 2018 vintage maturing in 2023.
- The 16% pan-European average indicated that one-sixth of originated loan volumes cannot refinance when the loans come due in the next three years.
- Consistent with previous analyses, the UK’s relative DFG stands at only 9%. This should allow UK banks to resolve these issues sooner and for the property market to rebound perhaps ahead of other European markets.
RELATIVE VALUE ANALYSIS: NEARLY ALL EUROPEAN MARKETS ATTRACTIVE
OVER 200 BPS OF RELVAL EXCESS SPREAD FOR 2024-28
- Our risk-adjusted return approach is based on a comparison of the required rate of return (RRR) and the expected rate of return (ERR) over the next five years. Leaving 2023 behind makes a big difference.
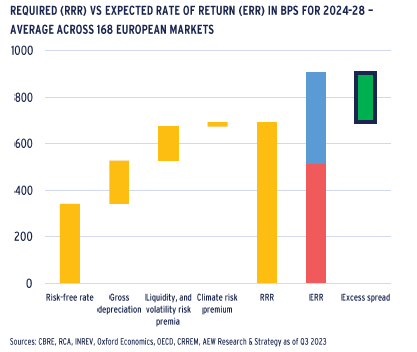
- As the graph shows, our 168 European markets’ average RRR is at 693bps, while our ERR for the 2024-28 stands at 907bps.
- This means that the ERR has a significant positive excess spread of 213 bps over the RRR.
- Our risk-free rate of 341 bps remains the largest component of the RRR and has stepped up from 309 bps, reflecting the recent increases in the bond yields.
- On the back of this analyses, we believe that investors will be well compensated for their risks across European real estate markets.
- Separately, our analysis classifies each market as attractive, neutral or less attractive by comparing its ERR and RRR.
LEAVING 2023 BEHIND MAKES ALL OF THE DIFFERENCE
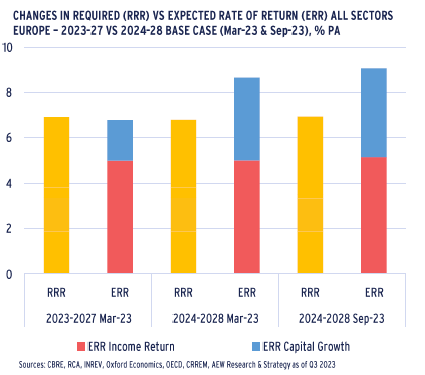
- Our positive relative value outlook for 2024-28 should not come as a surprise, as we highlighted it in our Mar-23 mid-year outlook.
- With the cumulative repricing absorbed in both 2022 and 2023, shifting our perspective into 2024 and leaving 2023 behind account for most of the difference.
- In Mar-23 the ERR for 2023-27 was still broadly in equilibrium with the RRR, which means that the investors would be compensated sufficiently for the risks taken.
- As anticipated, the average attractiveness has improved when we consider 2024-28 implying a rebound in capital values.
- Expected rate of return is projected to increase to 9.1% p.a. thanks to a 390 bps increase in capital growth, slightly up from 360 bps in our Mar-23 base case for the 2024-28 period.
- Our latest results show consistency with our mid-year review and allow us to re-classify more markets as attractive for new acquisition in 2024, as should be the case in a cyclical rebound.
MOST MARKETS ATTRACTIVE & GERMANY RETAINS TOP
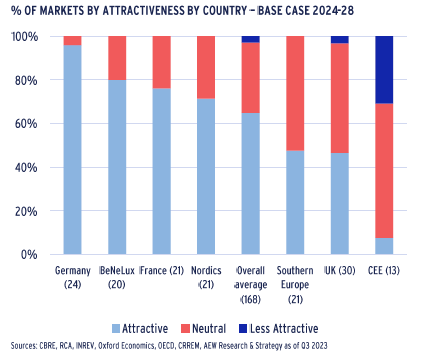
- In the current base case scenario, investors should meet or exceed the RRR in over 97% of markets, up from 70% in Mar-23.
- This time 109 are classified as attractive (up from 45), 54 markets as neutral (down from 77), and only 5 as less attractive (down from 46), highlighting the significance of the change in the classification.
- Germany retains our top relative value pick based on this measure, as it has 23 attractive markets and only one neutral market.
- The UK, on the other hand, has fallen behind mostly due to its higher RRR as UK bond yields are projected to stay higher for longer.
- Benelux, France and the Nordics all show more attractive markets than European average while Southern Europe and CEE continue to trail the European average.
- Only 3% of our markets remain classified as less attractive. Therefore, it should be much easier to source attractive individual deals, especially for managers that have new capital.
RELATIVE VALUE ANALYSIS: FULL STEAM AHEAD ACROSS THE BOARD
STRONG RESILIENCE EVEN IN DOWNSIDE SCENARIO
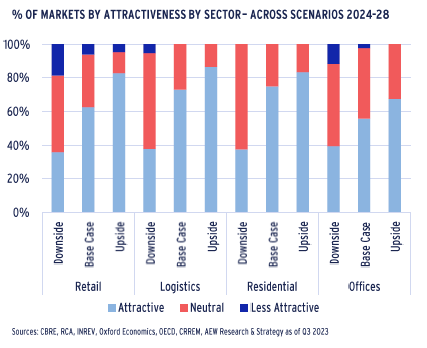
- When we next consider sectors in our relative value framework, we note that in our base case residential and logistics markets again come out very strong with all markets in attractive or neutral classification.
- Offices and retail are not that far behind with one and four fewer attractive markets, respectively.
- As highlighted before, given the increased level of uncertainty tied to the Gaza war, it should be useful to consider our downside scenario, which assumes higher inflation and lower growth.
- However, even in our Sep-23 downside scenario, nearly 90% of our markets are classified as attractive or neutral where investors should meet or exceed the RRR.
- It is hard to image a clearer signal for investors to become pro-active in 2024 even when we consider the impact of a downside scenario tied to an extended war in the Middle East.
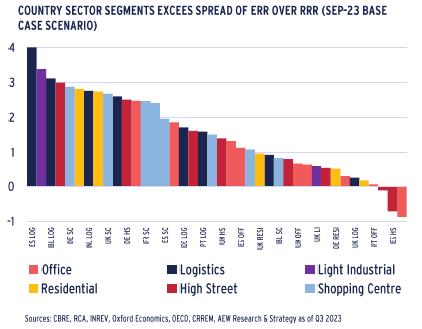
LOGISTICS SHOWS STRONGEST CORE RELVAL
- Across core Europe, the strongest positive signals (based on the excess spread of ERR over RRR) is indicated for logistics and light industrial markets in Spain, Benelux and France.
- Dutch and Spanish residential, Belgian high street retail as well as German and UK shopping centres also make it to the top 10 most attractive relative value market segments.
- Most office markets are ranked in the lower tier of the excess spread ranking with the notable exception of Dutch and German offices in 12th and 16th position.
- Shopping centers in France, Netherlands, Spain and Portugal are also ranked in the top 20 out of a total 40 country-sector segments ranked.
- The three segments still showing a negative excess spread are Italian offices and high street retail as well as Spanish high street retail.
UK SOLID EXCESS RETURNS BUT BELOW AVERAGE
- One of the more surprising results in our latest relative value analysis is how the UK has slipped from a joint first position to trail many other core European markets.
- Apart from the UK’s higher bond yields which push up its RRR, the fact that other European markets’ repricing has now caught up with the UK are the main drivers for this change in relative position.
- However, UK markets are still projected to have some of the best returns in European and all UK sectors are showing solid positive relative value excess spreads.
- Across the UK, shopping centres are by far the most attractive sector on a relative value basis, while logistics is the least attractive – an outlier in the pan-European context.

This material is intended for information purposes only and does not constitute investment advice or a recommendation. The information and opinions contained in the material have been compiled or arrived at based upon information obtained from sources believed to be reliable, but we do not guarantee its accuracy, completeness or fairness. Opinions expressed reflect prevailing market conditions and are subject to change. Neither this material, nor any of its contents, may be used for any purpose without the consent and knowledge of AEW. There is no assurance that any prediction, projection or forecast will be realized.