REPRICINGS & REOPENINGS TRIGGER SHOPPING CENTRE OUTPERFORMANCE
- Despite the significant challenge of record high inflation, real retail sales in the Eurozone are projected to grow at 1.2% pa in 2022-26. This is a return to its long term post GFC trend and reflects the low consumer sentiment as well as high employment.
- Covid restrictions drove the e-commerce share of retail sales to new record highs. Countries with high shares will see a short term drop in 2022. Going forward the e-commerce share is projected to resume its increase and go up by 1% pa across Europe.
- Switching to in-store sales, we note that these already rebounded in 2021 in Cont. Europe. By 2026, they are projected to stabilize at 3% above their 2019 pre-pandemic levels. UK in-store sales are expected to stabilize by 2026 at 5% below 2019.
- In-store sales growth will be supported by the latest footfall data. As lockdowns were finally released at year-end 2021, footfall levels have remained at levels exceeding pre-pandemic levels. This is a strong rebound from levels of near 20% in March 2020.
- Another positive signal comes from the 82% of retail rents now being collected. Not only ahead of 2019, they are also a solid reversal from their 45% record Covid low. From the worst hit sector, retail is now ahead of the all sector rent collection average.
- On the back of a challenging macro outlook, our forecasts for prime retail rents show near zero growth for the next five years. This is a stabilization from the 30% UK and 10% Cont. European declines in prime rents during the 2020-21 Covid period.
- Investors’ concerns led to 2021 pan-European retail investment transactions to come in at just over half their EUR 60bn record in 2015. Future retail transaction volumes might be impacted by the limited availability and higher costs of debt financing.
- After a significant re-pricing since 2017, shopping centre yields are expected to stabilize at 5.5% for the 2022-26 period. Similarly, prime high street yields re-priced to 4.1% in 2021 and are expected to remain there until 2026 in our base case.
- Expected 2022-26 returns for shopping centre are 6.0 % and 3.8% for high street retail returns in our latest base case. If inflation persists and bond yields move up, our downside scenario implies lower returns at 5.4% for centres and 2.9% for high street.
- Based on our risk-adjusted approach shopping centre markets have an average 140 bps excess spread of expected over required returns. This is ahead of the negative 30 bps for high street markets and the 25 bps for all property types.
- As a result, 60% of our shopping centre markets are classified as attractive and 40% of high street markets are less attractive.
- Amongst shopping centre markets, Stockholm, Berlin and UK regional markets stand out as the most attractive markets, while among high street retail market Brussels and Berlin rank top. Many CEE and Southern European markets are less attractive.
Expected Returns Forecasts for Selected Sectors (2022-26, % pa)
MACROECONOMIC FUNDAMENTALS
REAL RETAIL SALES REVERT BACK TO LONG-TERM TREND
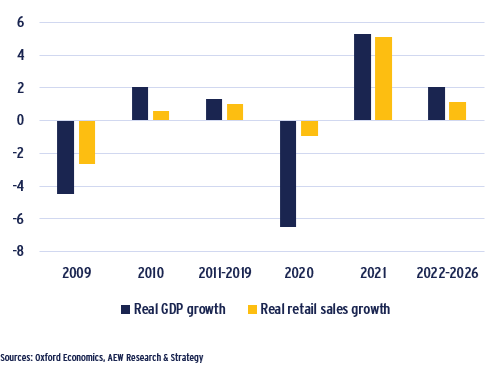
- Similar to 2011-2019 post-GFC recovery period, real retail sales growth is predicted below GDP growth in the post-covid recovery period.
- After a strong decline of -6.5% in 2020, Eurozone’s real GDP growth will reach pre-pandemic levels of 2% in the period of 2022-2026, while real retail sales growth stays at 1.2% pa.
- In the short term, this will be driven by high inflation, negative real income growth, increased geopolitical uncertainty surrounding the war in Ukraine, all of which resulting in lower consumer confidence in Europe.
- This is also the reason why we show real growth rates, which are adjusted for inflation.
- Real retail sales showed more resilience in 2020 in comparison to GFC, as a results of extensive government support policies aiming to safeguard employment and income.
- There are two positive factors absorbing the impact of high inflation, which are the historically low level of unemployment and high level of accumulated household savings from Covid period.
Real (inflation-adjusted) Eurozone GDP and Retail Sales growth pa (2009-26)
AFTER 2022 PAUSE SHARE OF E-COMMERCE TO ADVANCE
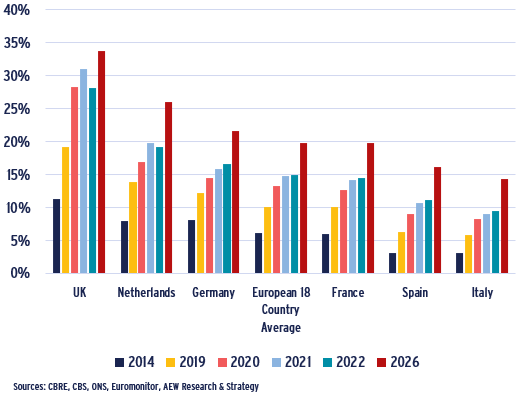
- Covid restrictions in 2020 and 2021 drove online share of retail sales to historical record levels across Europe.
- Post-Covid, UK and Netherlands which have the highest levels of e-commerce penetration are experiencing a temporary drop in this share in 2022.
- This drop is not expected in the countries with lower levels of online sales share, like Germany, France, Italy and Spain.
- Going forward, the growth trend is forecast to return in the period up to 2026, where the European average e-commerce retail share is expected to increase from 15% in 2022 to 20% in 2026.
- Despite this continued growth in e-commerce share, it remains unclear when and at what level it will stabilise.
- This might be impacted also by the escalating costs of free returns with e-commerce platforms and a change in the returns policy of fashion retailers.
Share of e-commerce sales, %
IN-STORE SALES TO STABILISE BY 2026
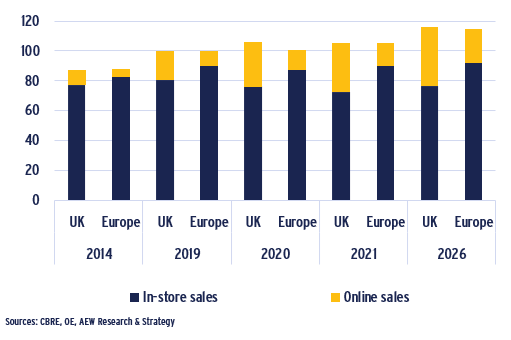
- Including a strong 2021, annual total real retail sales are projected to increase above 2019 levels by 16% in the UK and 10% in Continental Europe by 2026.
- This total sales growth is almost exclusively driven by the increase in online sales. But the in-store sales remain relatively unaffected, despite the pandemic.
- The volume of in-store sales in the UK dropped by 5% in both 2020 and 2021. From 2022 this is expected to rebound by 2026 to just 5% below 2019 levels.
- In-store sales in Continental Europe already rebounded in 2021, when the overall index sales gained 3% relative to a drop of only 4% in 2020.
- Continental European in-store sales volumes are also expected to stabilize by 2026 albeit at higher level than the UK at 3% above pre-pandemic levels.
Real retail sales per channel, UK vs. Continental Europe (index, 2019=100)
OCCUPIER MARKET
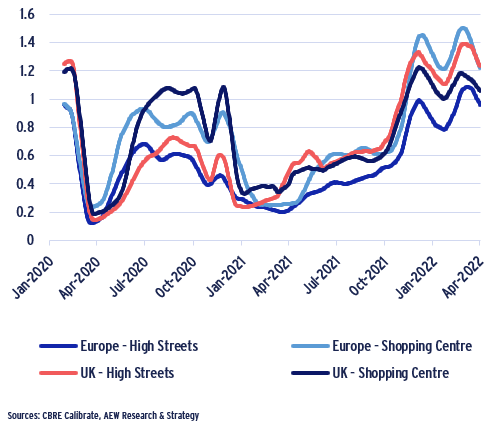
FOOTFALL EXCEEDS PRE-PANDEMIC LEVELS
- Customer visits at shopping locations as reflected by footfall data was largely affected by the pandemic-related restrictions in the UK and Europe.
- Footfall fell to levels of near 20% in March 2020 during the first lockdown and again to around 25% in spring 2021 when the lockdowns were re-imposed.
- As lockdowns were finally released, by December 2021 most footfall levels have stayed at levels exceeding pre-pandemic levels across all of the submarkets.
- There is little consistency between the UK and rest of Europe or even between shopping centers and high street locations.
- European shopping centers show the highest levels of footfall over the last three months despite European high street locations trailing behind.
- The lack of Asian tourists might drive the limited rebound for European high streets. But, this is inconsistent with the strong recovery for UK high streets.
- Regardless of these minor differences, the footfall data shows a very positive trend for retailers and investors alike.
Footfall across sample of European retail locations (1-month moving daily average)
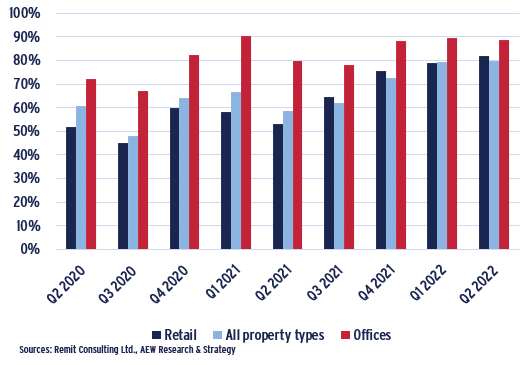
UK RETAIL RENT COLLECTIONS NEARLY CAUGHT UP
- UK rent collection figures have steadily improved since Q3 2020.
- As a starting point, we use the actual reported pre-Covid 2019 all-property type collection levels of 79% and show selected sectors as a percentage of that level.
- Retail was the strongest hit by the pandemic, with only 45% collected of the normal pre-pandemic levels on the due date for Q3 2020 payments.
- Another drop in the collections was for Q2 2021 rents when only 53% of rents due were collected coinciding with the second lockdown.
- Retail rent collections have been recovering faster than the all sector average in three of the last four quarters.
- On the latest due date, retail investors collected 82% of the pre-pandemic levels. In comparison, the average collection level for all property types is estimated at 80%.
UK rent collection on due date, % of collection rate for 2019
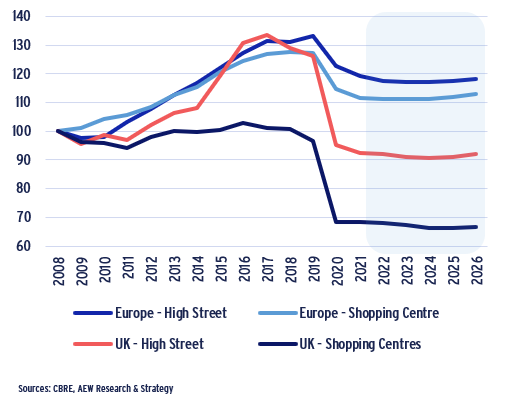
PRIME RETAIL RENTS FORECASTED TO STABILISE
- Prime retail rents were already declining, but experienced a major shock during the pandemic in 2020.
- UK shopping center prime rents dropped by 29% in 2020-21 and are forecasted to go further down by one percentage point by 2026.
- UK High street retail also experienced a severe drop of 27% in 2020-2021, with a further one percentage point drop by 2024, after which the rents are expected to start recovering.
- Continental European prime retail rents showed more resilience to the pandemic than the UK.
- Continental European shopping centres rents are expected to bottom out already in 2022 after a drop of 11% in 2020-2021
- European high street retail dropped by 10% in 2020-2021, and expected to lose another 1.5% in 2022 and remain at that level up to 2025.
Prime retail rents per sector, index (2008 = 100)
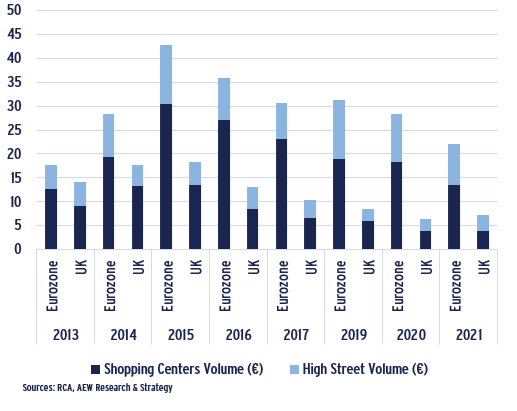
RETAIL INVESTMENT MARKET
2021 UK VOLUMES EXCEPTION IN DOWNWARD TREND
- Despite near EUR 30bn in pan-European retail investment transactions in 2021, it followed a downward trend since the over EUR 60bn record in 2015.
- This included EUR 13.5bn and EUR 3.9bn in European and UK shopping centres and EUR 8.6bn in European and EUR 3.3bn in UK high street retail.
- Albeit down from 2015 records, 2021 volumes were similar to those recorded in the post-GFC period between 2008 and 2014.
- The overall downward volume trend showed a minor reversal for the UK from both high street retail and shopping centre volumes.
- European high street volumes showed a big increase in 2019 reaching EUR 12.5bn , but have since declined to below EUR 10bn.
- Retail transaction volumes going forward might suffer from the lack of financing availability as well as higher loan margins available.
- Margins on retail loans have widened more than in most other sectors during the Covid lockdowns, while maximum LTVs were also more modest.
Retail investment volumes in EUR bn (2015-2021)
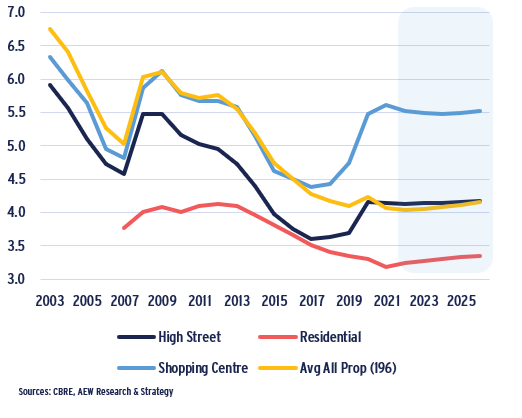
AFTER RE-PRICING PRIME RETAIL YIELDS TO STABILISE
- Since 2017, both European shopping centres and high street yields have re-priced by 120bps and 70 bps respectively.
- After this significant re-pricing, retaii yields are now projected to bottom out.
- Average shopping centres yield reached 5.6% in 2021 and is expected to narrow to 5.5% in 2022 and remain stable to 2026.
- Average high street yield bottomed out at 3.6% in 2017 and increased to 4.1% in 2021, where it is expected to remain until 2026.
- These base case forecasts are based on lower-for longer government bond yield assumptions, where it is expected that the ECB will be slow to lift rates.
- This should remain the case as long as the Ukraine conflict impedes the previously anticipated post-pandemic economic rebound.
Prime property yields (%)
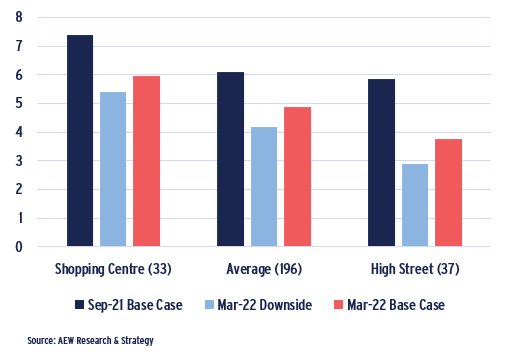
SHOPPING CENTRE RETURNS AHEAD OF HIGH STREET
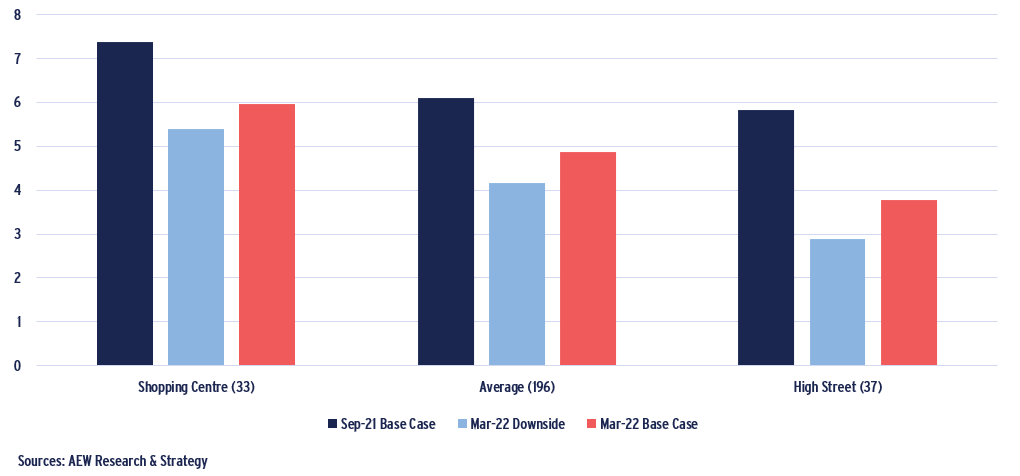
- As a result of Ukraine conflict’s impact, our total returns forecasts were revised downwards across all of the property sectors since Sep-2021.
- Across all property sectors, the total annualized average return between 2022 and 2026 came down from 6.1% to 4.9% pa.
- Retail sectors have historically been more sensitive to macroeconomic conditions so came down more than in other sectors.
- As a result, shopping centre and high street retail returns were revised downwards from 7.4% to 6.0%, and from 5.8% to 3.8%, respectively.
- Since the probability of a faster interest rate increases has been growing, we also present total returns under our downside scenario.
- Our downside scenario further reduced shopping centre and high street retail anticipated returns to 5.4% and 2.9% over the forecasted period.
- Regardless of what economic scenario, it is clear that shopping centre returns will remain ahead of high street for the 2022-26 period.
Expected Returns Forecasts for Selected Sectors (2022-26, % pa)
RELATIVE VALUE ANALYSIS
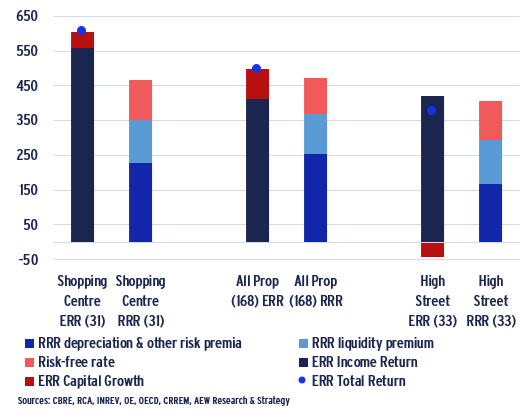
SHOPPING CENTRES OFFER 140 BPS EXCESS SPREAD
- In our risk-adjusted approach, we compare our forecasted expected return to the required rate of return, which include the risk premia investors require.
- This approach shows that our 31 shopping centre markets have an average 140 bps excess spread, i.e. expected (ERR) over required rate of return (RRR).
- This is well ahead of the 25 bps average excess spread across all property types which accounts for our entire 168 property markets universe.
- Our 33 high street retail market offers a stark contrast with an average negative excess spread of 30 bps.
- High street retail suffers mostly from the further rental level decreases projected which pushes the 3.8% ERR below the 4.1% RRR.
- Please note that all our returns are unlevered.
Required (RRR) vs Expected (ERR) Rate of Returns (2022-26) All Sectors Europe
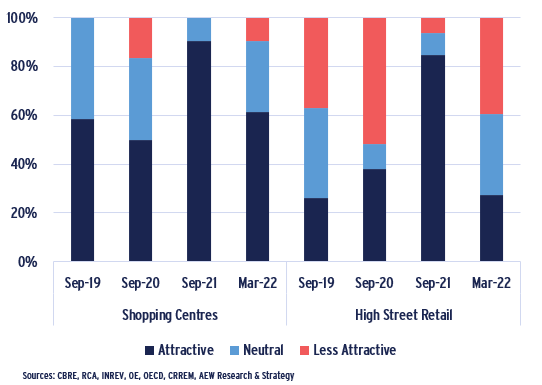
ONLY 40% OF HIGH STREET MARKETS LESS ATTRACTIVE
- Our relative value approach also classifies markets with ERRs well above RRRs as Attractive and those with ERRs well below RRRs as Less Attractive.
- When we then consider the evolution of our classifications since the last pre-pandemic year of 2019, we note the impact of the lockdowns.
- Our 2021 classifications improved significantly when restrictions were being lifted and our ERR included a more significant post-Covid GDP rebound.
- Our latest post-Ukraine macroeconomic outlook limits the GDP rebound and the number of attractive retail markets decreased again in 2022.
- Despite this setback, 60% of our shopping centre markets are classified as Attractive due to high income yield and some capital growth potential.
- Also, only 40% of our high street markets are classified as Less Attractive offering investors still plenty of choice.
Relative Value Classification of European Shopping Centres & High Street Retail Markets – Evolution since Sep-19
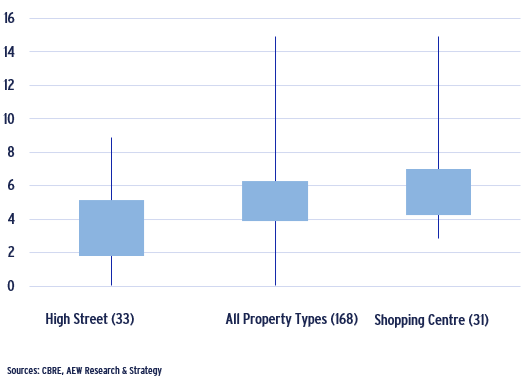
SHOPPING CENTRE RETURNS SHOW WIDE DISPERSION
- Before considering individual market results, we can also look at dispersion to consider any trends.
- Our graph shows maximum, minimum as well as 25th and 75th percentiles of the expected 2022-26 returns for selected sectors and the overall universe.
- It is clear that the dispersion of returns across shopping centre markets is larger than across high street markets.
- High street returns vary between 0.0% and 8.9%, while shopping centre returns vary from 2.9% to 14.9%.
- Median forecasted expected returns for high street retail, all property types, and shopping cenrte returns are 3.3%, 4.9%, and 5.5%, respectively.
- This data also confirms that the highest quartile of high street retail returns (+ 5.1%) is still better than the median value across all property types (4.9%).
Quartiles of Expected 2022-26 Returns per Sector
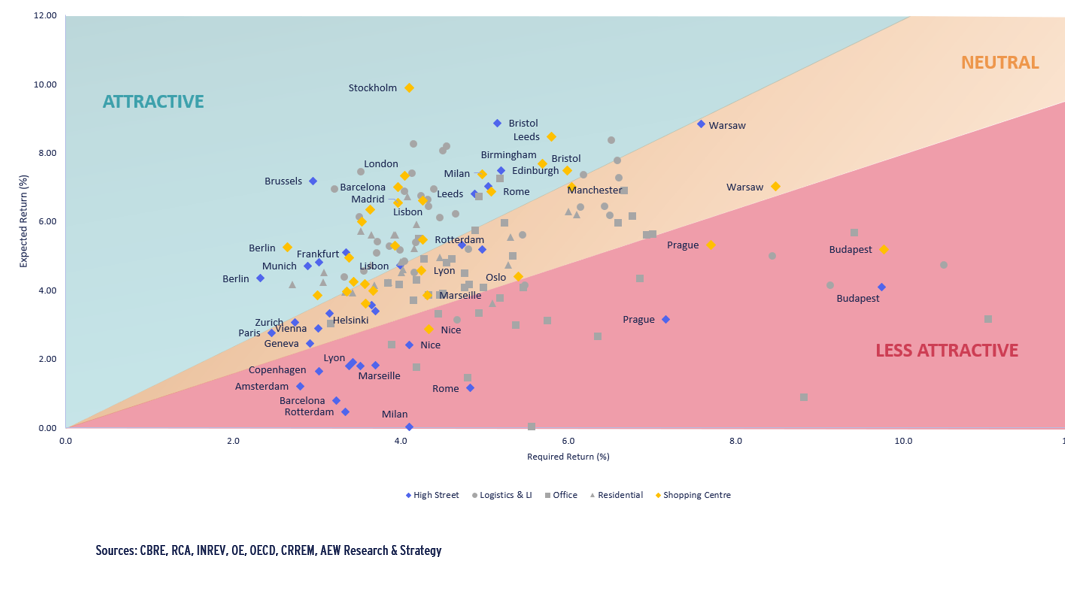
RELATIVE VALUE ANALYSIS (BASE CASE): PLENTY TO CHOOSE FROM
- The below scatter graph can be interpreted as follows: the required rate of return (RRR) is represented on the horizontal axis and the expected rate of return (ERR) for the next five years is represented on the vertical axis.
- Markets in the green area show ERR sufficiently in excess of the RRR as attractive. The red zone markets are classified as less attractive, given their ERR does not meet the RRR.
- The yellow background indicates a range of 20% of the difference between the two, which is deemed an appropriate range where markets are not clearly over- or under-priced. As a result, markets within this middle yellow range are labelled as neutral.
- Majority of Shopping centre markets are classified as attractive, while only three markets fall into less attractive category.
- Majority of high street retail markets are classified as either attractive or neutral.
- Stockholm shopping centre is the most attractive market, followed by Brussels high street market, as well as Berlin high street and shopping centre markets.
- Among less attractive markets are CEE and Southern European high street and shopping centres markets that historically are more sensitive to economic slowdown than more mature markets.
BASE CASE 2022-26 – EXPECTED VS REQUIRED RATE OF RETURNS
This material is intended for information purposes only and does not constitute investment advice or a recommendation. The information and opinions contained in the material have been compiled or arrived at based upon information obtained from sources believed to be reliable, but we do not guarantee its accuracy, completeness or fairness. Opinions expressed reflect prevailing market conditions and are subject to change. Neither this material, nor any of its contents, may be used for any purpose without the consent and knowledge of AEW.
