
The U.S. economy entered the second half of 2026 with considerably more momentum than expected earlier in the year. Consumer spending remains resilient, but we believe the defining feature of the current expansion is an extraordinary capital investment cycle associated with the economy-wide adoption of artificial intelligence (AI). Spending on computing equipment, software, data centers and supporting power infrastructure is increasingly central to business investment, financial market wealth and overall economic growth. This strength comes with an important tradeoff: inflation remains persistent, and longer-term interest rates moved sharply higher during the third quarter. For commercial real estate, the result is an unusual combination of supportive property market fundamentals and a more challenging cost of capital environment.
Summary
- Economic growth remains solid, but increasingly concentrated. Consumer spending continues to support the expansion, but incremental growth is becoming more dependent on AI-related capital investment. Housing and other interest rate sensitive sectors remain under pressure.
- The AI investment cycle is now a central macroeconomic force. Rapid spending on computing equipment, software, data centers and related power infrastructure is supporting aggregate investment, employment in associated industries and financial market wealth.
- Interest rates moved materially higher during the third quarter. The 10-year Treasury yield increased from roughly 4.4% at the end of June to 5.3% at the end of September as stronger growth, persistent inflation and fiscal concerns pushed expectations for monetary easing further into the future. Although yields have declined somewhat since quarter end, we believe the near-term risk remains tilted toward higher rather than lower rates as nominal GDP growth remains elevated.
- For commercial real estate, stronger growth is a mixed blessing. Continued expansion supports property demand and income growth, but higher Treasury yields and borrowing costs limit the potential for cap-rate compression. Investment performance will therefore depend more heavily on property-level income growth, capital discipline and market selection.
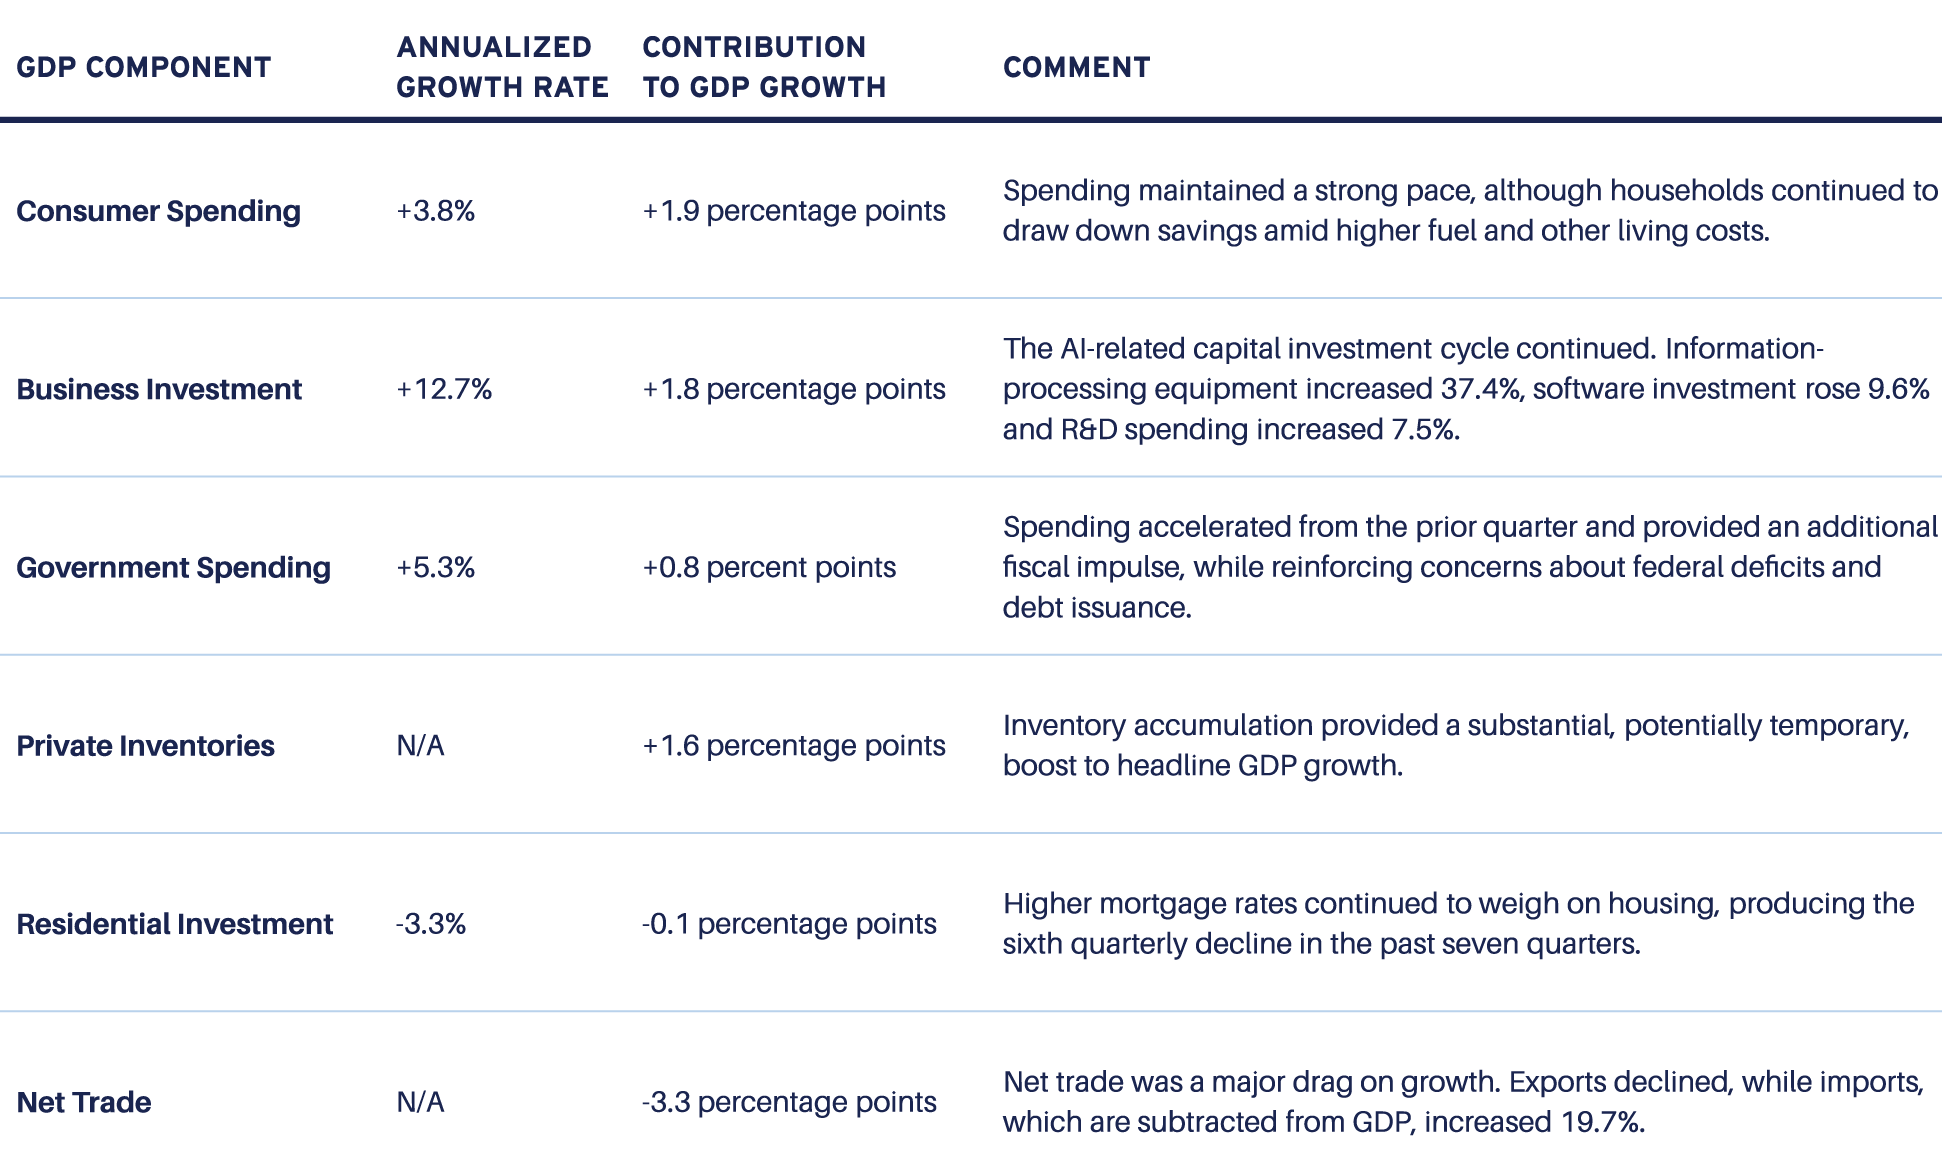
The initial estimate for third-quarter real GDP showed an annualized gain of 3.4%, accelerating from 2.2% in the second quarter. AI-related capital spending remained at the center of the expansion, as it has for much of the past two years. Investment in computing equipment, software, data centers and supporting power infrastructure continued to grow rapidly. Preliminary data showed annualized business investment growth of 12.7%, the strongest pace since 2020.
TABLE 1: KEY COMPONENTS OF THIRD-QUARTER REAL GDP GROWTH
Source: Bureau of Economic Analysis (BEA), Q3 2026
The strength in business investment stands in sharp contrast to conditions in housing. Higher mortgage rates have further reduced affordability, while home builder confidence has weakened and pending home sales declined sharply in September. Residential investment contracted again during the third quarter and is likely to remain subdued over the near-term.
Broadly, the U.S. economy is becoming increasingly bifurcated. Industries connected to AI, technology infrastructure and other forms of capital spending continue to expand rapidly, while activities most directly exposed to higher borrowing costs remain under pressure. This divergence is important because it suggests that the economy’s current strength is real but not broadly distributed.
Consumer spending has also remained more resilient than weak sentiment and higher energy costs might have suggested. Low unemployment and generally healthy household balance sheets continue to support consumption, particularly among higher income households. Rising equity values have provided an additional tailwind, in part reflecting the market capitalization gains associated with the AI investment cycle.
These supports are not unlimited. U.S. households have drawn down aggregate savings in each of the past three quarters to sustain consumption amid persistently higher energy and other living costs. Consumer spending growth is likely to moderate over the next several quarters as real income growth slows and the wealth effect from rising financial markets becomes less pronounced.
Labor-market conditions remain broadly consistent with continued economic expansion, although employment growth has slowed considerably from the pace of recent years. Initial unemployment claims remain exceptionally low, with little evidence to date of broad-based layoffs. At the same time, hiring, job openings and wage growth have moderated.
Slower employment growth appears to reflect constrained labor availability as well as softer labor demand. Restrictive immigration policy, an aging population and declining labor-force participation are limiting overall labor force growth. As a result, relatively modest job creation may be sufficient to keep the unemployment rate broadly stable.
The combination of resilient demand and constrained supply has complicated the inflation outlook. Overall inflation remains well below its post-pandemic peak, but progress toward the Federal Reserve’s 2% target has stalled. Higher energy and transportation costs, residual tariff effects and renewed goods price pressure have contributed to firmer inflation readings. Wage growth and housing costs continue to moderate, but not yet sufficiently to offset these other pressures.
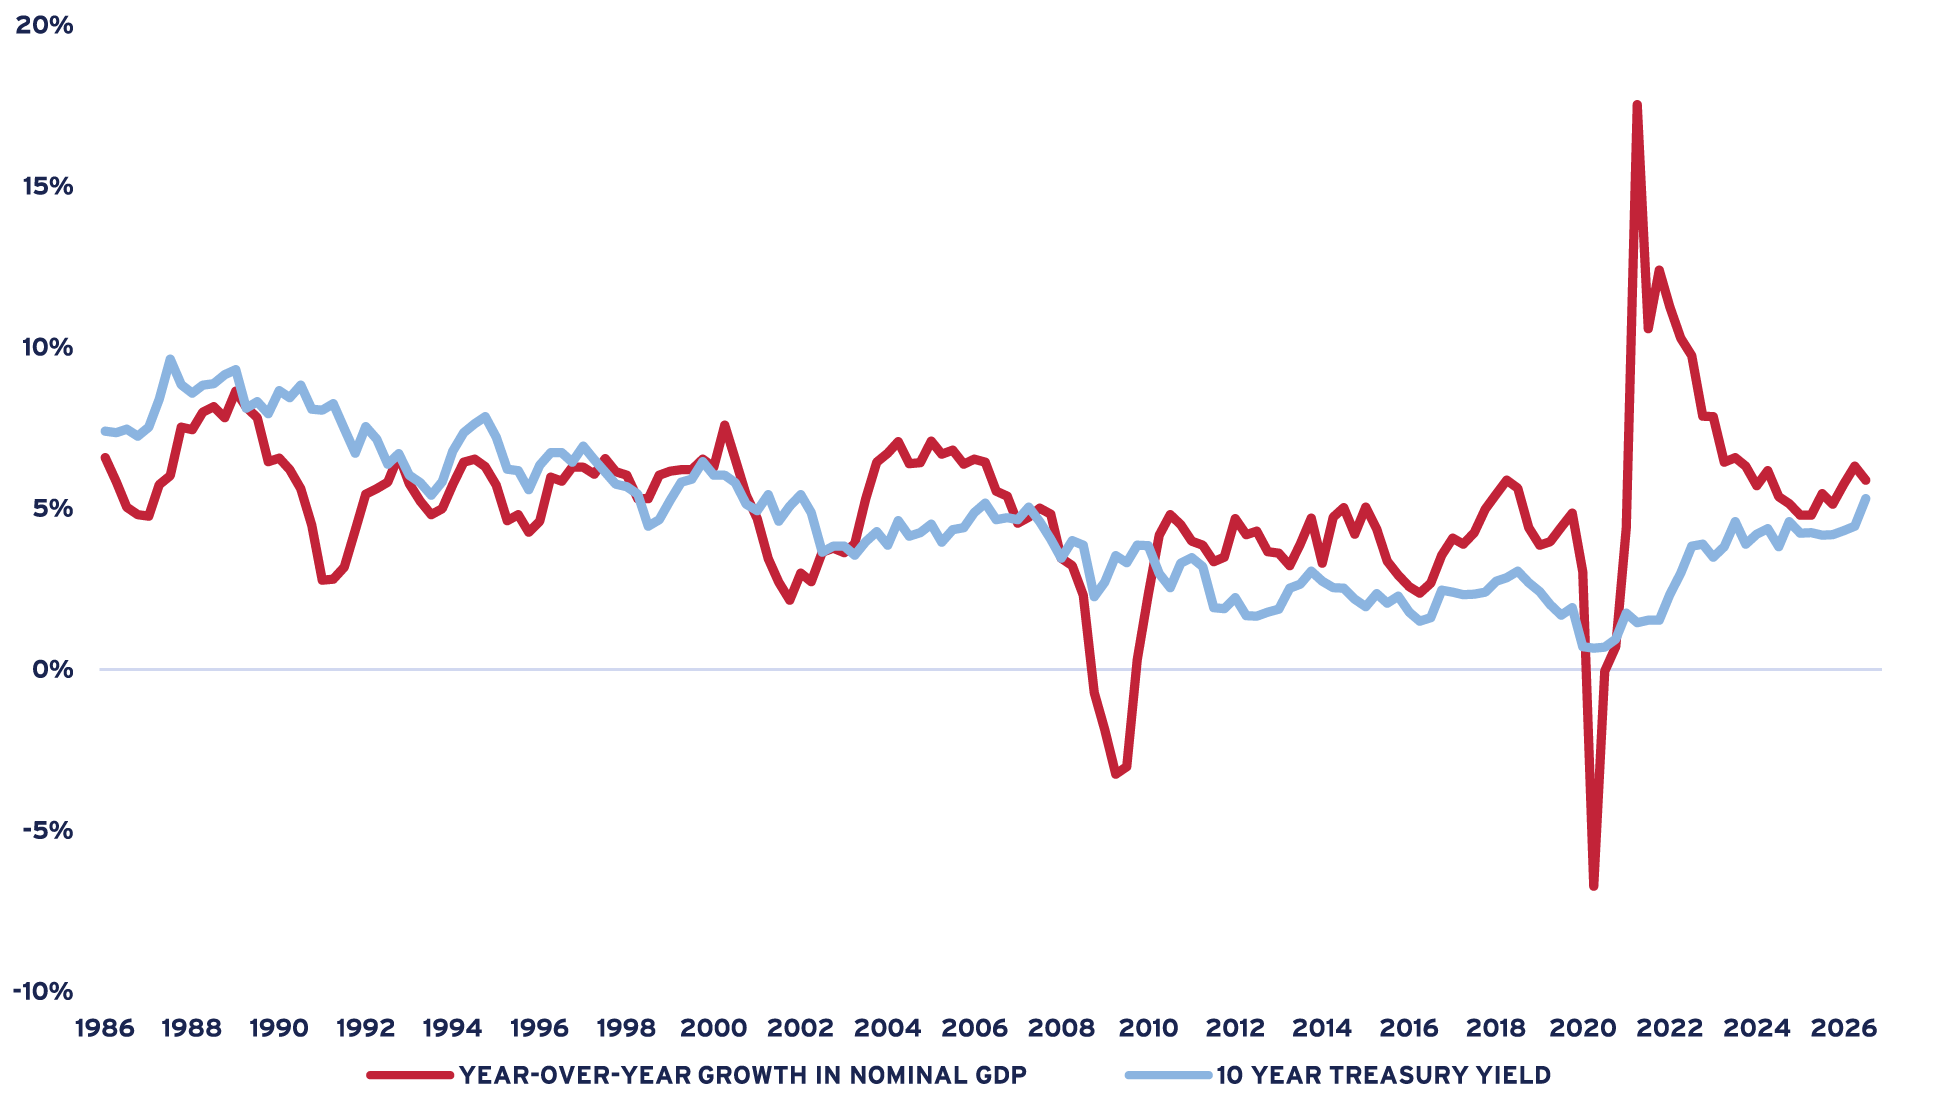
For investors, the most consequential macroeconomic development during the third quarter was the sharp rise in longer-term interest rates. The 10-year Treasury yield increased from approximately 4.4% at the end of June to nearly 5.3% at the end of September. This reversed much of the earlier optimism that slower growth and moderating inflation would permit rates to move meaningfully lower.
FIGURE 1: YEAR-OVER-YEAR GROWTH IN NOMINAL GDP AND THE 10-YEAR TREASURY YIELD
Source: Bureau of Economic Analysis (BEA), Federal Reserve (FRED)
Stronger economic activity, persistent inflation, large federal deficits and growing public- and private-sector financing requirements have all contributed to higher yields. The capital required to finance the AI build-out is part of this broader demand for funding, although it should not be viewed as the sole or necessarily dominant explanation for the increase in Treasury rates.
The Federal Reserve is likely to remain cautious. Forecasts differ on the precise course of monetary policy, but the broader implication is increasingly clear: meaningful interest-rate relief is unlikely in the near-term. Indeed, the 10-year Treasury yield may move higher before it moves significantly lower if extraordinary AI-related capital investment and continued deficit spending sustain above-trend nominal GDP growth.
This relationship also creates an important tension for commercial real estate. The same investment cycle supporting economic activity, occupier demand and property income growth may keep the cost of capital elevated. Stronger growth is therefore helpful for property fundamentals but does not necessarily translate into stronger property valuations.
Looking ahead, continued economic expansion through 2027 remains the most likely outcome, although growth should gradually moderate. Consumer spending is likely to slow, housing will remain constrained by elevated borrowing costs, and the exceptional growth rate of AI-related investment will eventually normalize. Nevertheless, continued capital spending, together with the potential for gradually improving AI-related productivity, should remain supportive of aggregate growth.
The durability of this outlook depends disproportionately on the AI investment cycle. The baseline expectation is that the build-out will continue, reflecting the scale of computing, data center, power and software infrastructure required for economy-wide AI adoption. There is also potential for the capital-spending recovery to broaden beyond AI as technological spillovers, defense investment and other structural forces encourage spending in adjacent industries.
The principal risk is that investment gets too far ahead of realized productivity gains or end-user demand. A reassessment of expected AI returns could slow capital spending, weaken equity values and reverse part of the wealth effect currently supporting consumption. Such an outcome would probably reduce growth and inflation pressures, potentially creating a more favorable interest-rate environment, but only alongside a weaker economic outlook.
Employment represents a second channel of risk. AI implementation may raise productivity, but it could also displace workers in affected occupations and industries. If AI-related job reductions become more widespread before new sources of labor demand emerge, already weak consumer sentiment could deteriorate further, weighing on spending and increasing public apprehension regarding this new technology.
Overall, the U.S. economy remains on solid footing, but its strength is becoming more narrowly tied to an unusually large and consequential investment cycle. As long as the AI build-out remains durable, it should continue to support economic growth, financial wealth and selected areas of property demand. At the same time, the resulting strength in nominal activity may keep inflation and long-term interest rates higher than investors had expected, limiting the benefit that current economic momentum provides to commercial real estate valuations.
Outlook for U.S. Commercial Property Investment
For commercial real estate, the economic backdrop remains broadly supportive of property fundamentals but considerably less supportive of current valuations. Continued economic growth, stable employment and healthy corporate investment should sustain demand for space and support positive income growth across most property sectors. Importantly, the economy does not appear to be moving toward the broad contraction in demand typically associated with a recession and significant deterioration in property fundamentals.
Indeed, after slowing over much of the past two years, property income growth appears to be re-accelerating. This is an important development. With nominal GDP growth remaining relatively strong and new property supply slowing sharply, the conditions are increasingly in place for commercial property NOI growth to move back toward the stronger pace of nominal economic growth.
The challenge is that this improvement in property fundamentals is occurring alongside a significant increase in the cost of capital. Higher Treasury yields have raised both debt and equity return requirements, reduced the likelihood of near-term cap-rate compression and increased the probability that property valuations will need to incorporate higher discount rates and capitalization rates. Stronger growth is therefore a mixed blessing: it supports property income growth, but it also reduces the likelihood that lower interest rates will provide a significant boost to valuations.
This environment places greater emphasis on income growth, investment discipline and asset selection. With less potential for declining interest rates to drive appreciation, investment performance will increasingly depend on the ability of individual properties, sectors and markets to generate durable NOI growth.
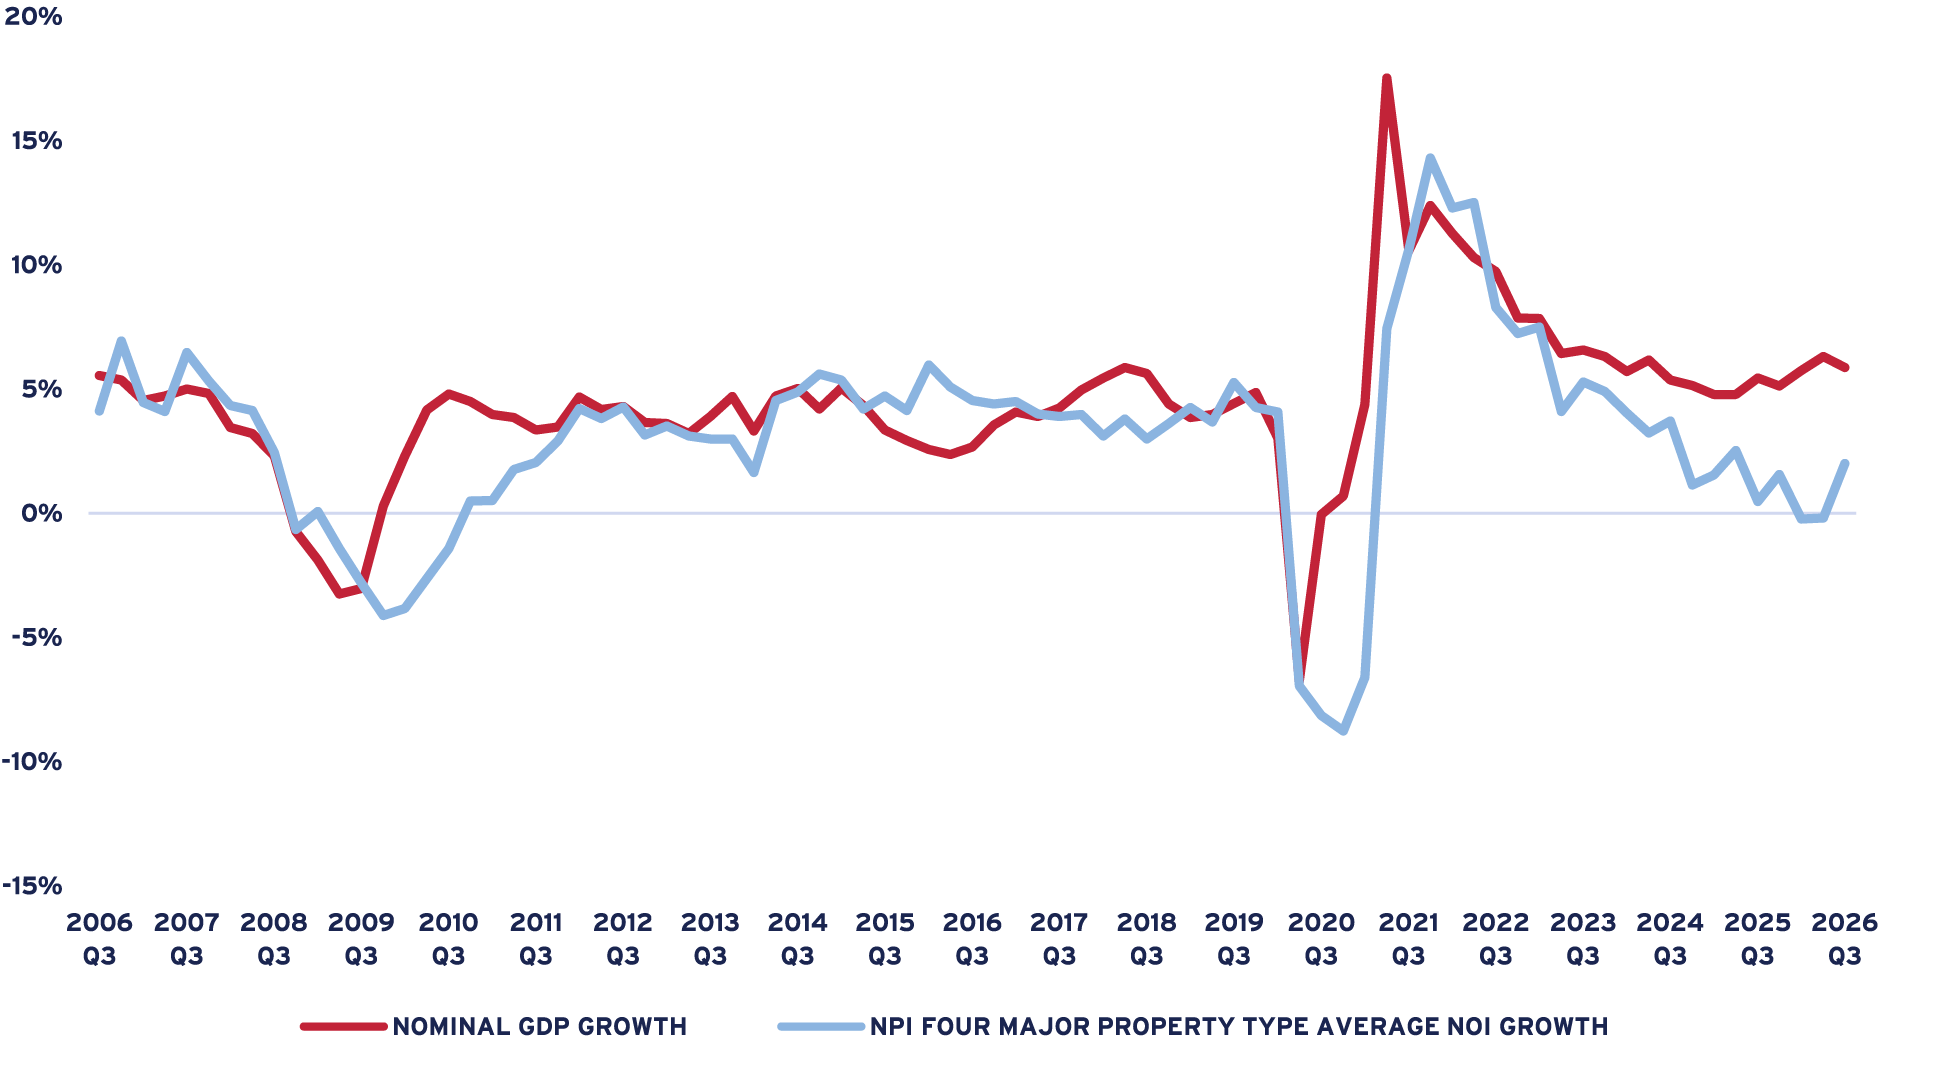
Over the past two years, average property income growth generally slowed, led by a significant deceleration in office NOI growth and a similar, although less pronounced, moderation in apartment and industrial properties. At the same time, nominal GDP growth accelerated, creating an unusually wide divergence between aggregate economic growth and commercial property income growth.
FIGURE 2: YEAR-OVER-YEAR GROWTH IN NOMINAL GDP AND FOUR-PROPERTY-TYPE AVERAGE NOI GROWTH
Source: Bureau of Economic Analysis (BEA), NCREIF
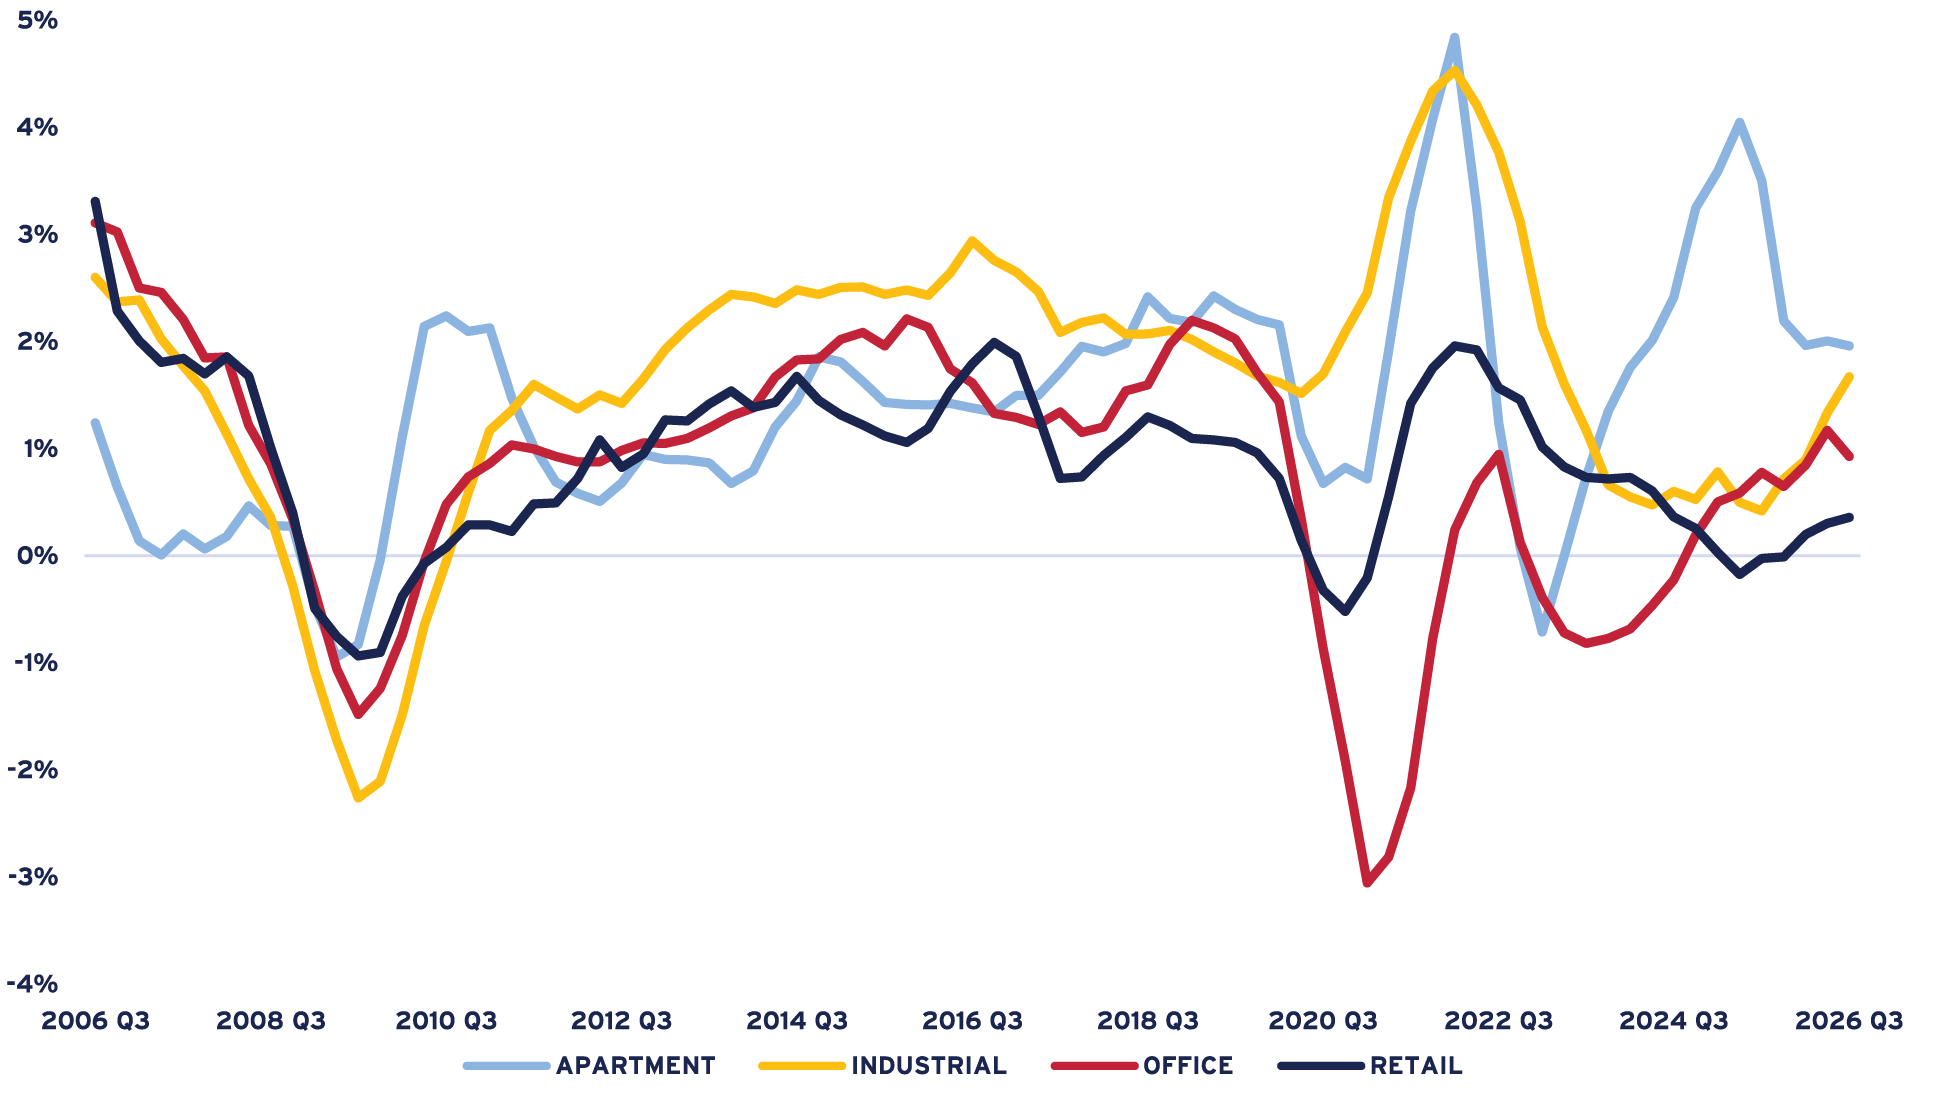
During the third quarter, this divergence began to narrow as average property NOI growth started to accelerate toward the stronger trend in nominal GDP. Based on current supply and demand conditions across the four major property sectors, we expect this convergence to continue, with aggregate property NOI growth accelerating further.
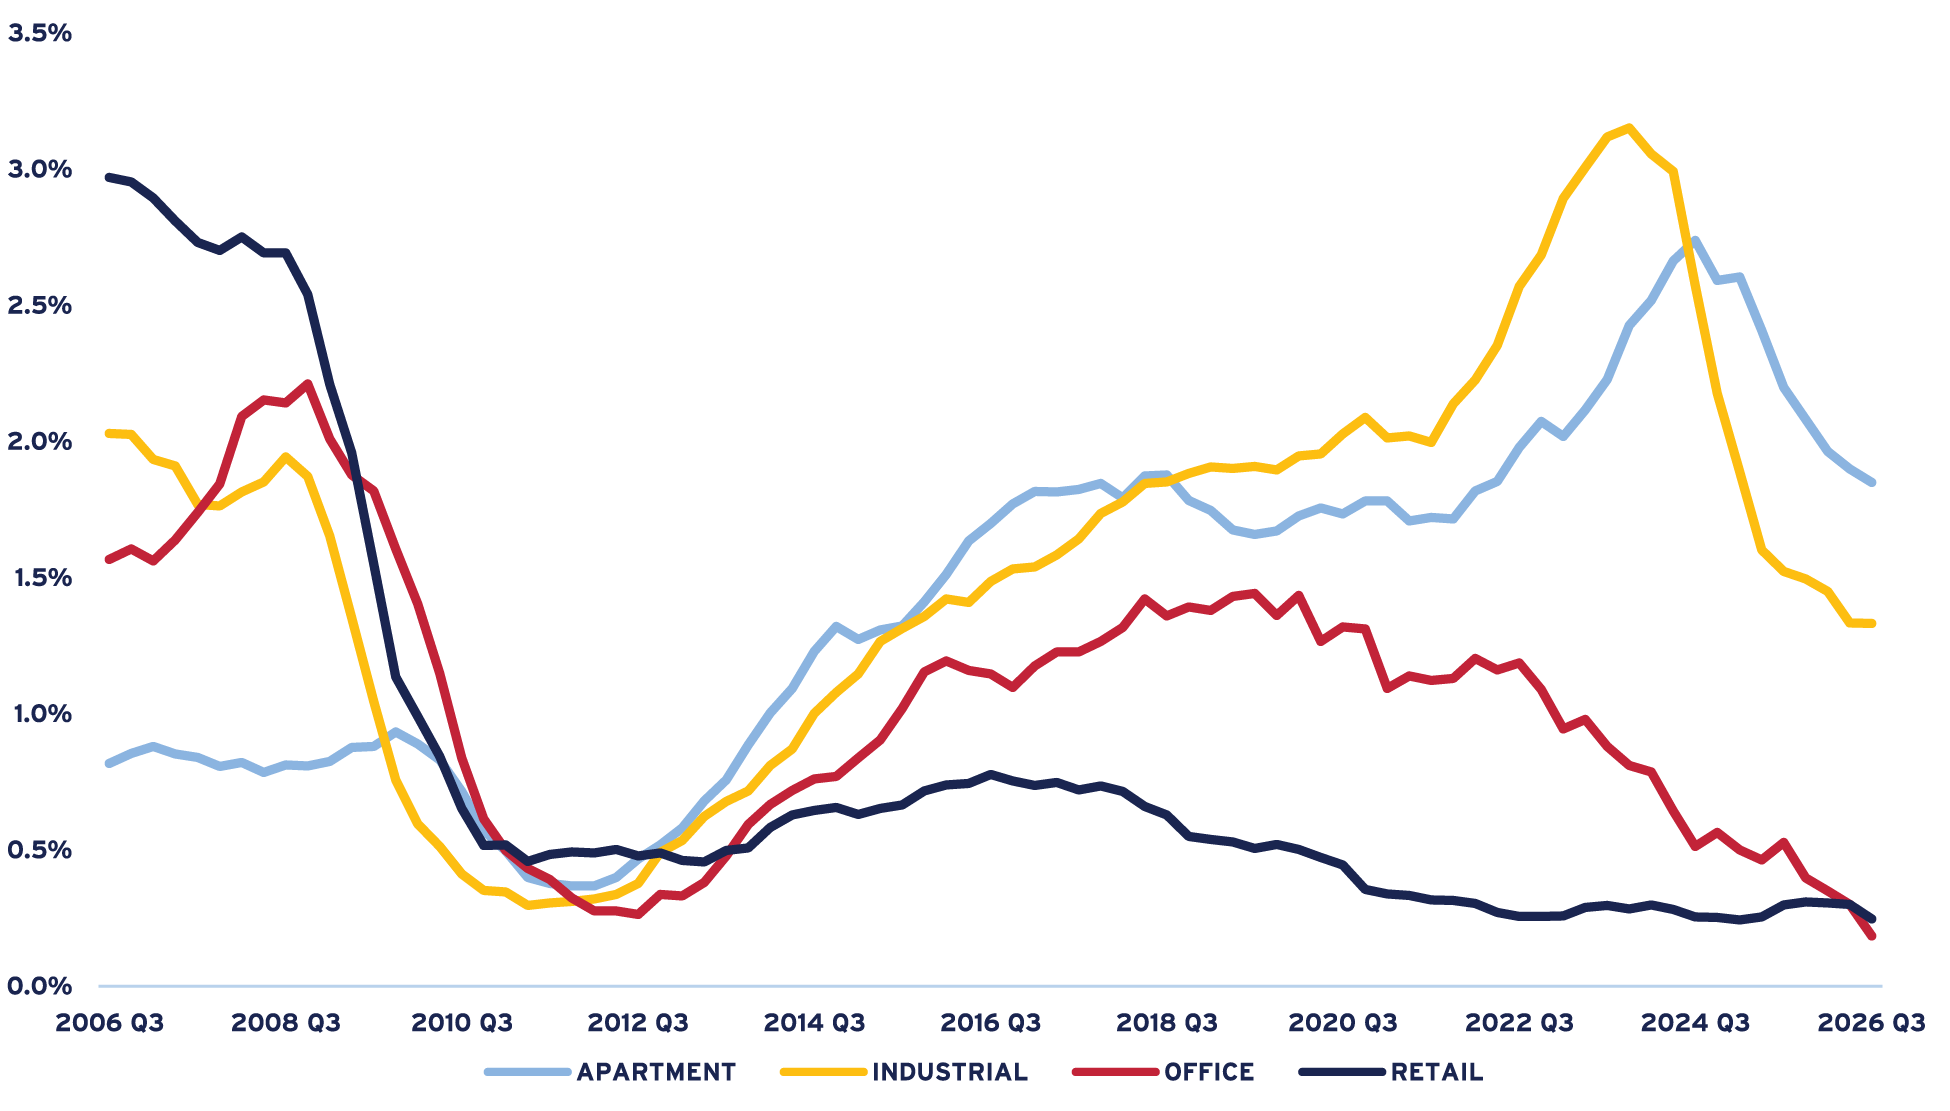
A key driver of this outlook is the pronounced slowdown in additions to the U.S. commercial property stock. The stock of office and retail property is currently increasing at an annual rate approaching zero, while supply growth in industrial and apartment properties has slowed rapidly. At the same time, growth in occupied space is broadly improving. The combination of diminishing new supply and improving demand should create increasingly favorable conditions for occupancy, rents and ultimately NOI growth, although the timing and magnitude will vary considerably by sector and market.
FIGURE 3: YEAR-OVER-YEAR GROWTH IN TOTAL PROPERTY STOCK (SUPPLY GROWTH)
Source: CBRE-EA, Q3 2026
FIGURE 4: YEAR-OVER-YEAR GROWTH IN TOTAL OCCUPIED PROPERTY STOCK (DEMAND GROWTH)
Source: CBRE-EA, Q3 2026
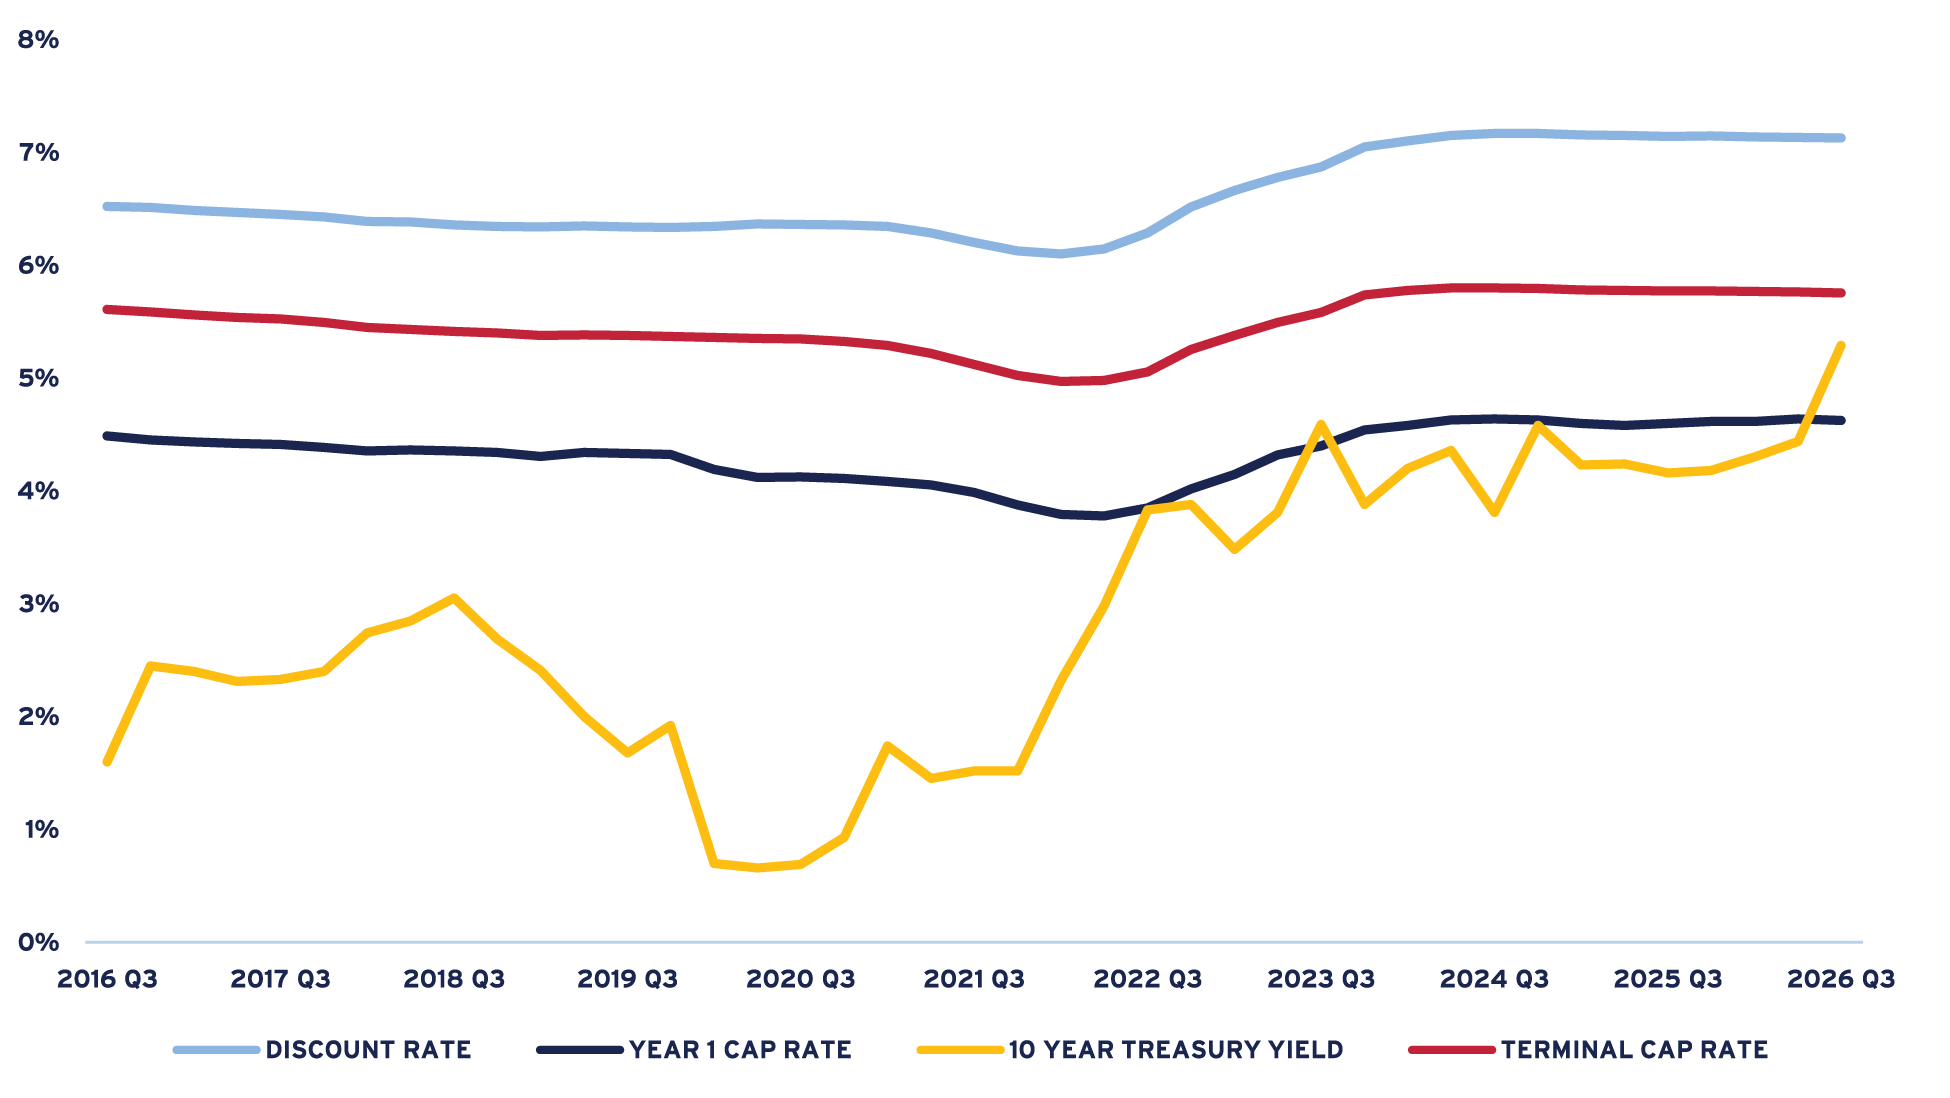
The valuation implications are less straightforward. If our assessment of the near-term interest rate environment is correct, with rates more likely to remain flat to higher than to decline materially, accelerating NOI growth should provide meaningful support to property values. It is unlikely, however, to fully offset the increase in required returns associated with the rise in interest rates over the past several months.
The NCREIF Property Index recorded modest positive capital appreciation during the third quarter, but the timing of the recent increase in bond yields suggests that much of that change in capital market conditions may not yet be reflected in property valuations. Absent a significant bond market rally, we expect investors and appraisers to begin incorporating higher discount rates and capitalization rates into property valuations, potentially beginning in the fourth quarter.
FIGURE 5: AVERAGE PROPERTY VALUATION METRICS IN U.S. CORE OPEN-END FUNDS (ODCE)
Source: Altus, Q3 2026
Conclusion
The next phase of the commercial property recovery is likely to involve two competing forces: improving property income growth and a higher required return on that income. How these forces ultimately affect valuations will vary considerably by property sector, geography and individual asset.
The adjustment in discount rates and capitalization rates is unlikely to occur uniformly or all at once. Properties and sectors currently valued at relatively low discount rates and capitalization rates, including portions of the industrial and apartment markets, may face greater upward pressure on valuation yields than sectors where required returns are already higher, including office and retail. At the same time, differences in expected income growth will be equally important. Assets with strong prospects for rent and NOI growth should be better positioned to absorb higher required returns than assets with weaker income growth prospects.
As a result, the direction of valuation metrics may be clearer than either their magnitude or timing. Discount rates and capitalization rates are likely to face some upward pressure if today's higher interest rate environment persists, but the extent of that adjustment remains uncertain. Importantly, it is occurring against an increasingly favorable property fundamentals backdrop. New supply is slowing sharply, demand for occupied space is generally improving and aggregate NOI growth is beginning to re-accelerate toward the stronger pace of nominal economic growth.
We therefore expect any aggregate valuation adjustment to remain manageable absent another significant increase in the broader yield environment. More importantly, the combination of stronger property income growth and the eventual resetting of property yields should leave commercial real estate on a firmer footing. The adjustment process may be uneven across sectors and individual assets, but allowing valuations to reflect the new interest rate environment while NOI growth improves should ultimately create a healthier relationship between property income, pricing and required returns, setting the stage for a more constructive investment environment.
Office
Office market fundamentals continued to improve during the third quarter, although the pace of recovery moderated from the unusually strong second quarter. Tenant demand remained positive, vacancy declined further and new supply stayed historically limited, supporting a gradual tightening in market conditions. While overall fundamentals have improved meaningfully over the past year, performance remains highly differentiated by market, location and asset quality.
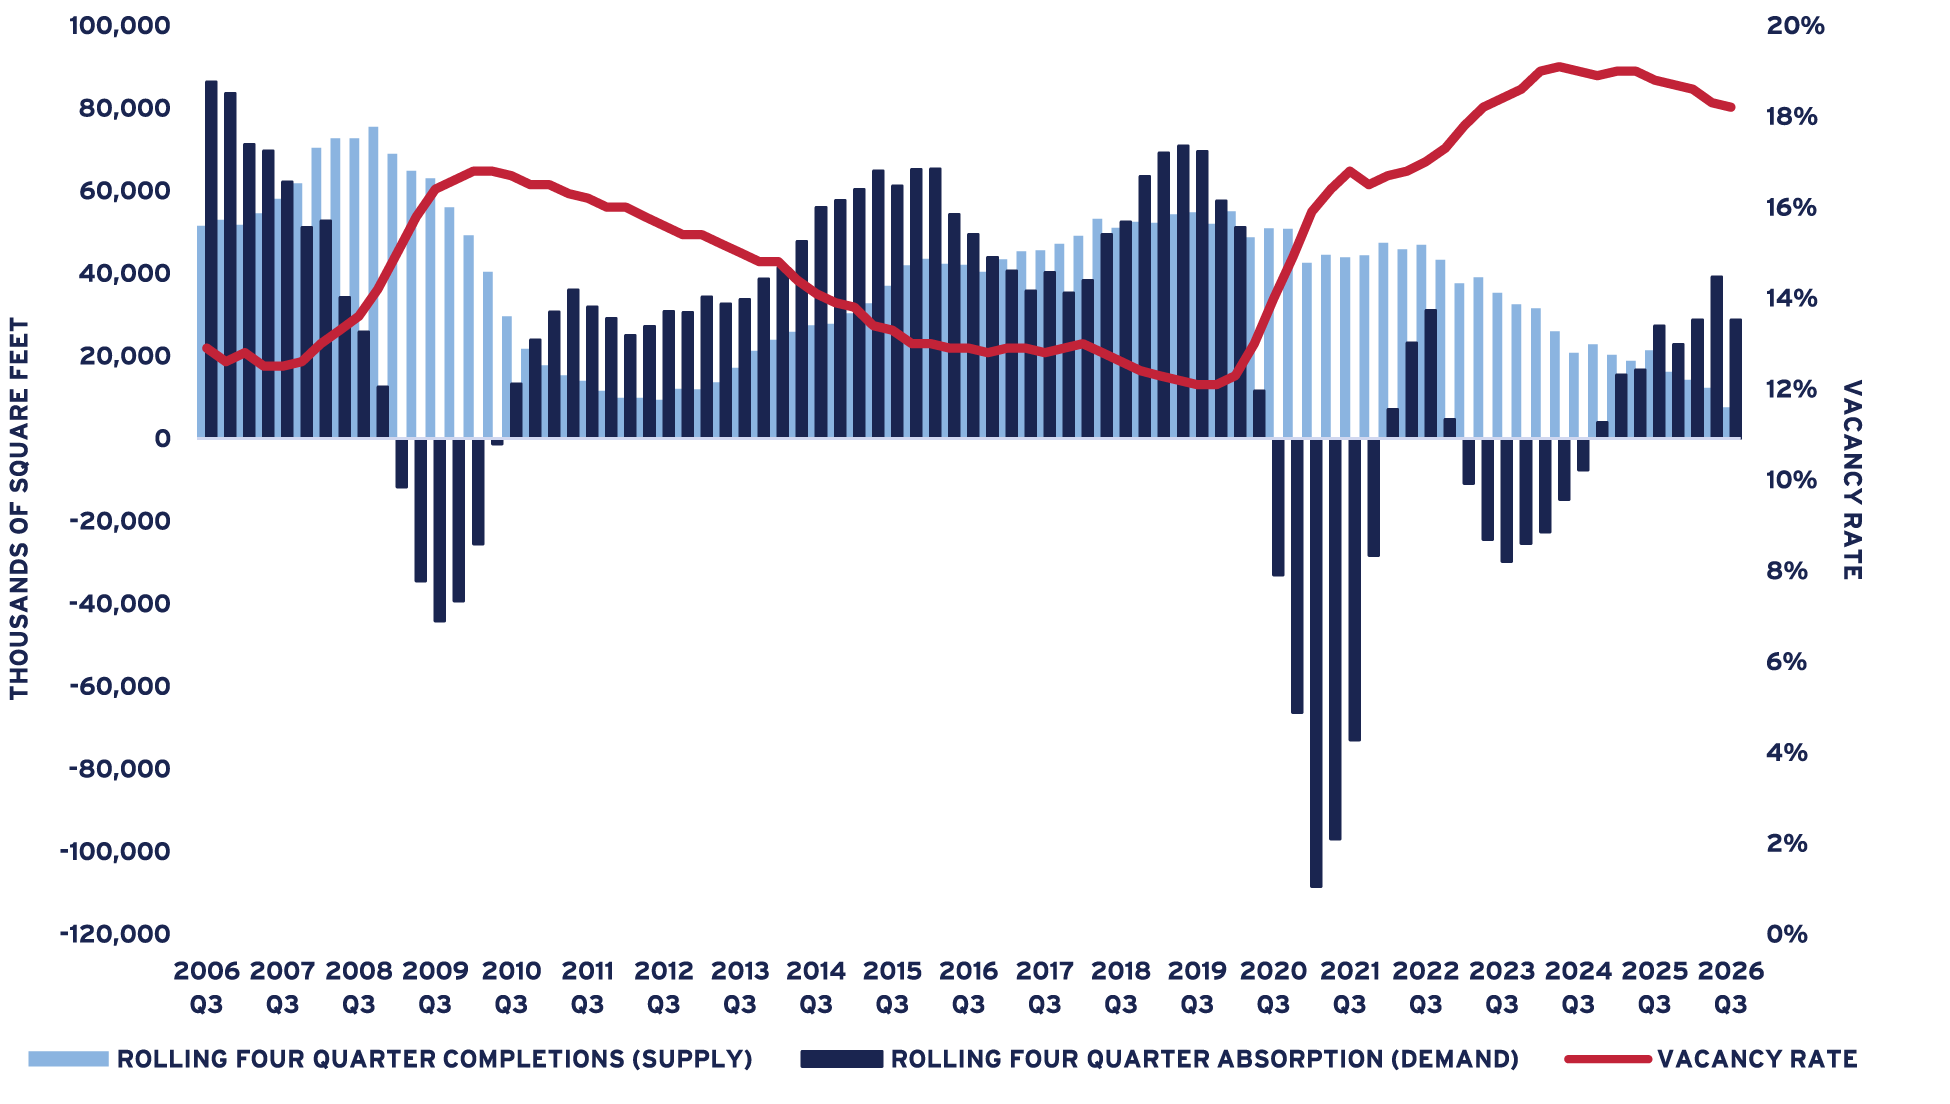
According to CBRE-EA, national office vacancy declined to 18.2% in the third quarter from 18.3% in the second quarter and 18.8% one year earlier. Net absorption remained positive at 4.4 million square feet (msf), though below the 12.3 msf recorded in the prior quarter. On a trailing four-quarter basis, absorption reached 28.7 msf, modestly higher than the 27.3 msf recorded one year earlier. Although demand remains below pre-pandemic norms, recent results indicate continued progress in absorbing excess space accumulated during the past several years.
FIGURE 6: U.S. OFFICE MARKET SUPPLY, DEMAND AND VACANCY RATE
Source: CBRE-EA, Q3 2026
Leasing activity also points to firmer occupier demand. JLL reports that leasing volume increased 6.4% year-over-year, with each of the past four quarters exceeding any individual quarter since 2019. Notably, recently executed leases reflected an average 13% increase in tenant footprints, compared with widespread downsizing as recently as 2024. While office-using employment growth remains subdued and occupiers continue to reassess long-term space needs, these trends suggest that the cycle of broad-based footprint contraction may be easing.
The most significant support for fundamentals continues to come from the supply side. CBRE-EA recorded only 1.5 msf of completions during the third quarter. On a trailing four-quarter basis, completions totaled just 7.5 msf. At the same time, office inventory continues to decline as conversions and redevelopment projects remove obsolete space from the market. JLL estimates that U.S. office inventory has contracted by more than 45 msf since late 2023, while CBRE, JLL and Colliers all report less than 30 msf currently under construction nationally. Together, these trends point to an extended period of constrained new supply.
As a result, market conditions are tightening most noticeably within the highest-quality segment of the market. CBRE-EA's asking rents increased 3.1% year-over-year, though national averages continue to mask substantial differences across building classes. Demand remains concentrated in trophy and recently renovated properties, where vacancy is declining and rent growth is strongest. Limited availability in premier buildings is also prompting more tenants to renew existing leases while some demand is beginning to spill over into well-positioned second-generation space.
Market performance also remains uneven geographically. New York and San Francisco continue to demonstrate some of the strongest momentum among major office markets. JLL reports nearly 5 msf of occupancy gains year-to-date in New York, while San Francisco has recorded absorption equivalent to approximately 3.3% of inventory. Colliers also identifies Manhattan, San Francisco and Silicon Valley among the stronger-performing markets. More broadly, nearly three-quarters of tracked markets have generated positive absorption year-to-date. Nevertheless, several major markets remain at a much earlier stage of recovery, underscoring the growing importance of local economic drivers, tenant composition, return-to-office adoption and asset quality in determining outcomes.
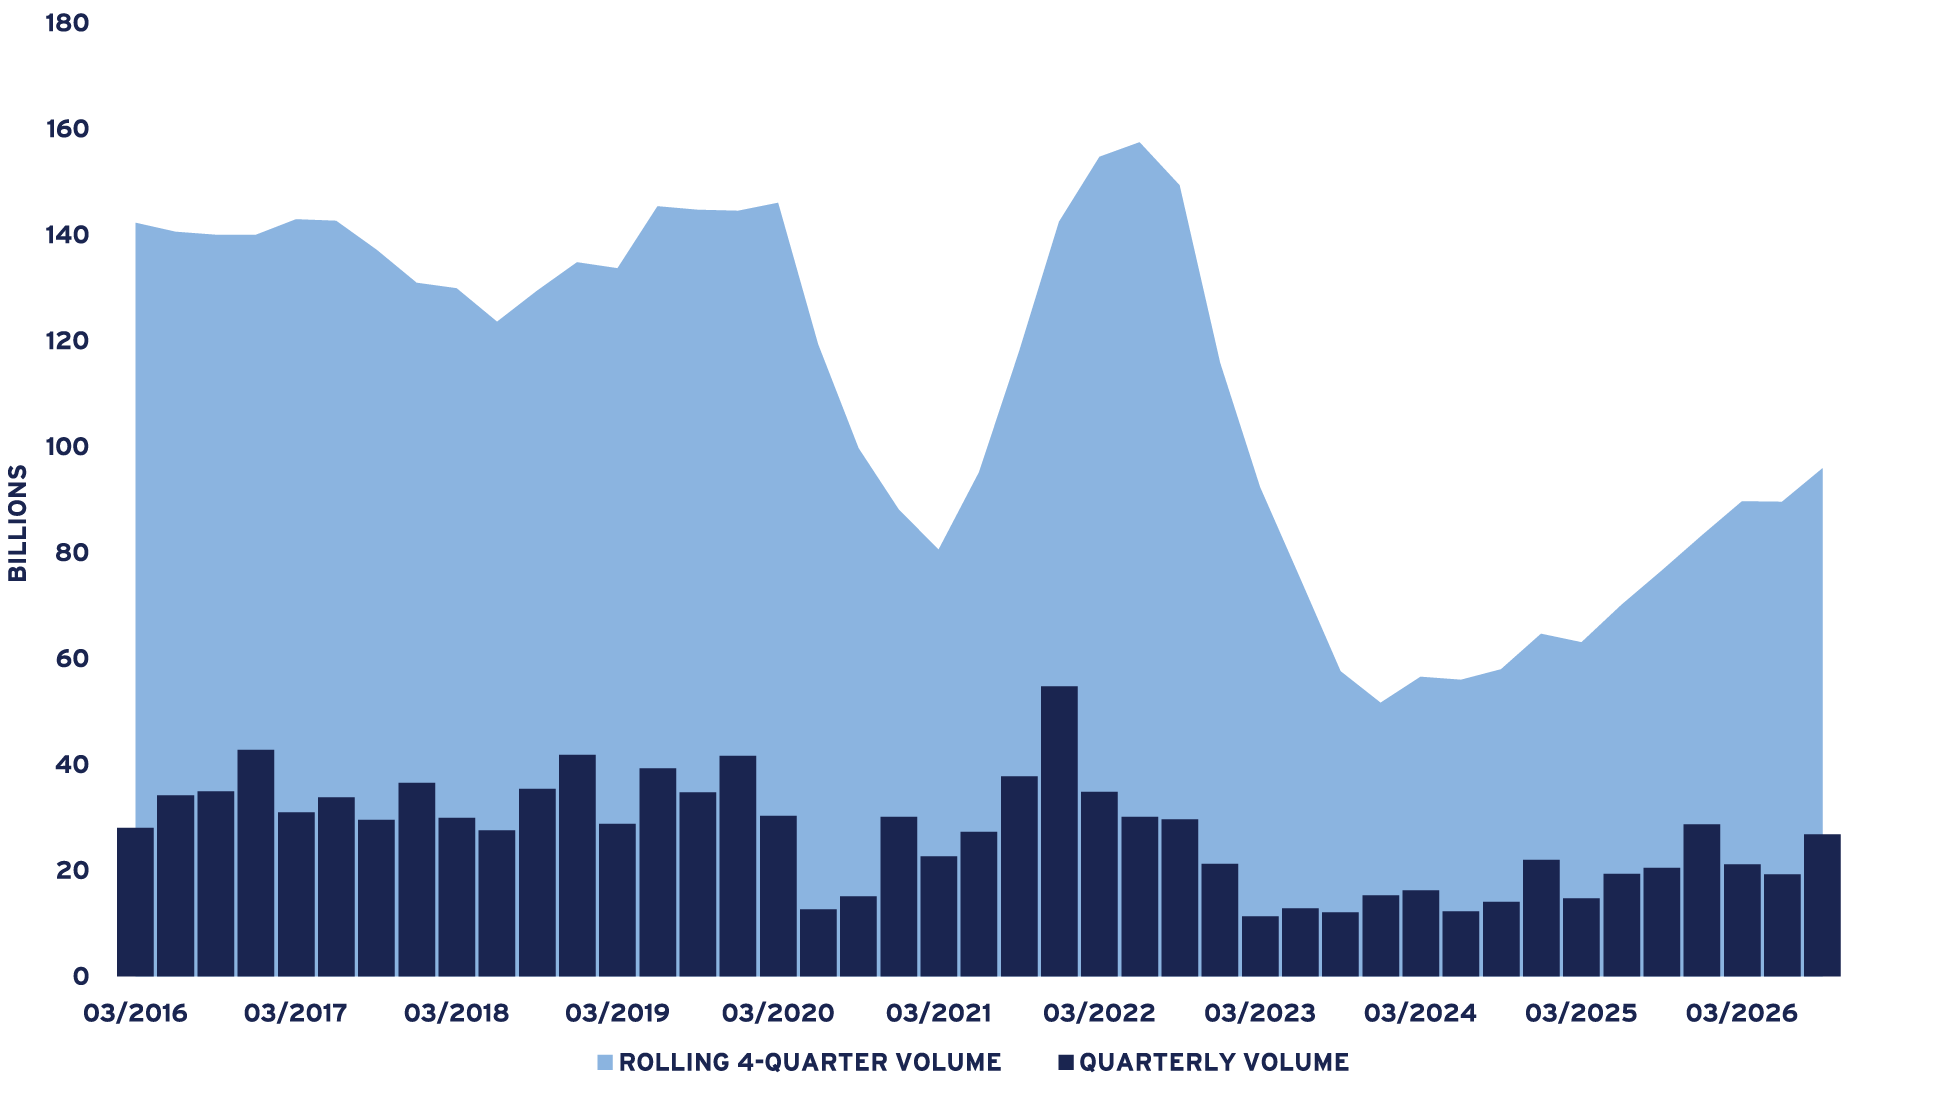
Capital markets activity also continued to recover. Real Capital Analytics reported $26.8 billion of U.S. office transaction volume during the third quarter, up 30.8% from a year earlier, while rolling four-quarter volume reached $95.9 billion, 25.3% above the prior-year period. Pricing signals were comparatively stable in the quarter. The average office cap rate was 7.43%, up 16 basis points (bps) year-over-year and up approximately 5 bps from the second quarter. The improvement in liquidity is encouraging, although transaction volume remains well below the levels recorded before the recent capital markets correction.
FIGURE 7: RCA U.S. OFFICE TRANSACTION VOLUME
Source: Real Capital Analytics (RCA), Q3 2026
Overall, third-quarter results reinforce the view that the office recovery remains in progress but uneven. Demand continues to improve gradually, vacancy is trending lower and supply growth has fallen to historically low levels. While elevated vacancy rates and evolving workplace utilization patterns remain headwinds, constrained new supply and ongoing inventory reductions should continue to support improving fundamentals, particularly for well-located, high-quality assets.
Apartment
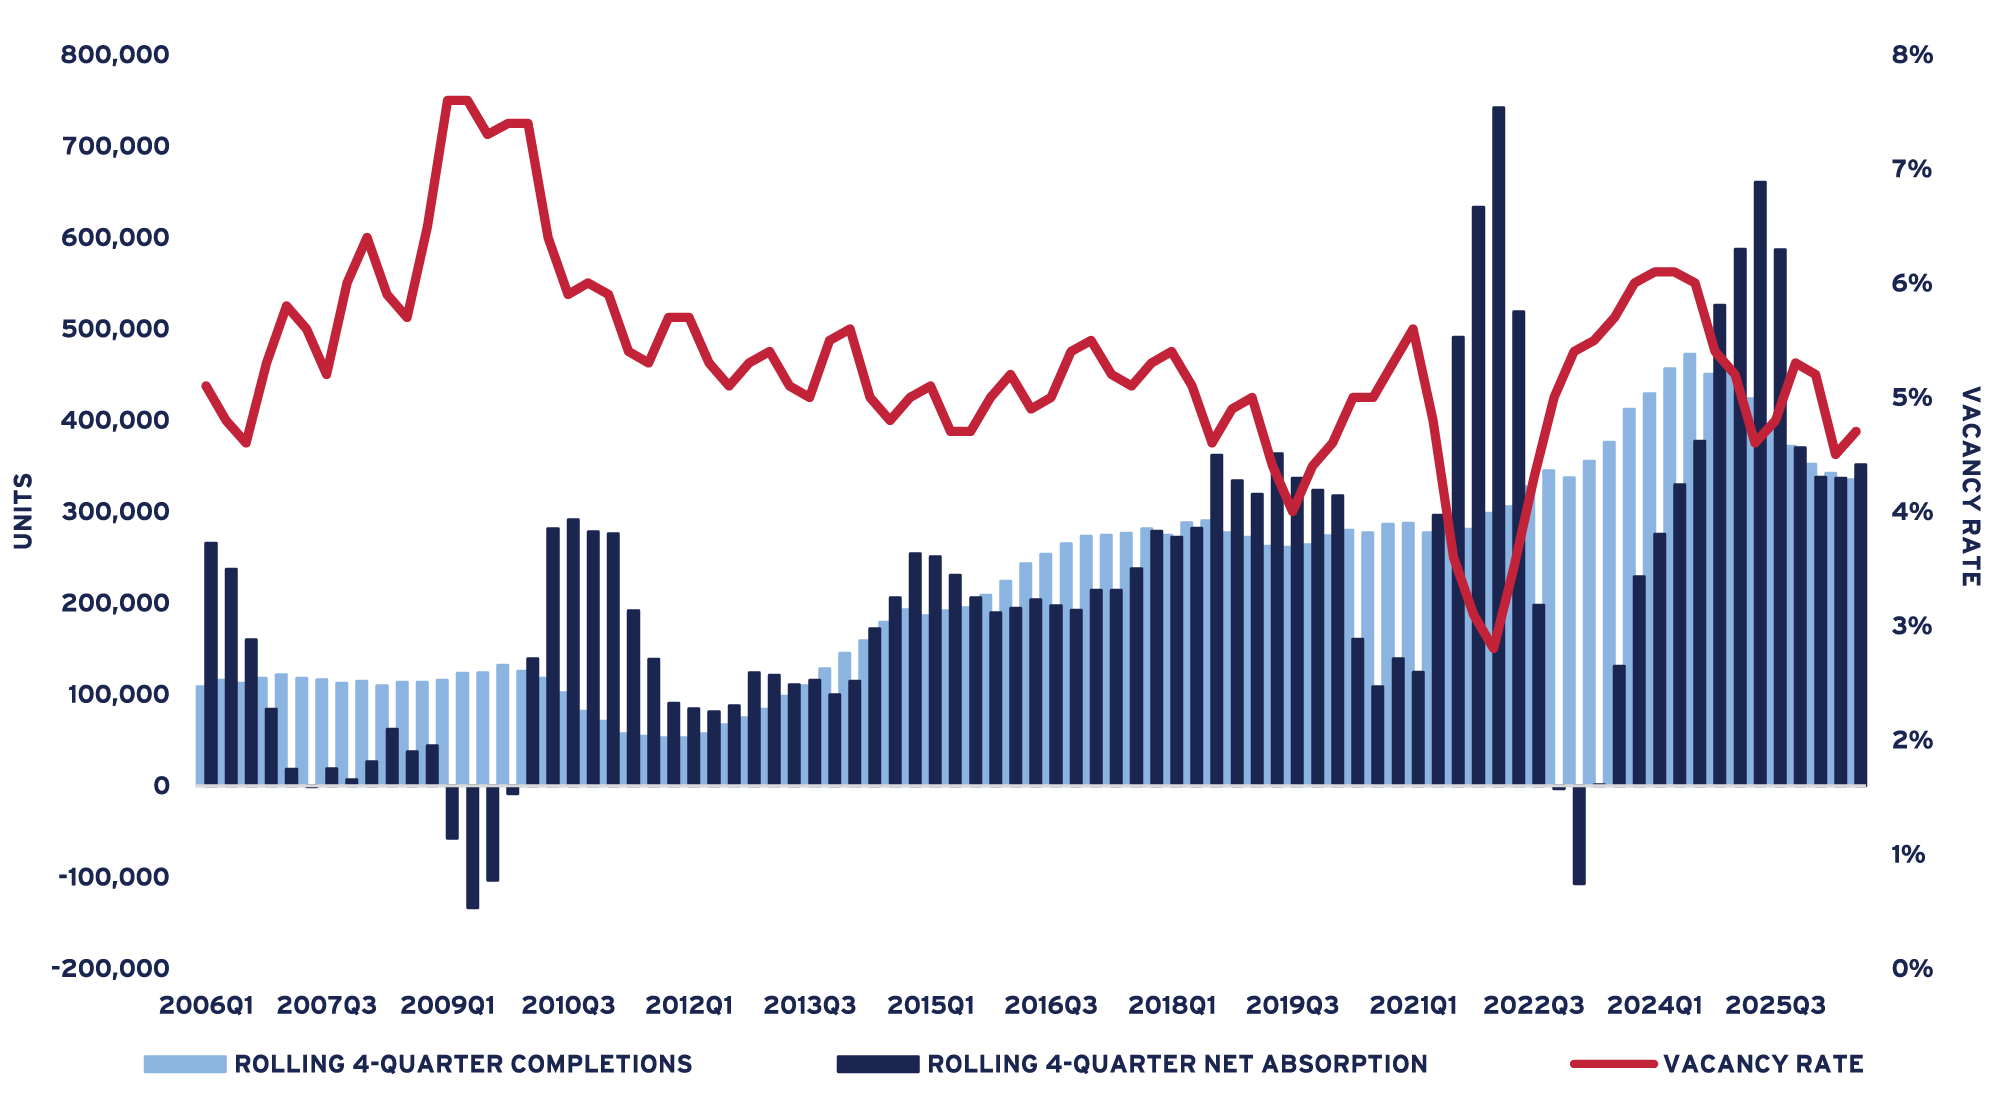
U.S. apartment fundamentals continued to improve in the third quarter as the market moved closer to balance following the recent surge in new supply. According to CBRE-EA, national vacancy increased modestly to 4.7% from 4.5% in the second quarter but remained below the 4.8% rate recorded one year ago and well below the recent 6.1% peak in early 2024. Third-quarter absorption totaled approximately 64,000 units, down sharply from an unusually strong 196,000 units in the second quarter but 29% above the year-earlier level. Completions totaled nearly 90,000 units, exceeding absorption during the quarter but down 7% from a year ago.
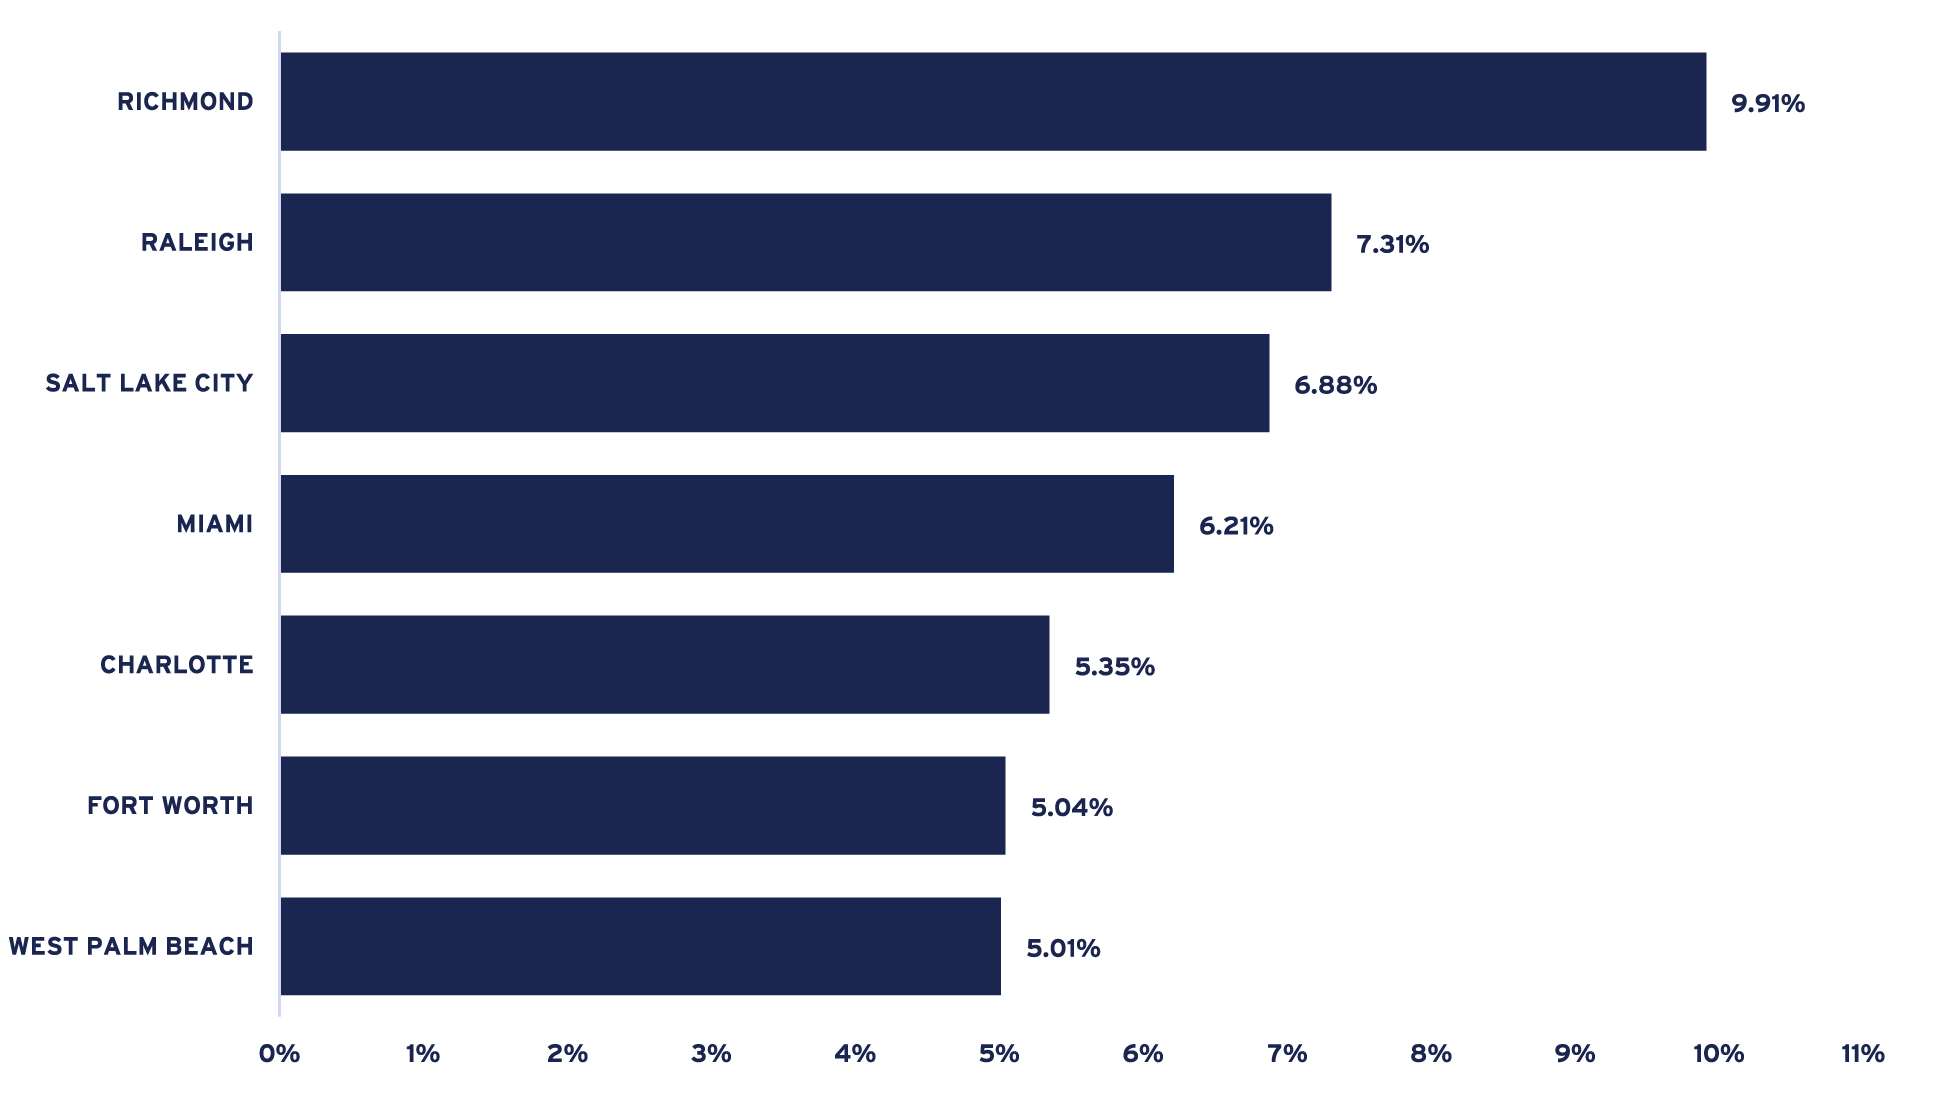
The broader supply-demand balance remains considerably more favorable. On a trailing four-quarter basis, absorption increased to 351,000 units and modestly exceeded the 335,000 units delivered over the same period. More importantly, the supply wave continues to recede, albeit slowly. Trailing four-quarter completions are down 14% from a year ago and nearly 30% from their recent peak of more than 472,000 units in the third quarter of 2024. With fewer projects moving through the development pipeline, new supply should become less of a headwind to apartment fundamentals, but the transition will take time, particularly in markets that continue to show significant development pipelines (see Figure 8).
FIGURE 8: APARTMENT MARKETS WITH UNITS UNDER CONSTRUCTION COMPRISING MORE THAN 5% OF EXISTING INVENTORY
Source: CBRE-EA, Q3 2026
Rent growth is also beginning to respond to the improved balance between supply and demand. CBRE-EA reports year-over-year rent growth of 1.5% in the third quarter, up from just 0.6% in the second quarter. Average rents increased to $2,284 per unit, while revenue per unit rose 1.7% from a year ago. Other industry measures tell a similar story despite differences in coverage and methodology. RealPage reports that annual completions have fallen roughly 46% from their late-2024 peak, narrowing the gap between annual supply and demand to just 13,000 units, the lowest since 2015. Effective rents increased 0.9% year-over-year, the first positive annual increase since mid-2025. Cushman & Wakefield likewise reports that year-to-date absorption has substantially exceeded deliveries and that the number of units under construction has fallen to its lowest level since 2015.
FIGURE 9: APARTMENT MARKET FUNDAMENTALS
Source: CBRE-EA, Q3 2026
Performance remains uneven across markets. Rent growth continues to be strongest in supply-constrained coastal and Midwest markets, with particularly strong gains in the Bay Area. Conversely, several Sun Belt markets continue to work through the effects of elevated recent construction. Even there, however, conditions are beginning to improve. Rent declines have moderated in markets such as Austin and Phoenix, while Cushman & Wakefield reports that vacancy across the South has declined meaningfully from its late-2025 peak as construction pipelines contract.
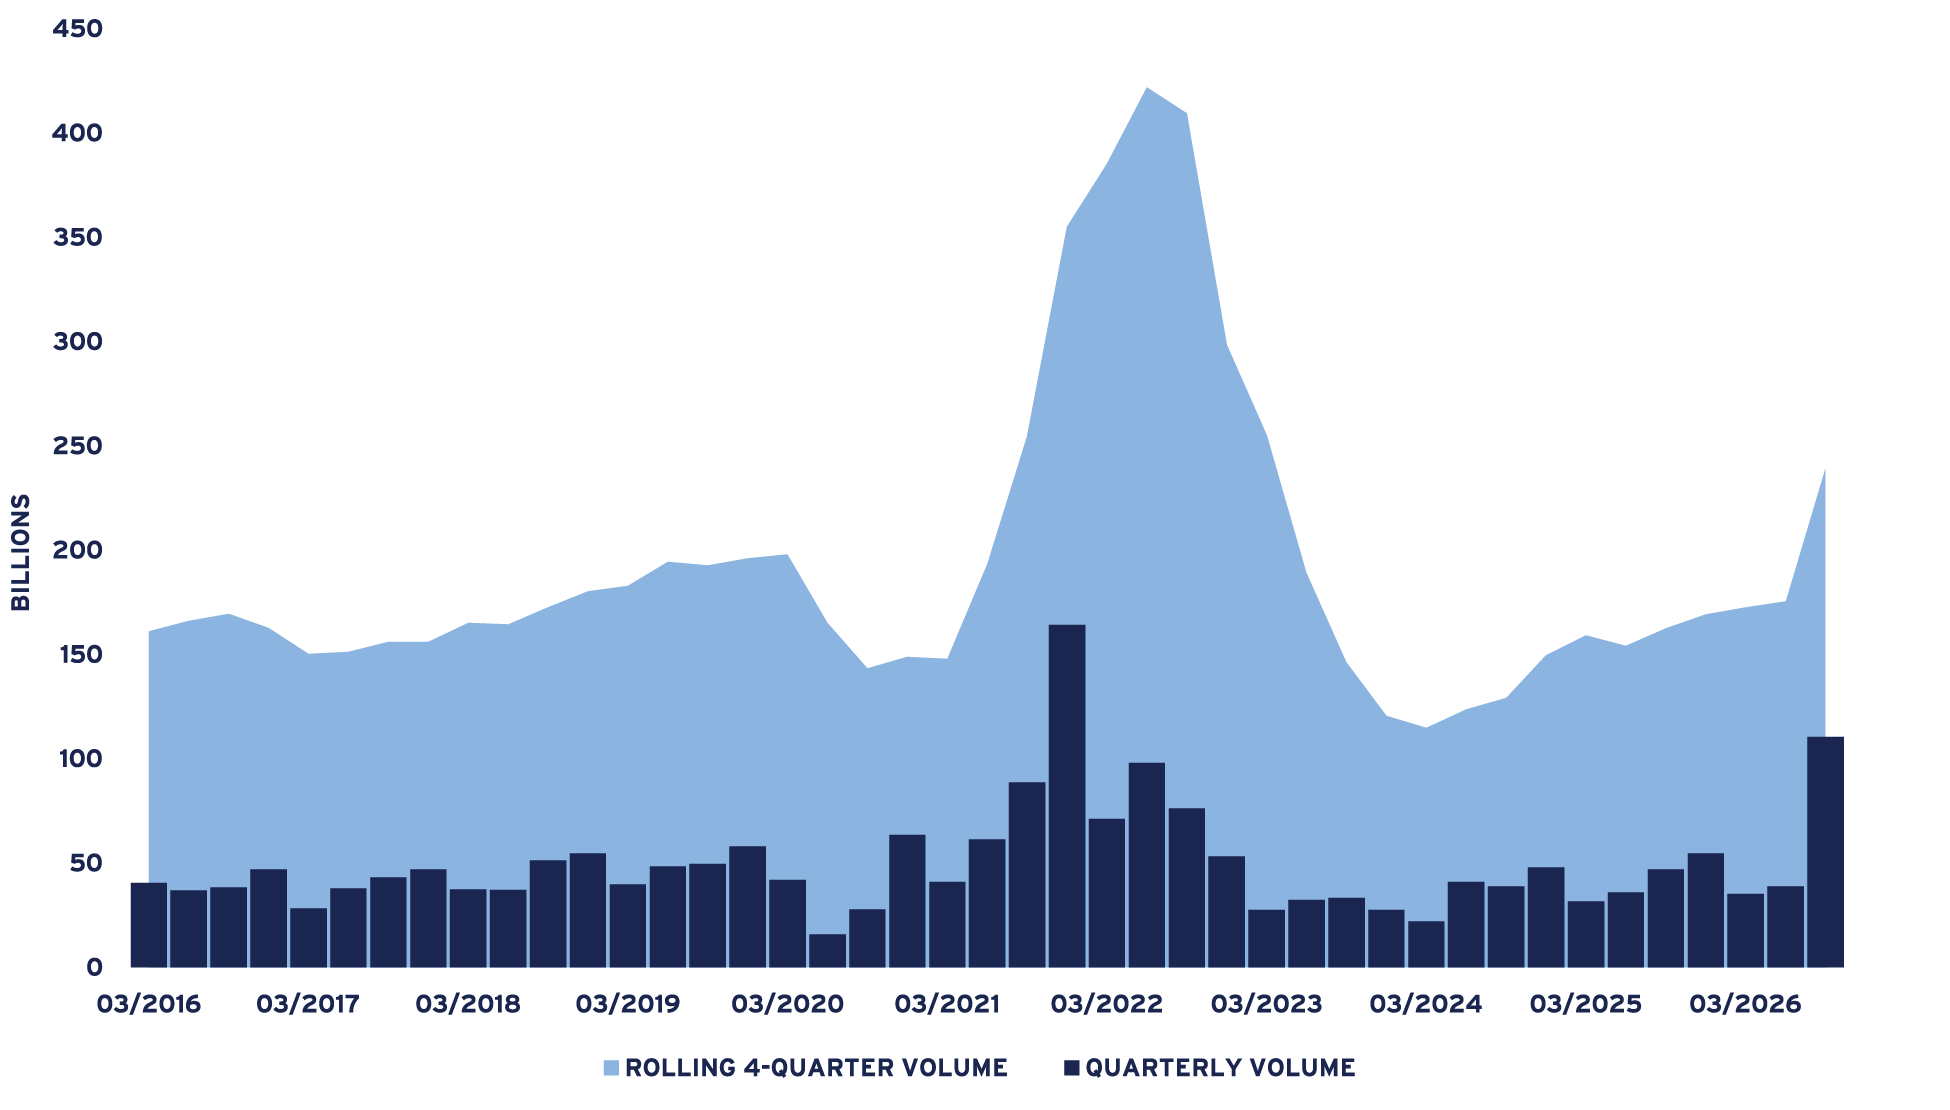
FIGURE 10: RCA U.S. APARTMENT TRANSACTION VOLUME
Source: Real Capital Analytics (RCA), Q3 2026
Apartment investment activity accelerated sharply in the third quarter, although the headline increase was heavily concentrated in portfolio trades, most notably the nearly $70 billion included in the merger between large-cap REITs Equity Residential and AvalonBay. RCA reports $110.4 billion of transaction volume in the third quarter, up 135% from a year earlier, lifting trailing four-quarter volume to $239.0 billion, 47% above the prior-year level. Portfolio volume reached $76.8 billion, while individual-property volume totaled $33.5 billion and declined 13% year-over-year, suggesting that the improvement in broader market liquidity was less pronounced than the headline total. Pricing was comparatively stable, with the average price per unit increasing 0.6% year-over-year to approximately $228,000 while the average cap rate rose 18 basis points to 5.77%.
Overall, the apartment market appears to be moving from stabilization toward recovery. The third-quarter increase in vacancies and the continued use of concessions suggest that the adjustment to the recent supply wave is not yet complete. Nevertheless, demand remains healthy at pre-pandemic levels, annual absorption has again moved ahead of completions, new supply is declining rapidly and rent growth is gradually firming. As the development pipeline continues to contract, the balance of risks is shifting from excess supply toward a more favorable environment for occupancy and income growth.
Industrial
U.S. industrial fundamentals improved during the third quarter, providing additional evidence that the sector is transitioning from stabilization toward recovery. Demand strengthened, availability declined and the supply-demand balance turned more favorable as the development cycle continued to moderate. While market conditions remain less constrained than the exceptionally tight environment of 2021-2022, recent trends suggest that the sector is working through the excess supply delivered during the past several years.
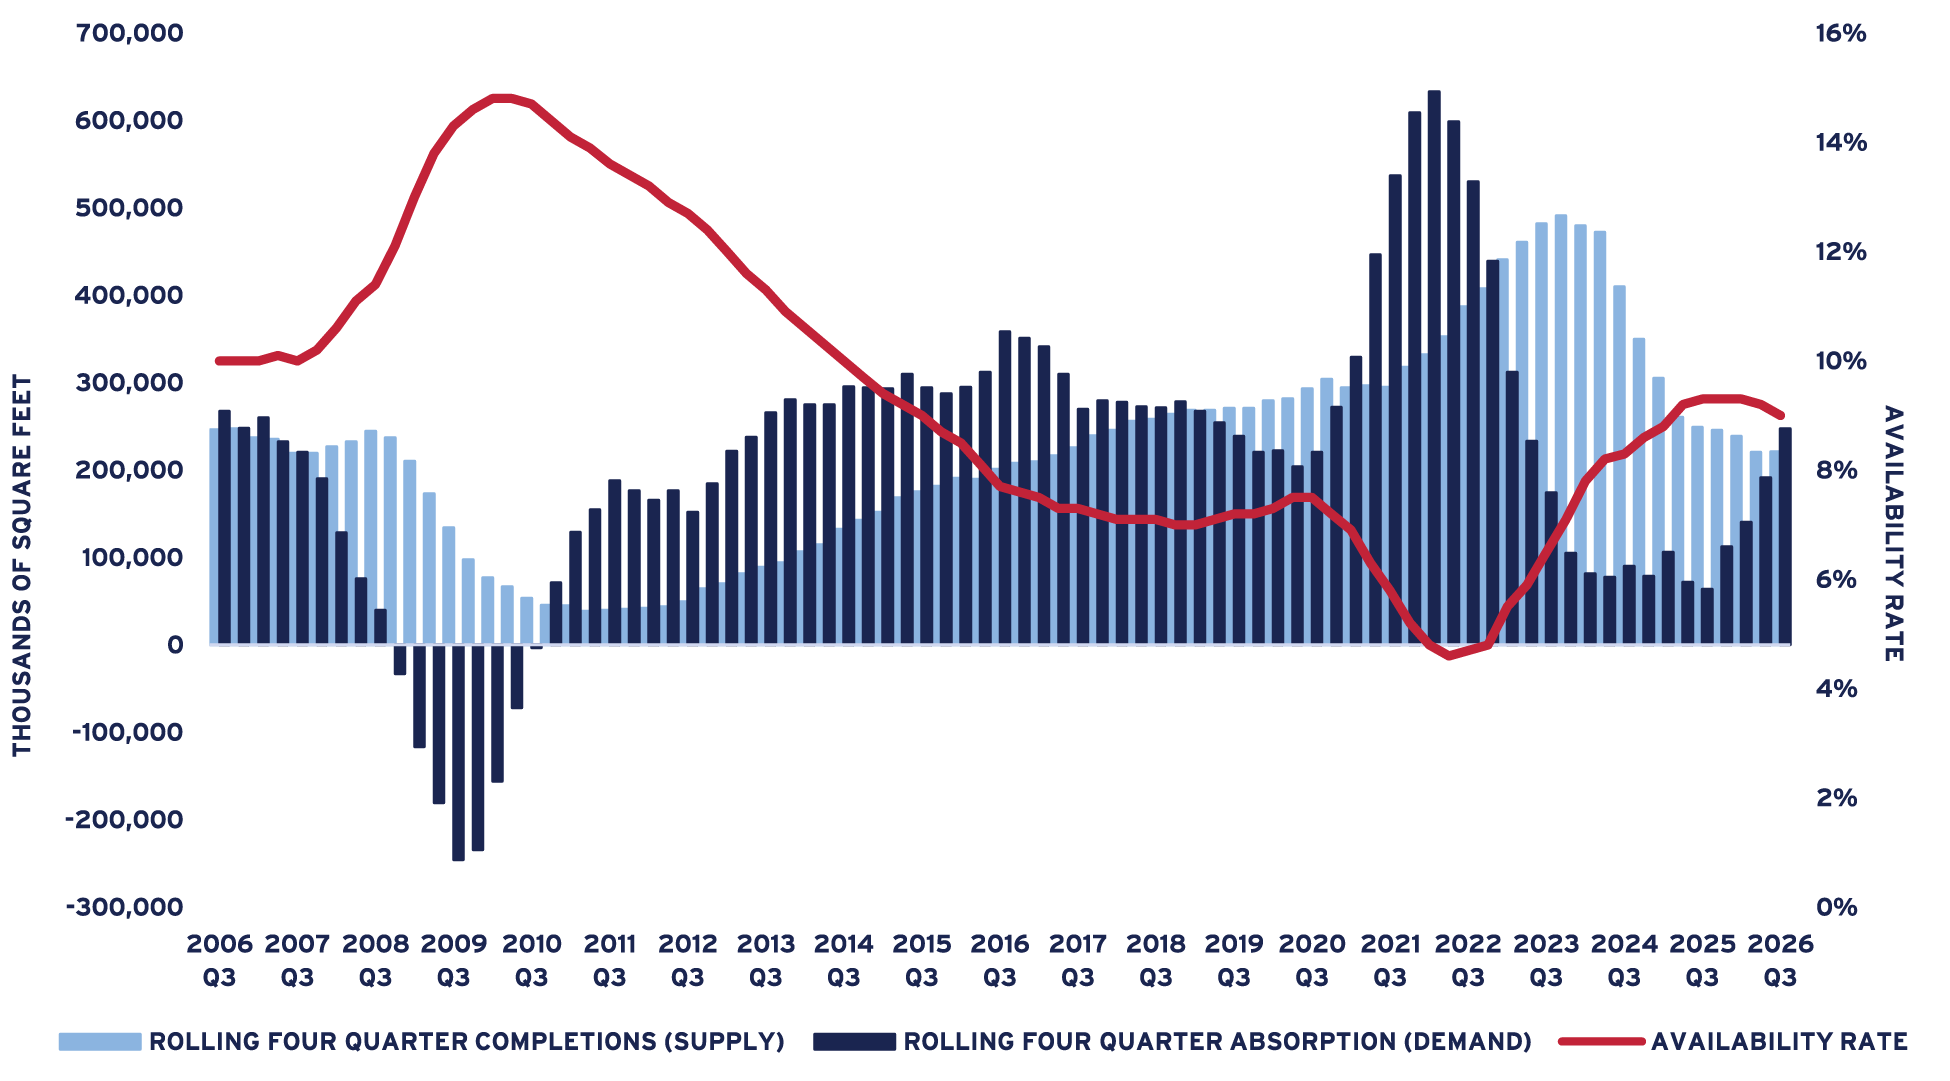
National availability declined to 9.0% in the third quarter, down 20 basis points (bps) from the second quarter and 30 bps from one year earlier. Availability has now declined for two consecutive quarters after plateauing at 9.3% from the third quarter of 2025 through the first quarter of 2026. Total industrial inventory reached approximately 16.8 billion square feet, an increase of 1.3% year-over-year.
The most notable improvement occurred on the demand side. According to CBRE-EA, net absorption totaled approximately 94.6 million square feet (msf) during the quarter, more than double both the 46.7 msf recorded in the second quarter and the 38.2 msf absorbed one year earlier. Absorption exceeded completions by more than 32 msf during the quarter, and on a trailing four-quarter basis reached approximately 247.6 msf, surpassing the 220.8 msf delivered over the same period. This marks the first time since late 2022 that demand has outpaced new supply on a rolling four-quarter basis, an important milestone in the market's rebalancing process. Leasing activity reinforced the improvement in occupier demand. JLL reported 202.6 msf of leasing volume during the third quarter, up 38.5% year-over-year and the strongest quarterly result since the third quarter of 2022. Expansion leases also increased as a share of activity, suggesting that more occupiers are adding capacity rather than simply renewing or relocating existing requirements. Third-party logistics providers remain an important source of demand while AI investment generates additional requirements from equipment suppliers, contractors and related users.
FIGURE 11: U.S. INDUSTRIAL PROPERTY MARKET SUPPLY, DEMAND AND AVAILABILITY RATE
Source: CBRE-EA, Q3 2026
At the same time, new supply continues to moderate. Although third-quarter completions increased from the unusually low level recorded in the prior quarter, trailing four-quarter deliveries remain approximately 55% below the peak reached at year-end 2023. The market is therefore absorbing a growing share of recently delivered space rather than adding materially to excess inventory. Looking ahead, construction activity has begun to recover from cyclical lows, with CBRE tracking more than 250 msf currently under construction. New development remains concentrated in large-box facilities and in markets where leasing demand has strengthened, including Dallas-Fort Worth, Houston, Phoenix and Chicago. Build-to-suit and owner-user projects also represent a larger share of activity than during the recent speculative development cycle, reducing some of the risks associated with future deliveries.
Rent growth remains positive but relatively modest. CBRE-EA's asking rent increased approximately 1.1% year-over-year during the third quarter, while JLL reported average direct asking-rent growth of 3.2%. Taken together, these measures suggest that improving occupancy has not yet translated into broad-based landlord pricing power. Instead, gains remain concentrated within the highest-quality segment of the market. JLL reports particularly strong performance among large, modern, Class A facilities, where vacancy continues to decline and rent growth remains strongest. In contrast, older and smaller properties continue to face weaker leasing conditions in several markets, reflecting occupier preferences for assets capable of supporting automation, higher throughput and more power-intensive operations.
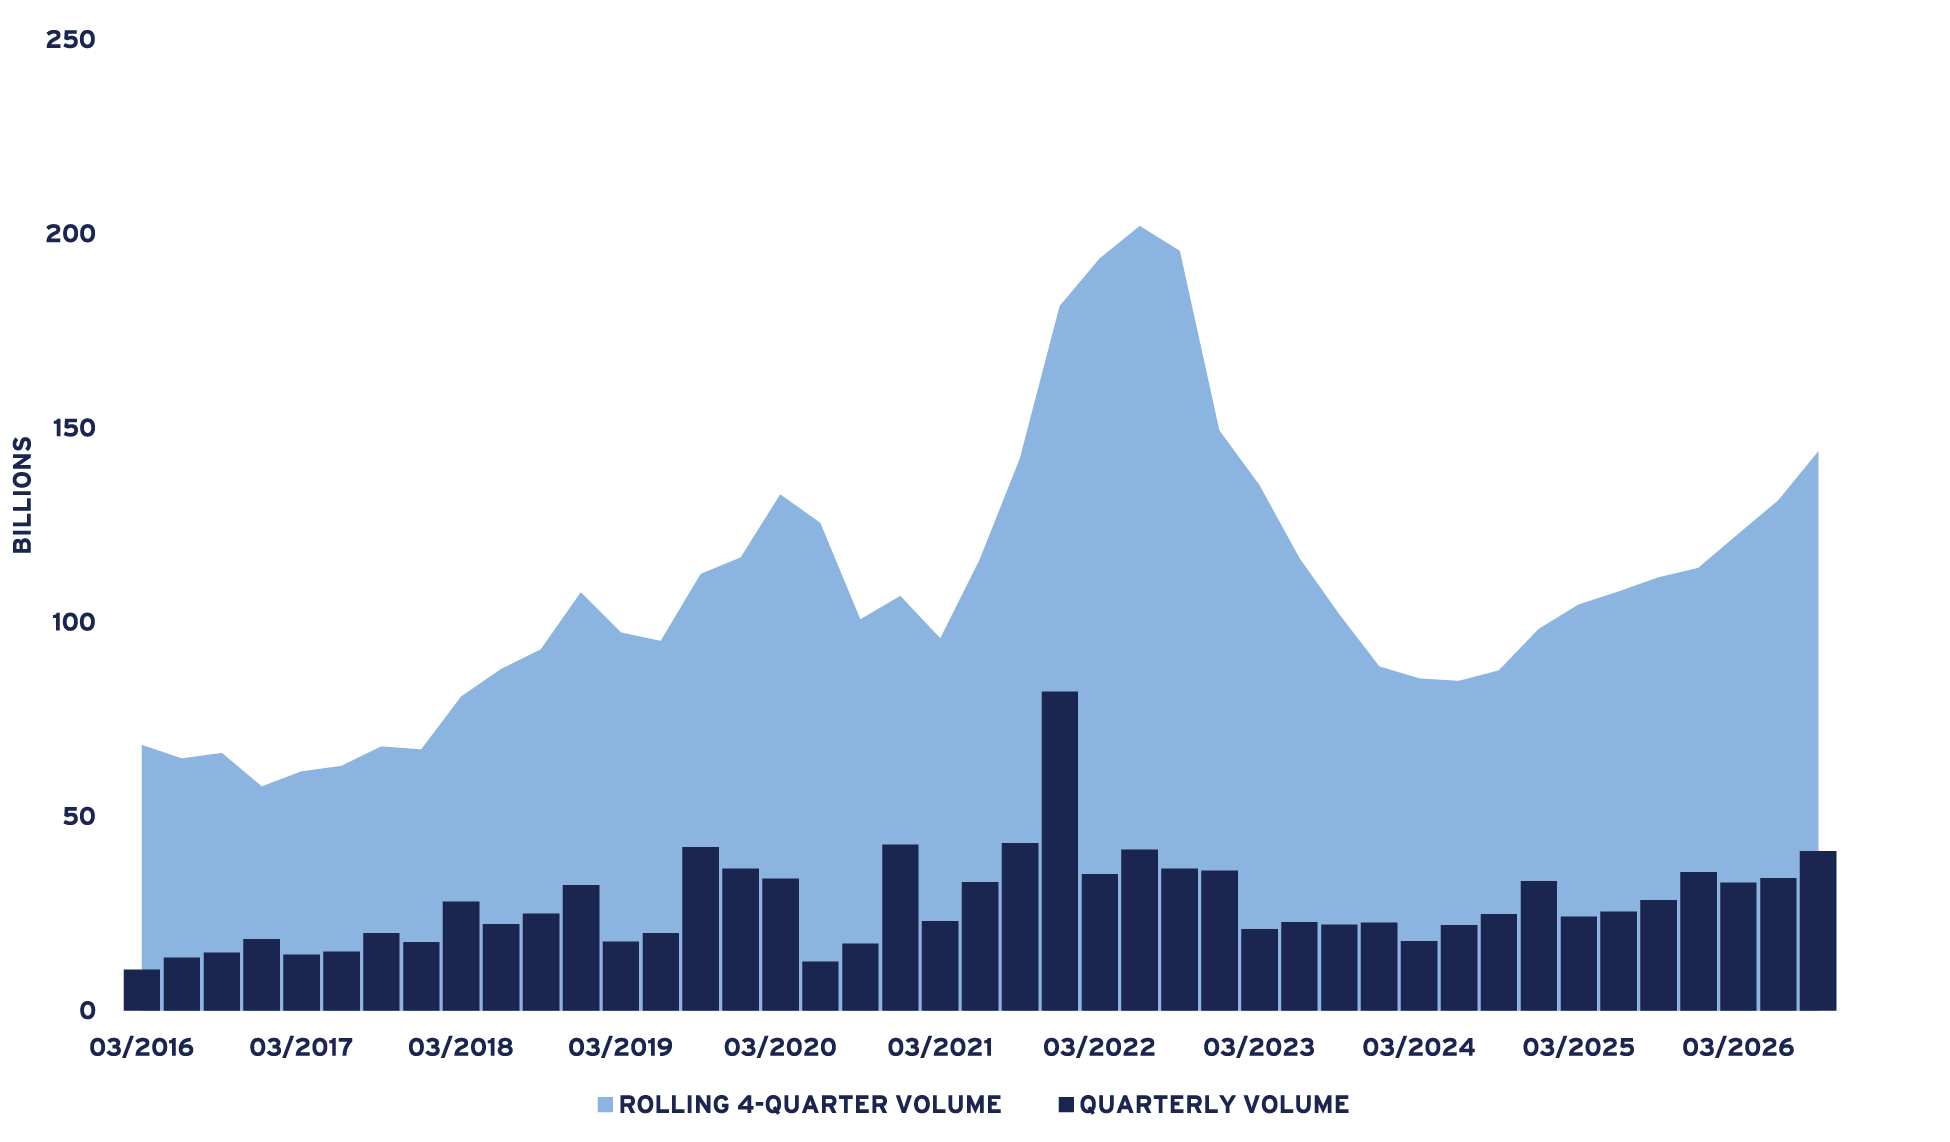
FIGURE 12: RCA U.S. INDUSTRIAL TRANSACTION VOLUME
Source: Real Capital Analytics (RCA), Q3 2026
Capital market conditions also continued to improve. Rolling four-quarter sales volume grew 9.5% from the second to the third quarter, per RCA. With over $41 billion in sales volume for the third quarter alone, institutional investors have increasingly reentered the market alongside private capital. Debt remains available for well-leased assets, although higher Treasury yields continue to constrain pricing and favor properties with visible near-term income growth. Overall, improving transaction activity suggests that investor confidence is recovering even as financing conditions remain less accommodative than during the previous cycle.
Overall, third-quarter results indicate that industrial fundamentals are continuing to strengthen. Demand has rebounded, availability is trending lower and the supply-demand balance has shifted in a more favorable direction. While rising construction activity, elevated availability in certain markets, trade uncertainty and higher interest rates remain potential headwinds, current conditions support a constructive outlook. As in other property sectors, performance is likely to remain increasingly differentiated by market, location and asset quality.
Retail
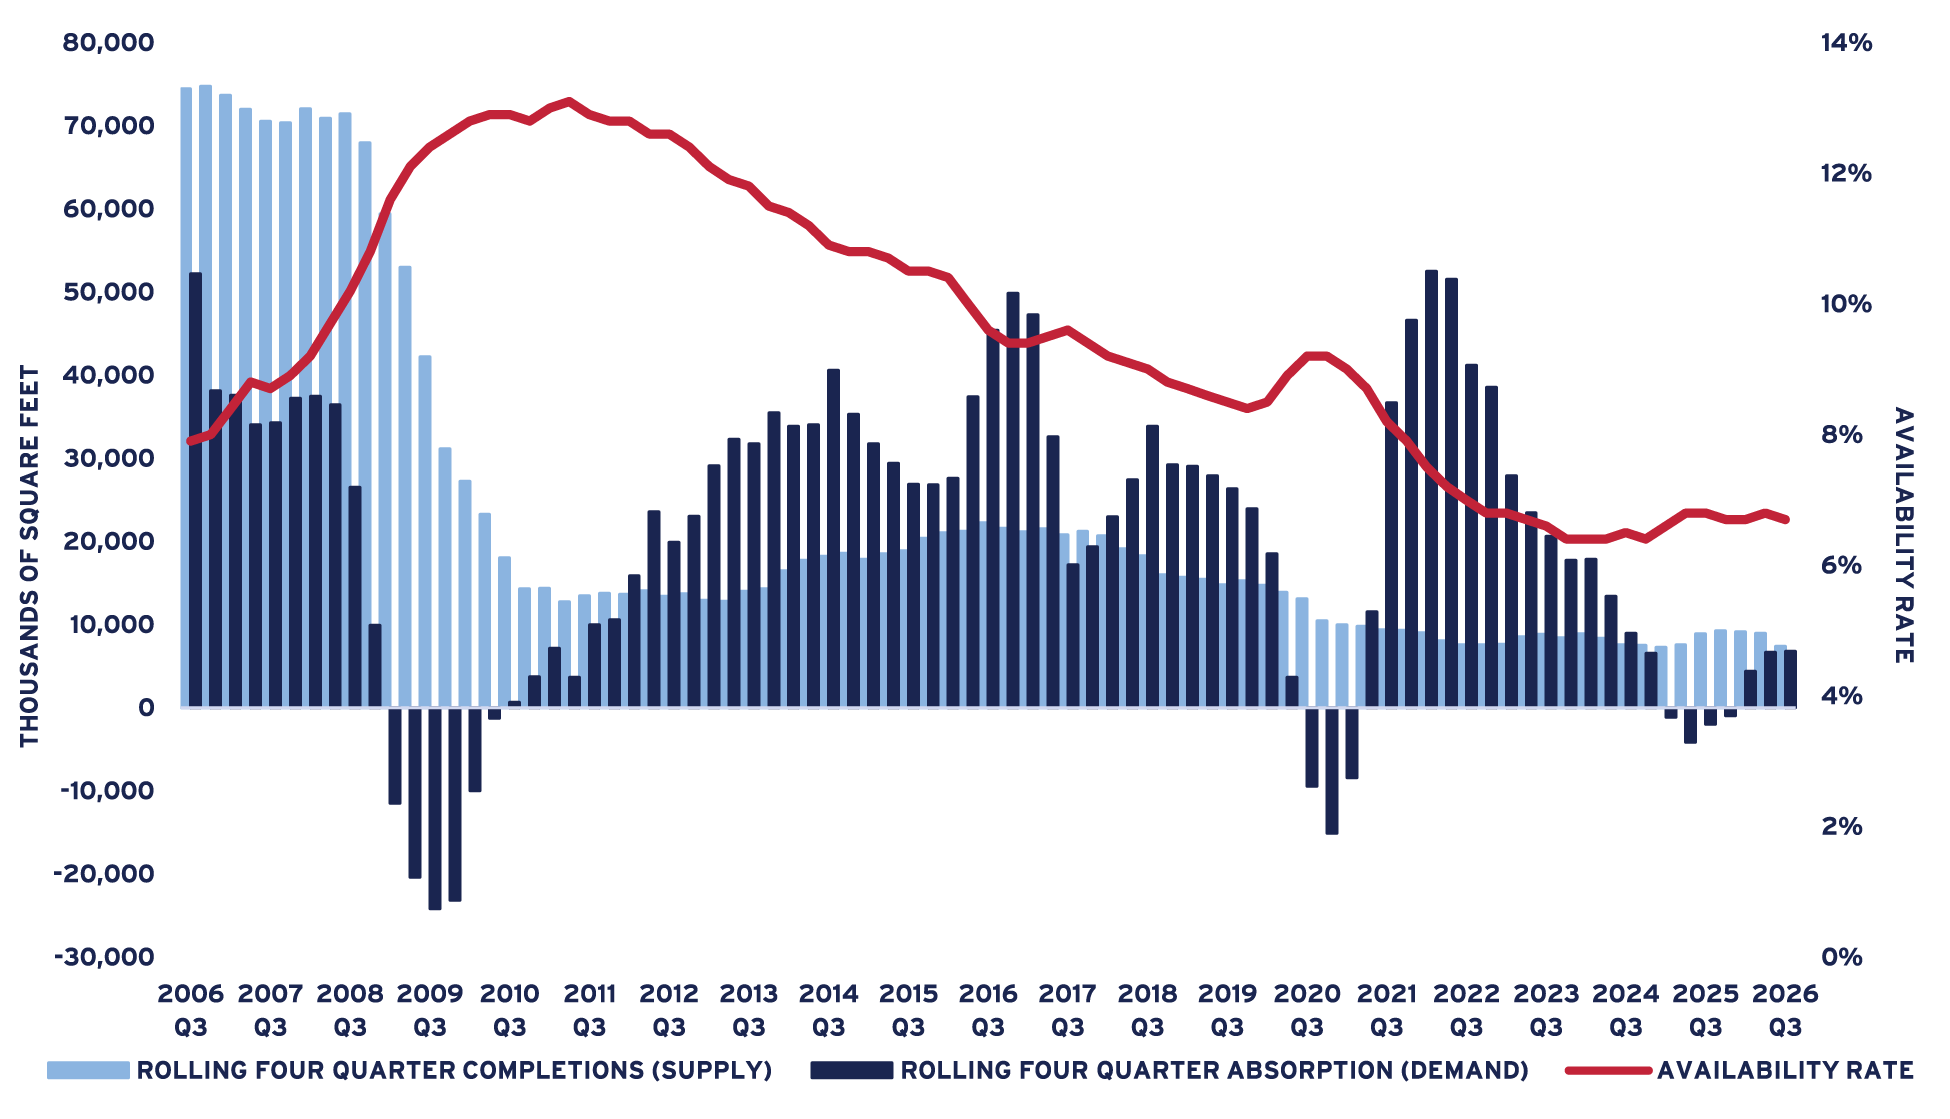
U.S. retail fundamentals strengthened during the third quarter as tenant demand improved and new construction remained muted. Within the neighborhood, community and strip center universe, availability declined 10 basis points (bps) to 6.7%, reversing the small increase recorded in the second quarter. Net absorption increased to approximately 2.4 million square feet (msf) following essentially flat demand during the first half of the year, while year-over-year rent growth accelerated to 2.5%.
Despite rising modestly from the 6.4% low reached in late 2023, availability remains well below the 8.4% rate prevailing at year-end 2019, reflecting continued tightness in the sector, particularly for well-located centers and smaller-format spaces.
Supply growth remains constrained. Approximately 1.3 msf was completed during the third quarter, down 26% from the second quarter and 55% from one year earlier. Trailing four-quarter completions declined to 7.4 msf, roughly half the pace recorded at year-end 2019. As a result, total inventory increased only 0.25% over the past year.
FIGURE 13: U.S. RETAIL SUPPLY, DEMAND & AVAILABILITY RATE
Source: CBRE-EA, Q3 2026
Demand improved meaningfully during the quarter. Net absorption rebounded from slightly negative levels in the second quarter to 2.4 msf and exceeded year-earlier levels. Trailing four-quarter absorption improved to 6.8 msf from negative 2.0 msf one year earlier. Although demand remains below the exceptionally strong post-pandemic period, it has been sufficient to keep availability near historic lows.
EA asking rents increased to $24.89 per square foot (psf), up 0.4% during the quarter and 2.5% year-over-year. While well below the pace recorded earlier in the recovery, rent growth has accelerated from 1.8% a year ago and remains supported by limited space availability.
Other industry measures broadly corroborate the improvement in leasing conditions. Cushman & Wakefield reported stronger shopping center absorption during the third quarter, while Colliers noted continued retailer expansion and backfilling of available space. Grocery, discount, off-price apparel, health and wellness, and other service-oriented retailers remain among the most active tenant categories.
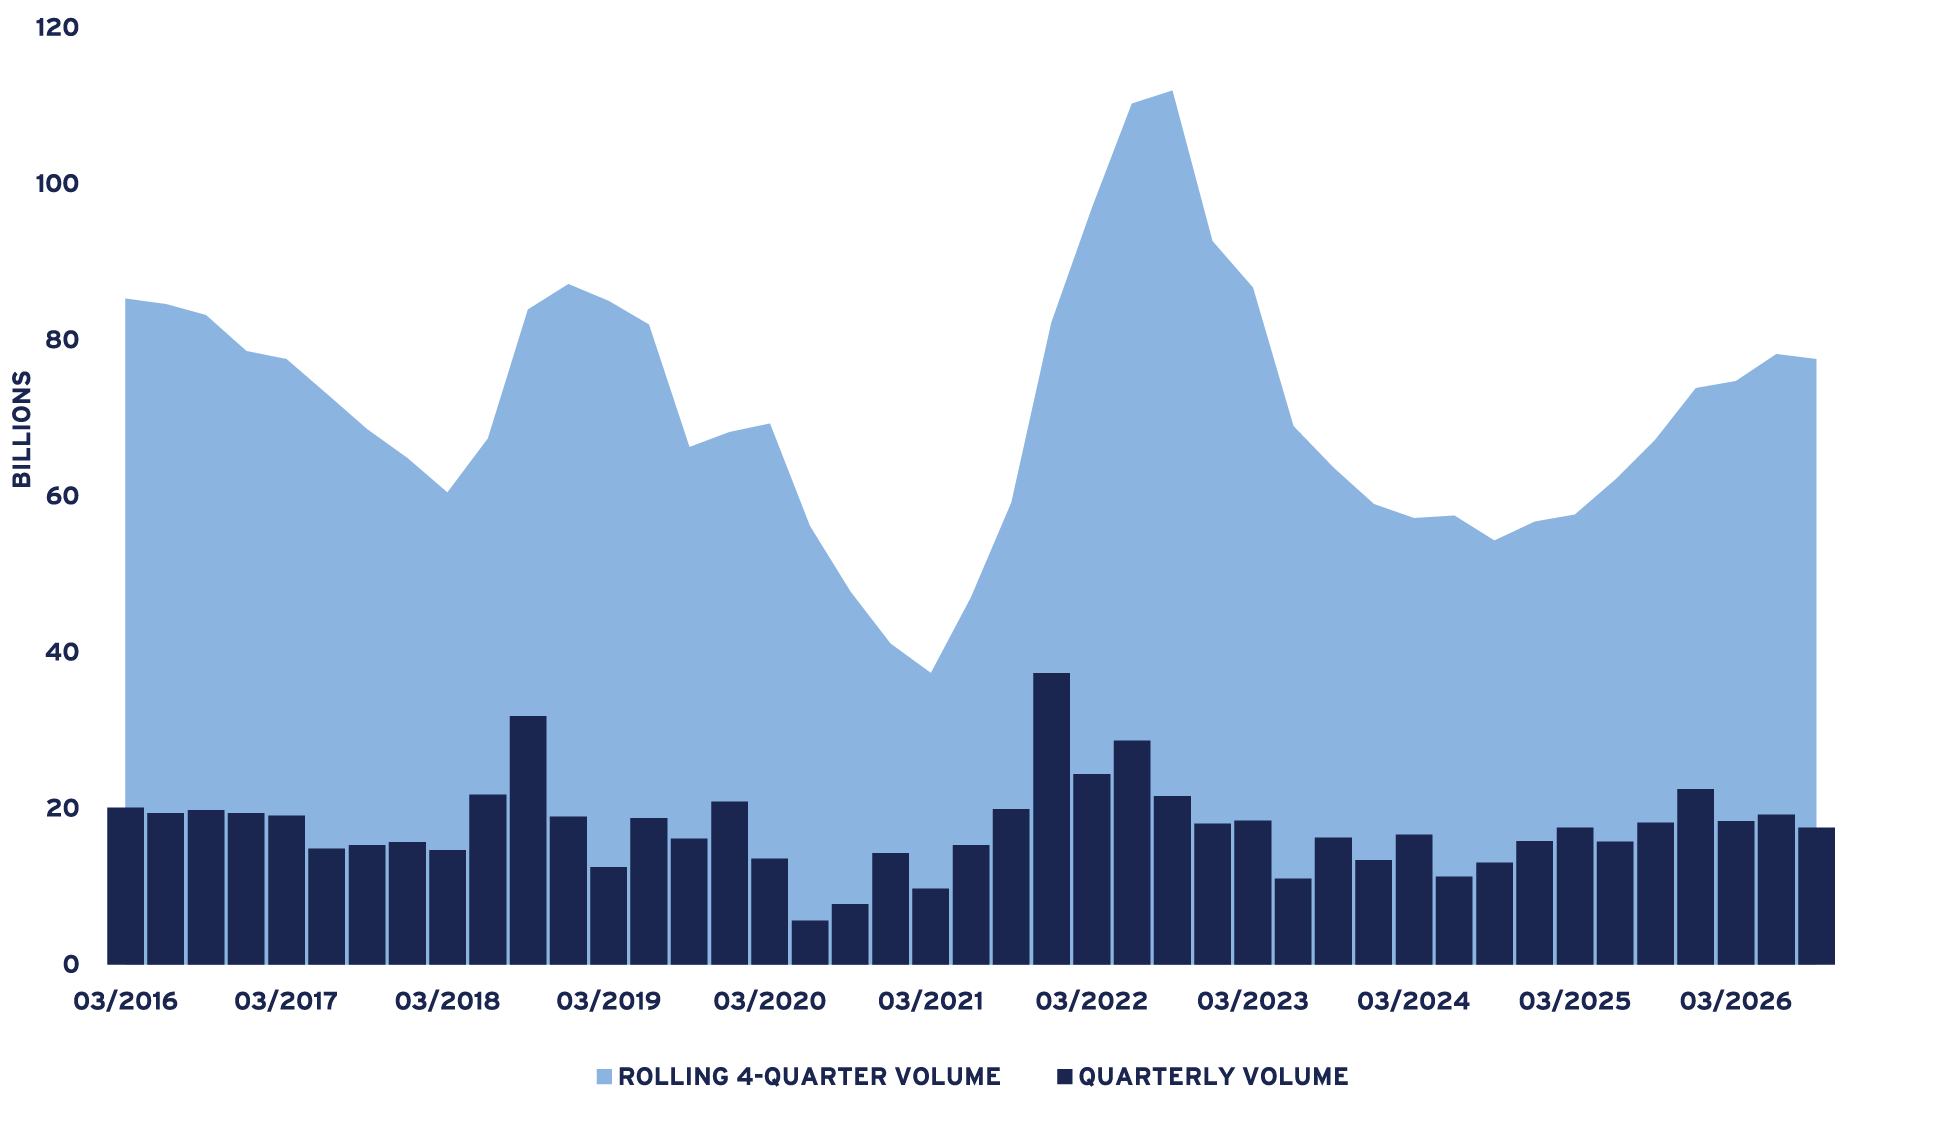
FIGURE 14: RCA U.S. RETAIL TRANSACTION VOLUME
Source: Real Capital Analytics (RCA), Q3 2026
Investment activity remained uneven but continued to recover on a trailing basis. RCA recorded $17.5 billion of retail transaction volume in the third quarter, down 3.5% year-over-year, while rolling four-quarter volume reached $77.5 billion, up 15.4%. The average cap rate increased 12 bps from one year earlier to 7.1%, indicating that improving liquidity has not yet translated into meaningful yield compression.
Overall, retail remains one of the most fundamentally balanced property sectors. Improving demand, limited new supply and historically low availability continue to support occupancy and rent growth, particularly for well-located centers anchored by grocery, value-oriented and service-based tenants.
For more information, please contact:
MICHAEL ACTON, CFA®
Managing Director, Head of Research & Strategy, North America
michael.acton@aew.com
+1.617.261.9577
JAY STRUZZIERY, CFA®
Head of Investor Relations
jay.struzziery@aew.com
+1.617.261.9326
This material is intended for information purposes only and does not constitute investment advice or a recommendation. The information and opinions contained in the material have been compiled or arrived at based upon information obtained from sources believed to be reliable, but we do not guarantee its accuracy, completeness or fairness. Opinions expressed reflect prevailing market conditions and are subject to change. Neither this material, nor any of its contents, may be used for any purpose without the consent and knowledge of AEW. There is no assurance that any prediction, projection or forecast will be realized.